Thiolated DNA-templated silver nanoclusters with strong fluorescence emission and a long shelf-life†
Xiaohong
Zhang‡
,
Yunxia
Qian‡
,
Xuejuan
Ma
,
Mengfan
Xia
,
Shuangqin
Li
and
Yaodong
Zhang
 *
*
Key Laboratory of Analytical Chemistry for Life Science of Shaanxi Province, Key Laboratory of Applied Surface and Colloid Chemistry, Ministry of Education, School of Chemistry and Chemical Engineering, Shaanxi Normal University, Xi'an 710062, PR China. E-mail: ydzhang@snnu.edu.cn; Fax: +86-29-81530727; Tel: +86-29-81530726
First published on 24th November 2017
Abstract
Thiolated DNA (DNA-SH) was employed as a template in the synthesis and stabilization of AgNCs (DNA-SH-AgNCs). Resulting from the synergistic protective effect of specific Ag+–DNA interactions and Ag–S bonding, DNA-SH-AgNCs exhibited high quantum yields and resistance to oxidation.
Noble metal nanoclusters exhibit discrete, size-tunable electronic transitions and strong fluorescence emission because of the strong quantum-confinement effect.1 Research on metal nanoclusters has primarily focused on Au clusters given their high stability. Recent years have witnessed the rapid development of fluorescent silver nanoclusters (AgNCs) with ultrasmall sizes, low toxicity, and strong fluorescence.2 Therefore, AgNCs have been extensively applied in photochemistry,3 bioimaging,4 catalysis,5 and sensing.6 However, unlike Au clusters, the susceptibility of silver to tarnishing (oxidation) has limited the application of AgNCs. Therefore, the fabrication of AgNCs that remain highly stable under air oxidation and with strong fluorescence emission is highly desired.
Various methods have been established for the synthesis of stable, water-soluble AgNCs by using dendrimers,7 proteins,8 thiols,9 polymers,10 polypeptides,11 DNA,12,13 and other ligands to stabilize silver ions.14 For example, fluorescent AgNCs synthesized with DNA molecules as scaffolds in aqueous solution are widely accepted as novel biocompatible templates.15 DNA-templated AgNCs (DNA-AgNCs) exhibit outstanding spectral and photophysical properties, and their fluorescence emission band can be fine-tuned by merely changing the sequence of the DNA scaffold. These nanoclusters display excellent photostability, subnanometer sizes, nontoxicity, and biocompatibility and are thus appropriate fluorescent probes in biochemical applications,2 such as optical sensing,16 nanodevice research,17 and DNA-based nanomachines.18 However, most AgNCs have short shelf-lives because they easily oxidize in air or under an O2 atmosphere.2 Thus, the use of DNA-AgNCs as biological labels is limited given their fragility and sensitivity to environmental factors.19
Meanwhile, the number of atomically stable, monodisperse, thiolate-protected AgNCs has increased; these nanoclusters have attracted considerable research attention given their potential applications as cheaper alternatives to gold.9,20,21 Since the highly stable silver thiolate clusters were first discovered,22 identified as Ag44(SR)304−, and subsequently crystallized,9 several studies have shown that thiol-protected AgNCs consist of a central silver core that is surrounded by tightly coordinated metal thiolates.21 However, thiolate-protected AgNCs usually exhibit low quantum yields (QYs).23 For example, at the maximum emission wavelength (650 nm), the measured QYs of Ag15(SG)11 and Ag32(SG)19 are 2.9% and 0.8%, respectively.24 Recent studies have revealed that surface ligands can influence the fluorescence emission,25 the magic sizes26 as well as the isomerization27 of thiolate-protected AuNCs.
In this work, we attempt to improve the photophysical properties of AgNCs through exploiting the specific Ag–DNA interactions and Ag–S bonding of thiolated DNA (DNA-SH).
AgNCs can be prepared by DNA scaffolding or by reducing a metal-thiolate precursor. The sequences of single-stranded DNA (Table 1) were directly adopted from the literature (dC6,28 dC12![[thin space (1/6-em)]](https://www.rsc.org/images/entities/char_2009.gif) 29 and DNA430) or designed (DNA3) by us. Then, these DNAs and the matched DNA-SHs were used as templates for the synthesis of AgNCs according to a previously reported procedure (Experimental details, section S3, ESI†),29,30 respectively. UV-Vis absorption (Fig. 1) spectroscopy and transmission electron microscopy (TEM) (section S4, and ESI, Fig. S1†) were used for the characterization of AgNCs. The UV-Vis absorption spectra of dC12-SH-AgNCs (Fig. 1A) resolved into two strong peaks at 445 and 579 nm. The electronic transitions for Ag2 and Ag3 are expected in this spectral region.31–33 For nanoparticles, a single peak that dominates the absorption spectrum can be observed as localized surface plasmon resonance excitation.23 The peak positions did not change after the solutions were centrifuged. This result indicated that the peaks could not be assigned to Ag nanoparticles. Upon excitation at 579 nm, the dC12-SH-AgNCs showed the maximum emission at 635 nm (Fig. 1B). The fluorescence detection window of Ag15(SG)11 at ∼630 nm indicated fluorescence from the metal–metal core state and from the metal–ligand fluorescence state.23 However, the dC12-SH-AgNCs did not emit fluorescence upon excitation at 445 nm. To investigate the spectral properties and stability of the dC12-SH-AgNCs, we studied the changes in the UV-Vis and fluorescence spectra of the nanoclusters with storage time (at 4 °C). With prolonged storage time, the absorption at 445 nm gradually decreased, and the absorption at 579 nm considerably increased. The absorbance at 579 nm reached the maximum value on day 5 of storage and then remained stable at 4 °C. The absorbance began to decrease with time after 10 days. The fluorescence intensity of the dC12-SH-AgNCs at 635 nm is shown in the inset of Fig. 1B. The fluorescence emission of dC12-SH-AgNCs remained strong and stable from days 4 to 10 of storage and then gradually decreased in intensity with storage time. However, the strong fluorescence emission of dC12-SH-AgNCs persisted after 30 days of storage.
29 and DNA430) or designed (DNA3) by us. Then, these DNAs and the matched DNA-SHs were used as templates for the synthesis of AgNCs according to a previously reported procedure (Experimental details, section S3, ESI†),29,30 respectively. UV-Vis absorption (Fig. 1) spectroscopy and transmission electron microscopy (TEM) (section S4, and ESI, Fig. S1†) were used for the characterization of AgNCs. The UV-Vis absorption spectra of dC12-SH-AgNCs (Fig. 1A) resolved into two strong peaks at 445 and 579 nm. The electronic transitions for Ag2 and Ag3 are expected in this spectral region.31–33 For nanoparticles, a single peak that dominates the absorption spectrum can be observed as localized surface plasmon resonance excitation.23 The peak positions did not change after the solutions were centrifuged. This result indicated that the peaks could not be assigned to Ag nanoparticles. Upon excitation at 579 nm, the dC12-SH-AgNCs showed the maximum emission at 635 nm (Fig. 1B). The fluorescence detection window of Ag15(SG)11 at ∼630 nm indicated fluorescence from the metal–metal core state and from the metal–ligand fluorescence state.23 However, the dC12-SH-AgNCs did not emit fluorescence upon excitation at 445 nm. To investigate the spectral properties and stability of the dC12-SH-AgNCs, we studied the changes in the UV-Vis and fluorescence spectra of the nanoclusters with storage time (at 4 °C). With prolonged storage time, the absorption at 445 nm gradually decreased, and the absorption at 579 nm considerably increased. The absorbance at 579 nm reached the maximum value on day 5 of storage and then remained stable at 4 °C. The absorbance began to decrease with time after 10 days. The fluorescence intensity of the dC12-SH-AgNCs at 635 nm is shown in the inset of Fig. 1B. The fluorescence emission of dC12-SH-AgNCs remained strong and stable from days 4 to 10 of storage and then gradually decreased in intensity with storage time. However, the strong fluorescence emission of dC12-SH-AgNCs persisted after 30 days of storage.
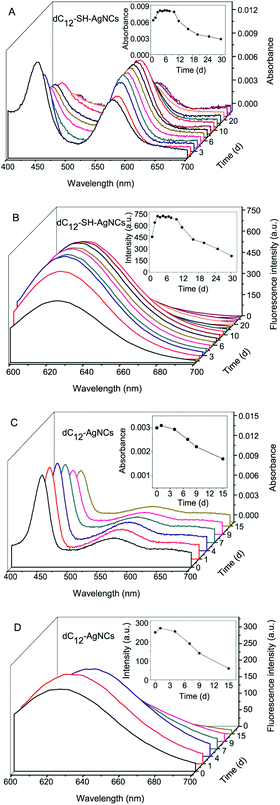 | ||
| Fig. 1 UV-Vis and fluorescence spectra of the dC12-SH-AgNCs (A and B, respectively) and dC12-AgNCs (C and D, respectively). | ||
We synthesized dC12-AgNCs using dC12 as a template for comparison with the dC12-SH-AgNCs. Then, we investigated the properties of the UV-Vis (Fig. 1C) and fluorescence spectra (Fig. 1D) of the dC12-AgNCs. As reported in the literature,29 two absorption peaks (Fig. 1C) at 445 and 579 nm were found in the visible region. However, unlike those of the dC12-SH-AgNCs, the absorbances of the dC12-AgNCs at 445 and 579 nm decreased with storage time. Furthermore, the absorbance of dC12-AgNCs at 445 nm was considerably higher than that at 579 nm, the same as the reported literature.29 The UV-Vis spectral peaks at 445 and 579 nm for DNA-AgNCs and DNA-SH-AgNCs (Fig. 1A and C) were similar. The signals at 579 nm for DNA-SH-AgNCs, however, were stronger as a likely result of an environmental effect of ligands.34 Similar to that of dC12-SH-AgNCs, the maximum emission wavelength of dC12-AgNCs was 635 nm under excitation at 579 nm. In addition, the dC12-AgNCs did not emit fluorescence when excited at 445 nm (Fig. 1D). However, the fluorescence emission intensity of the dC12-AgNCs was considerably lower than that of the dC12-SH-AgNCs. The measured QY (day 3) of the dC12-SH-AgNCs was 43.7% ± 2.4% (n = 3), or approximately 1.9-fold higher than that of the dC12-AgNCs (22.9% ± 3.2%). The emissive state of AgNCs was very short-lived. The fast dynamics of fluorescence emission is connected to the QYs. The dC12-SH-AgNCs exhibited a single decay time of 2.21 ns (CHISQ = 1.15) (Fig. S2†). This short lifetime resulted from quenching by electron–phonon coupling through Auger relaxation.35 However, as with the dC12-AgNCs, the time-dependent data did not fit well into a single-decay time (3.01 ns, CHISQ = 1.28) (Fig. S3A†). A two-component fit (Fig. S3B†) returned the values of τ1 = 1.19 ns and τ2 = 3.07 ns, as well as CHISQ = 1.26. These values suggest a more complex emission mechanism than that of the single decay of the dC12-SH-AgNCs emission. Therefore, different species of the dC12-AgNCs likely exist. At 635 nm, the fluorescence emission of dC12-SH-AgNCs sharply decreased and became unstable during storage (Fig. 1B). Approximately only 20% of the fluorescence intensity remained after 15 days of storage. The fluorescence emission of the dC12-SH-AgNCs was approximately 9-fold stronger than that of the dC12-AgNCs after 15 days of storage. The dC12-SH-AgNCs were also more stable than the dC12-AgNCs. It was also found that dC12-SH-AgNCs were stable under the tested conditions (pH 6.0–9.0, 5 mM phosphate buffer), which is the same as dC12-SH-AgNCs (Fig. S4†). These results indicated that the mercapto groups (–SH) at the terminus of the DNA chain facilitated the formation and stabilization of the AgNCs.
To further confirm these findings, we used other DNA-SH sequences as templates for AgNC synthesis and characterized the spectroscopic properties of DNA-SH-AgNCs. The base numbers of dC6-SH and dC6 decreased to half of those of dC12-SH and dC12, respectively. The UV-Vis spectra of the dC6-SH-AgNCs (Fig. S5A†) presented four absorption peaks with the maximum wavelengths of 345, 397, 444, and 580 nm. These transitions were within the spectral region for small AgNCs.29,36 The absorbance at 580 nm was the strongest. The maximum visible value of the dC6-SH-AgNCs was obtained on day 1 of storage and remained stable until day 12 of storage (Fig. S5A†). The strong fluorescence at 640 nm was emitted under excitation at 580 nm (Fig. S5B†). The emission spectrum of dC6-SH-AgNCs was investigated as a function of time (Fig. S5B†). Consistent with the trends observed for the UV-Vis spectra of the dC6-AgNCs, the fluorescence intensity of dC6-SH-AgNCs was the strongest on day 1 of storage and then tended to stabilize. The UV-Vis and fluorescence spectra of the dC6-AgNCs are shown in Fig. S5C and D,† respectively. The maximum absorbance wavelength of the dC6-AgNCs was observed at 450 nm, and the absorbance wavelength gradually decreased with storage time. However, no fluorescence emission was observed under 450 nm excitation. A weak fluorescence emission at 640 nm was observed upon excitation at 580 nm. The fluorescence emission gradually increased with time but the overall fluorescence intensity was very low. These results showed the difficulty in fabricating fluorescent AgNCs with dC6-AgNCs as the template and further demonstrated that the –SH in the DNA chain can help form stable AgNCs. Furthermore, considering that the fluorescence emission of dC6-SH-AgNCs was much stronger than that of dC6-AgNCs, and the absorbance at 580 nm appeared in the absorption spectrum of dC6-SH-AgNCs, the –SH group may cause more significant differences on the short DNA template. The AgNCs synthesized with other DNA pairs (DNA3-SH vs. DNA3 and DNA4-SH vs. DNA4) showed very weak UV-Vis absorbance (Fig. S6A, S6C, S7A and S7C†). However, the fluorescence emission properties (Fig. S6B, S6D, S7B and S7D†) of the AgNCs synthesized with these DNA pairs also revealed that the –SH group at the terminus of the DNA chain helped improve the formation and stabilization of the DNA-AgNCs. Thus, the AgNCs synthesized using DNA-SH (i.e., dC12-SH, dC6-SH, DNA3-SH, and DNA4-SH) exhibited enhanced fluorescence and longer shelf-lives than those synthesized with the same DNA sequence without –SH.
To understand the effect of DNA-SH on the formation and stability of DNA-SH-AgNCs, we utilized UV-Vis and circular dichroism (CD) spectroscopy to investigate the interaction of silver ions and nanoclusters with DNA-SH (Fig. 2). In Fig. 2A, the maximum absorbance wavelength of dC12-SH shifted from 262 nm (Fig. 2A(a)) to 272 nm (Fig. 2A(b)) after the addition of AgNO3 (1 Ag+![[thin space (1/6-em)]](https://www.rsc.org/images/entities/char_2009.gif) :
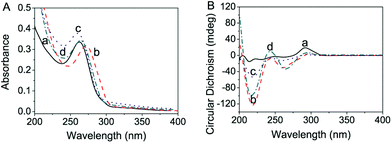
:![[thin space (1/6-em)]](https://www.rsc.org/images/entities/char_2009.gif) 2 base) given the formation of a silver complex with dC12-SH. The spectra shifted from 272 nm (Fig. 2A(b)) to 260 nm (Fig. 2A(c)) as the silver ions were reduced by NaBH4 and the molar absorbance coefficient increased. This latter effect was likely achieved because the newly formed AgNCs possessed overlapping electron bands in this spectral region33 or because the dC12-SH-AgNCs might have altered the structure of the silver complex with dC12-SH, thereby altering the excitation between the coupling of electrons in the base dipole state. These observations are similar to that of dC12-AgNCs.31 This possibility can be verified by the CD spectra of the DNA-SH-AgNCs (Fig. 2B). Finally, the maximum absorbance shifted to 273 nm, and the molar absorptivity decreased because of the change in the size of the dC12-SH AgNCs.31 Given the chirality of ribose, the electron transition of the base exhibited a small CD, which is sensitive to the order by which the bases are arranged. Upon the interaction of Ag+ with NaBH4, two strong negative peaks appeared at 220 and 261 nm, and the peak at 290 nm decreased in amplitude (Fig. 2B). This result was similar to that reported in the literature.31 After Ag+ was reduced by the addition of NaBH4, all of the peaks at 220, 261, and 290 nm decreased and then slightly increased in amplitude after 18 h of aging. These results demonstrated that the structural changes in dC12-SH were induced by the addition of AgNO3 and NaBH4. The UV-Vis and CD spectral peaks for dC12 (Fig. 2 and Fig. S8†) were similar (blue shift ∼1 nm in the UV-Vis spectra). However, the signals, especially in the UV-Vis spectra, were stronger as a likely result of the presence of the mercapto group.
2 base) given the formation of a silver complex with dC12-SH. The spectra shifted from 272 nm (Fig. 2A(b)) to 260 nm (Fig. 2A(c)) as the silver ions were reduced by NaBH4 and the molar absorbance coefficient increased. This latter effect was likely achieved because the newly formed AgNCs possessed overlapping electron bands in this spectral region33 or because the dC12-SH-AgNCs might have altered the structure of the silver complex with dC12-SH, thereby altering the excitation between the coupling of electrons in the base dipole state. These observations are similar to that of dC12-AgNCs.31 This possibility can be verified by the CD spectra of the DNA-SH-AgNCs (Fig. 2B). Finally, the maximum absorbance shifted to 273 nm, and the molar absorptivity decreased because of the change in the size of the dC12-SH AgNCs.31 Given the chirality of ribose, the electron transition of the base exhibited a small CD, which is sensitive to the order by which the bases are arranged. Upon the interaction of Ag+ with NaBH4, two strong negative peaks appeared at 220 and 261 nm, and the peak at 290 nm decreased in amplitude (Fig. 2B). This result was similar to that reported in the literature.31 After Ag+ was reduced by the addition of NaBH4, all of the peaks at 220, 261, and 290 nm decreased and then slightly increased in amplitude after 18 h of aging. These results demonstrated that the structural changes in dC12-SH were induced by the addition of AgNO3 and NaBH4. The UV-Vis and CD spectral peaks for dC12 (Fig. 2 and Fig. S8†) were similar (blue shift ∼1 nm in the UV-Vis spectra). However, the signals, especially in the UV-Vis spectra, were stronger as a likely result of the presence of the mercapto group.
X-ray photoelectron spectroscopy (XPS) was further used to demonstrate the interactions of AgNCs with DNA-SH. The presence of Ag, Na, P, O, and N was confirmed in the XPS spectrum (Fig. 3A). S was not observed in the XPS survey spectrum of the dC12-SH-AgNCs because of the weak signal of this element. By contrast, dC12-SH exhibited three S peaks at the binding efficiencies of 163.29, 164.18, and 168.59 eV in the expanded spectrum in the S 2p region (Fig. 3B). The two adjacent peaks of 163.29 and 164.18 eV were relatively strong and corresponded to reduced S, whereas the peak at 168.59 eV corresponded to the oxidized S. dC12-SH-AgNCs were formed as dC12-SH reacted with AgNO3 and NaBH4. The bonding energy of the reduced sulfur shifted greatly from 163.29 eV to 160.75 eV and from 164.18 eV to 162.02 eV. These shifts signified the formation of the Ag–S bond.37,38 The Ag 3d5/2 bonding energies of the dC12-SH-AgNCs and dC12-AgNCs were 368.066 and 368.037 eV (Fig. 3C), respectively, and were similar to that of Ag0 in the AgNCs reported in the literature.39,40 Thus, the silver in the dC12-SH-AgNCs and dC12-AgNCs was mainly present in the form of Ag0.
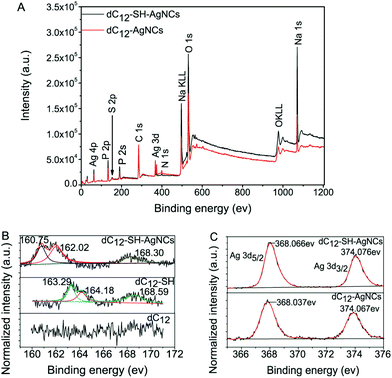 | ||
| Fig. 3 (A) XPS survey spectrum of the AgNCs. (B) Expanded spectrum in the S 2p region. (C) Expanded spectrum in the Ag 3d region. | ||
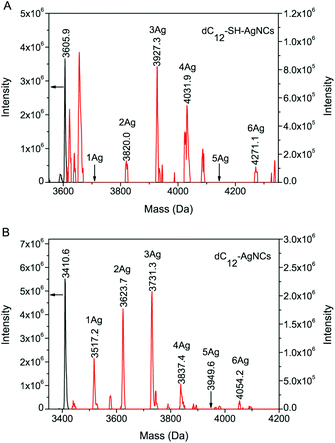
Electrospray ionization mass spectroscopy (ESI-MS) was employed to determine the size of the DNA-SH-AgNCs (Fig. 4A). In this experiment, AgNCs were synthesized in pure water to eliminate the interference of other ions in the buffer solution, and the reactant concentrations were increased by 1.5-fold to increase the ion abundance.31 We then compared the mass spectra of the dC12-SH-AgNCs (Fig. 4A) with those of dC12-AgNCs (Fig. 4B). Although the optimal stoichiometric ratio of the two kinds of AgNCs was three Ag atoms bound to one DNA strand, Ag2, Ag3, and Ag4 were the dominant clusters of the dC12-SH-AgNCs, whereas Ag1, Ag2, and Ag3 were the main distribution sizes of dC12-AgNCs. These results showed that the sulfhydryl groups in the DNA-SH could affect the number of Ag atoms bonded to the DNA strands and in turn influence the fluorescence emission and stability of the AgNCs.
The shelf-life of the DNA-SH-AgNCs was longer than that of the DNA-AgNCs. We speculated that the enhanced stability of the DNA-SH-AgNCs was related to resistance against spontaneous oxidation by O2/air. Therefore, we performed electrochemical studies through cyclic voltammetry (CV) (Fig. 5, Fig. S9 and S10†). For each different scanning speed, the cyclic voltammograms of dC12-AgNCs showed that a single anodic peak was obtained that corresponded to the irreversible metal-based oxidation of the nanoclusters (i.e., Agn/Agn+ + e−). The oxidation peak appeared in the forward scan of three cycles. The current peak decreased with increased cycle time as a likely result of adsorption effects. No reduction peak was detected in the backward scan, indicating that the reaction was a completely irreversible electrochemical process. Neither an oxidation peak nor reduction peak was observed in the cyclic voltammograms of the dC12-SH-AgNCs under the same conditions. Thus, the silver atoms in the dC12-SH-AgNCs can resist spontaneous oxidation.
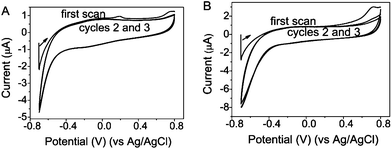 | ||
| Fig. 5 Cyclic voltammograms of the dC12-AgNCs (A) and dC12-SH-AgNCs (B) at the scan rate of 0.5 V s−1. | ||
In conclusion, we utilized DNA-SH as a template for the synthesis of AgNCs through direct preparation with a strong reductant. The QYs of DNA-SH-AgNCs were much higher than that of the matched DNA-AgNCs. Meanwhile, the DNA-SH-AgNCs were not susceptible to air/oxygen oxidation. The mercapto group and base in the DNA-SH strand bound with silver atoms and exerted a cooperatively protective effect on the AgNCs. Thus, the results of our study offer a new approach for the synthesis of AgNCs through the combination of different functional ligands.
Conflicts of interest
The authors declare no competing financial interest.Acknowledgements
This work was supported by the National Natural Science Foundation of China (21275097), the Fundamental Research Fund for the Central Universities (GK201602010) and the 111 Project (B14041).Notes and references
- R. Jin, Nanoscale, 2015, 7, 1549–1565 RSC.
- Y. Tao, M. Li, J. Ren and X. Qu, Chem. Soc. Rev., 2015, 44, 8636–8663 RSC.
- C. I. Richards, S. Choi, J. C. Hsiang, Y. Antoku, T. Vosch, A. Bongiorno, Y. L. Tzeng and R. M. Dickson, J. Am. Chem. Soc., 2008, 130, 5038–5039 CrossRef CAS PubMed.
- J. Zhu, L. Zhang, Y. Teng, B. Lou, X. Jia, X. Gu and E. Wang, Nanoscale, 2015, 7, 13224–13229 RSC.
- L. Chen, L. Sha, Y. Qiu, G. Wang, H. Jiang and X. Zhang, Nanoscale, 2015, 7, 3300–3308 RSC.
- Y. Zhang, Y. Cai, Z. Qi, L. Lu and Y. Qian, Anal. Chem., 2013, 85, 8455–8461 CrossRef CAS PubMed.
- J. Zheng and R. M. Dickson, J. Am. Chem. Soc., 2002, 124, 13982–13983 CrossRef CAS PubMed.
- C. Guo and J. Irudayaraj, Anal. Chem., 2011, 83, 2883–2889 CrossRef CAS PubMed.
- K. M. Harkness, Y. Tang, A. Dass, J. Pan, N. Kothalawala, V. J. Reddy, D. E. Cliffel, B. Demeler, F. Stellacci, O. M. Bakr and J. A. McLean, Nanoscale, 2012, 4, 4269–4274 RSC.
- K. H. Wang and C. W. Chang, Phys. Chem. Chem. Phys., 2015, 17, 23140–23146 RSC.
- S. Gregersen, T. Vosch and K. J. Jensen, Chem. – Eur. J., 2016, 22, 18492–18500 CrossRef CAS PubMed.
- R. R. Gao, T. M. Yao, X. Y. Lv, Y. Y. Zhu, Y. W. Zhang and S. Shi, Chem. Sci., 2017, 8, 4211–4222 RSC.
- S. M. Copp, D. E. Schultz, S. Swasey, A. Faris and E. G. Gwinn, Nano Lett., 2016, 16, 3594–3599 CrossRef CAS PubMed.
- R. Jin, C. Zeng, M. Zhou and Y. Chen, Chem. Rev., 2016, 116, 10346–10413 CrossRef CAS PubMed.
- S. Y. New, S. T. Lee and X. D. Su, Nanoscale, 2016, 8, 17729–17746 RSC.
- J. T. Petty, S. P. Story, S. Juarez, S. S. Votto, A. G. Herbst, N. N. Degtyareva and B. Sengupta, Anal. Chem., 2012, 84, 356–364 CrossRef CAS PubMed.
- T. Lee, J. Liu, N. P. Chen, R. P. Andres, D. B. Janes and R. Reifenberger, J. Nanopart. Res., 2000, 2, 345–362 CrossRef CAS.
- J. Yin, X. He, X. Jia, K. Wang and F. Xu, Analyst, 2013, 138, 2350–2356 RSC.
- J. Sharma, R. C. Rocha, M. L. Phipps, H. C. Yeh, K. A. Balatsky, D. M. Vu, A. P. Shreve, J. H. Werner and J. S. Martinez, Nanoscale, 2012, 4, 4107–4110 RSC.
- R. Jin, S. Zhao, Y. Xing and R. Jin, CrystEngComm, 2016, 18, 3996–4005 RSC.
- A. Desireddy, B. E. Conn, J. Guo, B. Yoon, R. N. Barnett, B. M. Monahan, K. Kirschbaum, W. P. Griffith, R. L. Whetten and U. Landman, Nature, 2013, 501, 399–402 CrossRef CAS PubMed.
- O. M. Bakr, V. Amendola, C. M. Aikens, W. Wenseleers, R. Li, N. L. Dal, G. C. Schatz and F. Stellacci, Angew. Chem., Int. Ed., 2009, 48, 5921–5926 CrossRef CAS PubMed.
- S. H. Yau, B. A. Ashenfelter, A. Desireddy, A. P. Ashwell, O. P. Varnavski, G. C. Schatz, T. P. Bigioni and T. Goodson, J. Phys. Chem. C, 2017, 121, 1349–1361 CAS.
- B. A. Ashenfelter, A. Desireddy, S. H. Yau, T. Goodson and T. P. Bigioni, J. Phys. Chem. C, 2015, 119, 20728–20734 CAS.
- Z. Wu and R. Jin, Nano Lett., 2010, 10, 2568–2573 CrossRef CAS PubMed.
- Y. Chen, C. Zeng, D. R. Kauffman and R. Jin, Nano Lett., 2015, 15, 3603–3609 CrossRef CAS PubMed.
- Y. Chen, C. Liu, Q. Tang, C. Zeng, T. Higaki, A. Das, D. E. Jiang, N. L. Rosi and R. Jin, J. Am. Chem. Soc., 2016, 138, 1482–1485 CrossRef CAS PubMed.
- D. Schultz and E. Gwinn, Chem. Commun., 2011, 47, 4715–4717 RSC.
- C. M. Ritchie, K. R. Johnsen, J. R. Kiser, Y. Antoku, R. M. Dickson and J. T. Petty, J. Phys. Chem. C, 2007, 111, 175–181 CAS.
- C. I. Richards, S. Choi, J. C. Hsiang, Y. Antoku, T. Vosch, A. Bongiorno, Y. L. Tzeng and R. M. Dickson, J. Am. Chem. Soc., 2008, 130, 5038–5039 CrossRef CAS PubMed.
- J. T. Petty, J. Zheng, N. V. Hud and R. M. Dickson, J. Am. Chem. Soc., 2004, 126, 5207–5212 CrossRef CAS PubMed.
- V. Bonačićkoutecký, J. Pittner, M. Boiron and P. Fantucci, J. Chem. Phys., 1999, 110, 3876–3886 CrossRef.
- W. Harbich, S. Fedrigo, F. Meyer, D. M. Lindsay, J. Lignieres, J. C. Rivoal and D. Kreisle, J. Chem. Phys., 1990, 93, 8535–8543 CrossRef CAS.
- C. P. Joshi, M. S. Bootharaju and O. M. Bakr, J. Phys. Chem. Lett., 2015, 6, 3023–3035 CrossRef CAS PubMed.
- O. Varnavski, R. G. Ispasoiu, L. Balogh, D. Tomalia and T. Goodson, J. Chem. Phys., 2001, 114, 1962–1965 CrossRef CAS.
- I. Rabin, W. Schulze and G. Ertl, J. Chem. Phys., 1998, 108, 5137–5142 CrossRef CAS.
- L. Shang, R. M. Dörlich, V. Trouillet, M. Bruns and G. U. Nienhaus, Nano Res., 2012, 5, 531–542 CrossRef CAS.
- J. Feng, C. Zhuo, X. Ma, S. Li and Y. Zhang, Analyst, 2016, 141, 4481–4487 RSC.
- S. Li, Y. Fu, X. Ma and Y. Zhang, Biosens. Bioelectron., 2017, 88, 210–216 CrossRef CAS PubMed.
- M. S. Bootharaju and T. Pradeep, Langmuir, 2013, 29, 8125–8132 CrossRef CAS PubMed.
Footnotes |
| † Electronic supplementary information (ESI) available: Experimental details and Fig. S1–S10. See DOI: 10.1039/c7nr06358j |
| ‡ These authors contributed equally. |
| This journal is © The Royal Society of Chemistry 2018 |

