Iron nanoparticles-based supramolecular hydrogels to originate anisotropic hybrid materials with enhanced mechanical strength†
Rafael
Contreras-Montoya
a,
Ana B.
Bonhome-Espinosa
b,
Angel
Orte
 c,
Delia
Miguel
 c,
Jose M.
Delgado-López‡
 d,
Juan D. G.
Duran
 b,
Juan M.
Cuerva
 a,
Modesto T.
Lopez-Lopez
 *b and
Luis
Álvarez de Cienfuegos
 *a
*a
aDpto de Química Orgánica, Facultad de Ciencias, Universidad de Granada (UGR), 18071-Granada, Spain. E-mail: lac@ugr.es
bDpto de Física Aplicada, Facultad de Ciencias, (UGR), 18071-Granada, Spain. E-mail: modesto@ugr.es
cDpto de FisicoQuímica, Facultad de Farmacia, (UGR), 18072-Granada, Spain
dLaboratorio de Estudios Cristalográficos, Instituto Andaluz de Ciencias de la Tierra (Consejo Superior de Investigaciones Científicas-Universidad de Granada), Avenida de las Palmeras 4, 18100 Armilla, Granada, Spain
First published on 26th January 2018
Abstract
Here, we report the synthesis and structural characterization of novel iron nanoparticles (FeNPs)-based short-peptide supramolecular hydrogels. These hybrid hydrogels composed of Fmoc-diphenylalanine (Fmoc-FF) peptide and FeNPs were prepared through the self-assembly of Fmoc-FF in a suspension containing FeNPs in the presence or absence of an external magnetic field. Optical images of these hydrogels revealed the formation of column-like aggregates of FeNPs when the gels were formed in the presence of a magnetic field. Moreover, the intricate structure derived from the interwoven nature of the fiber peptides with these FeNP column-like aggregates resulted in anisotropic materials, more rigid under shear forces applied perpendicularly to the direction of the aggregates, presenting under these conditions values of G′ (storage modulus) about 7 times those of the native hydrogel. To the best of our knowledge, this is the first example in which the mechanical properties of peptide hydrogels were strongly enhanced due to the presence of FeNPs. A theoretical model trying to explain this phenomenon is presented. Quite interesting CD, FTIR and synchrotron X-ray diffraction analyses indicated that the anti-parallel β-sheet arrangement of Fmoc-FF peptide was highly conserved in the hydrogels containing FeNPs. Moreover, FLCS measurements showed that the diffusion of a small solute through the hydrogel network was improved in hydrogels containing FeNPs, probably caused by the formation of preferential channels for diffusion. Taken together, our results provide a new method for the synthesis of novel hybrid Fmoc-FF–FeNPs anisotropic hydrogels with enhanced mechanical strength and water-like diffusion behavior, thus easing their application in drug delivery and tissue engineering.
Introduction
Hydrogels are an important class of materials that have found useful technological and biotechnological applications due to their high water content and diverse mechanical properties. Moreover, these types of materials can be chemically designed to respond to different external stimuli with the intention of provoking in the hydrogel a physical or chemical change (i.e., altering their mechanical properties or triggering the release of substances, etc.), making them what have been termed “smart materials”.1 An important category of these stimuli-sensitive hydrogels are magnetic hydrogels or ferrogels (i.e., the combination of hydrogels with micro- and/or nano-magnetic particles (MPs)) (e.g., γ-Fe2O3, Fe3O4, CoFe2O4) that are able to respond to an external magnetic field, modifying their properties (from the microstructure shape and size to the mechanical behavior).2 The possibility of altering their properties remotely makes them very appealing for multiple applications, such as pulsatile delivery vehicles, magnetic resonance imaging contrast agents, hyperthermal therapy agents, etc. The properties of these composite materials rely on several factors, such as the nature of the hydrogel, the type of interaction (physical or chemical) between the fibers and MPs, and the concentration, size and distribution of the MPs within the hydrogels. Additionally, the method of preparation can also have an influence on the final properties of the ferrogel.3 Nevertheless, the interesting properties of these materials have been mainly restricted to polymers due to their great versatility and capacity to modify their structure.Recently, supramolecular hydrogels composed of small molecules (low molecular weight gelators, LMWG) able to self-assemble by an external stimulus have turned into excellent candidates for the construction of smart and functional materials.4 The dynamic nature of the non-covalent self-association makes them more prone to be modified by external stimuli, which in most cases promote a change in the macroscopic properties of these materials causing them to evolve into systems that are adaptive to the environment.5 Short-peptide supramolecular hydrogels are an example of this kind of materials.6 These peptides have a strong tendency to self-associate requiring in most of the cases less than 1 wt% to immobilize the aqueous medium. Due to their chemical structure, these compounds are able to form gels by different stimuli or conditions, mainly solvent, pH and/or temperature changes or enzymatic reaction.6a,7 The stimulus triggers the self-association process and, as a consequence, different stimuli can differently affect the structural and mechanical properties of the resulting gel. In this sense, much effort has been focused on modifying the mechanical properties of these hydrogels since many useful applications depend on the rheological performance of these materials.8 For example, it is known that dipeptide LMWG derivative gels can be formed by pH and solvent switch and using one or the other stimulus has an effect on the mechanical properties of the gels, even the homogenization techniques and the final solvent content also have an impact.9 Alternatively, one strategy to modulate the mechanical properties of these hydrogels has been the development of composite materials by the combination of these peptides with others or with different additives. In this sense, the mechanical properties of hybrid hydrogels composed of Fmoc-FF and Fmoc-K, Fmoc-D or Fmoc-S have shown lower elastic moduli10a or higher mechanical strength (Fmoc-RGD)10b compared to Fmoc-FF alone. The presence of polymers such as dextrans,11 agarose,12 and konjac glucomannan13 has shown mixed results, causing, in some cases, a decrease in the mechanical properties of the gel (dextrans); an increase in the fracture stress (agarose); and an increase in the stability and mechanical strength (konjac glucomannan). Furthermore, the incorporation of solid nanoparticles, such as AgNPs,14 carbon nanotubes (CNTs),15 and graphene,16 has also decreased (AgNPs) or increased (CNTs and graphene) the mechanical strength of the hydrogels. Interestingly, the incorporation of solid nanoparticles in the gel matrix can also provide new properties to these materials, such as antibacterial and/or fluorescence properties (AgNPs), and electrical conductivity (CNTs). Additionally, certain nanoparticles are able to exert a structural control over the distribution of the supramolecular nanofibers.17
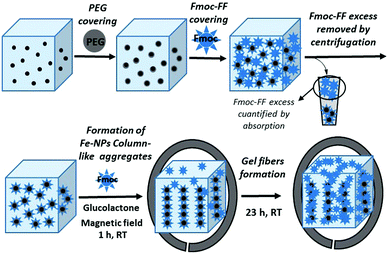
Based on these precedents, herein, we report the synthesis and characterization of novel magnetic supramolecular hydrogels composed by the self-association of Fmoc-FF in the presence of different ratios of core–shell Fe nanoparticles with a polyethylene glycol covering (Fe nanoparticles@PEG) under the influence or absence of an external magnetic field. Our results indicate that when they were prepared under an applied magnetic field, the mechanical properties (measured under shear applied perpendicular to the field direction) of these magnetic hydrogels improve dramatically, up to 7 times, with respect to the nonmagnetic or randomly oriented magnetic nanoparticles hydrogels, whilst, at the same time, the diffusion of a solute through the structure is improved. This improvement in their mechanical properties occurs only when the gel is formed in the presence of an applied magnetic field and is the consequence of a particular combination of structural characteristics in the hydrogel. These structural characteristics imply the engulfment of magnetically oriented FeNP column-like structures by the peptide fibers that have been formed in the presence of them (see Fig. 1). We have checked that this anisotropy at the microscopic level is also reflected in the macroscopic mechanical properties of the magnetic hydrogels, which present weaker rheological moduli when the applied shear is within the same plane of the FeNP column-like structures.
Quite interestingly, the non-covalent nature of this self-association allows the inclusion of these FeNP column-like structures within the peptide network to give a homogeneous hybrid material without practically modifying the secondary structure of the peptide. Surprisingly, this 700% improvement of the mechanical properties of the magnetic hydrogels takes place with a tiny (0.6 vol%) amount of FeNPs. The simple embedment of the FeNPs within the matrix of the hydrogel cannot justify such a large enhancement; in fact, the classical theory of mechanics of composite materials18 only predicts an enhancement of the mechanical properties of the order of 1% when such an amount of spherical particles is embedded within a continuous matrix. We demonstrate in our work that the application of a magnetic field to the pre-gel mixture induces the aggregation of FeNPs into column-like structures. The particles within the structures are subsequently engulfed by the gel-forming peptides, in such a way that these structures are maintained even after magnetic field removal, serving as scaffolding for the support and mechanical enhancement of the resulting hydrogels, something that to the best of our knowledge has not been previously reported for biological gels. Moreover, these magnetic hydrogels, similar to the Fmoc-FF hydrogel, can be extruded through a syringe keeping their gel state.19 All of these new properties, together with the known biocompatibility and biodegradability of these hydrogels, provide these materials with useful potential applications in several biomedical fields, such as drug delivery agents and tissue engineering. To gain in-depth insights into the morphological and structural properties of these materials, these hydrogels have been studied by magnetization, optical microscopy, environmental scanning electron microscopy, infrared spectroscopy, circular dichroism, X-ray diffraction and synchrotron X-ray total scattering, fluorescence lifetime correlation spectroscopy and rheology. It is worth noting that a magnetic supramolecular hydrogel in which the gel to sol transition is triggered by an external magnetic field has been successfully prepared although a study of its mechanical properties has not been reported.20
Experimental
Reagents and materials
N-Fluorenylmethoxycarbonyl diphenylalanine (Fmoc-FF) was purchased from Bachem Co., Switzerland and was used without further purification. Fe nanopowders/nanoparticles, 99.7+%, 60–80 nm, were purchased from SkySpring Nanomaterials, Inc., Houston, USA. PEG-400 (polyethylene glycol, 400 g mol−1), glutaraldehyde (25% solution in water), mineral oil and sorbitan sesquioleate were provided by Sigma-Aldrich, USA. n-Hexane, min 99%, was purchased from Scharlab S.L., Spain. D(+)-Glucono-1,5-lactone 99% was purchased from Alfa Aesar, Germany. Sodium nitrate (for analysis) was purchased from Merck, Germany.Preparation of magnetic nanoparticles with PEG coating
As the magnetic phase, we used iron nanopowders consisting of iron nanoparticles (FeNPs) of diameter in the range 60–80 nm. In order to avoid corrosion, the manufacturer provides the particles in vacuum bags, which we opened under an argon atmosphere to reduce contact with oxygen. Immediately afterwards, the nanoparticles were coated with a layer of polyethylene glycol (PEG), which protects from corrosion, as we proved in a previous work.21 Furthermore, the PEG coating also imparts to the particles the biocompatibility required for biomedical applications. Indeed, coating nanoparticles with a PEG layer reduces the attack by macrophages, as has been shown.22 For the PEG coating, we adapted the water-in-oil emulsion method described by Chatterjee et al.23 Briefly, we prepared a water phase that consisted of a mixture of 200 mg of FeNPs and 1 g of PEG-400 in purified water (Milli-Q quality, Millipore Corporation), previously purged with argon in order to remove oxygen and prevent the iron NPs from corrosion. This mixture was homogenized by an ultrasonic bath for 7 minutes. Separately, we prepared the oil phase consisting of 450 mL of hexane, 150 mL of mineral oil and 0.75 mL of sorbitan sesquioleate. Afterwards, we mixed both (water and oil) phases and sonicated them for 5 minutes in order to obtain a water-in-oil microemulsion. Subsequently, we added 150 mL of glutaraldehyde under mechanical stirring – note that glutaraldehyde is responsible for the initiation of the polymerization of PEG. The reaction was maintained for 2 hours under mechanical stirring. Finally, the magnetic product was separated by magnetic decantation and repeatedly washed with ethanol and purified water (Milli-Q quality). Pristine iron nanoparticles will be referred to as PMNP (Pristine Magnetic NanoParticles), while PEG-coated iron nanoparticles are called MNP@PEG.Characterization of the nanoparticles
The size and shape of PMNP and MNP@PEG were characterized by transmission electron microscopy (TEM). The effectiveness of the PEG coating was confirmed by measuring the electrophoretic mobility at different pH values using a Nano Zs, Zetasizer Instrument (Malvern). For this method, both PMNP and MNP@PEG were suspended in 1 mM solutions of NaNO3. Then, for each of the powders (pristine and coated), in order to determine their isoelectric point, we adjusted the pH of the suspensions of iron nanoparticles in NaNO3 within precise values within the range 4–11, using 0.1 M solutions of NaOH or HNO3. Measurements, in triplicate for each sample, were carried out at 25 °C using disposable plastic cuvettes.Finally, we characterized the magnetic properties of the dry nanopowders by using a Quamtum Design NPMS X magnetometer.
Nonmagnetic hydrogel (NMHG) preparation
The NMHG gelification was performed following a previously reported described protocol.24 Very briefly, Fmoc-FF peptide was weighed into a sample tube and deionised water was added to obtain a final concentration of 0.5% (w/v). This suspension was then sonicated (in a HSt Powersonic 603-ultrasonic bath) for 10 minutes. Little portions of 0.5 M NaOH solution, were then added by pipette. The solution was vortexed (using an LBX V05 series vortex stirrer) and sonicated after each addition to aid mixing, until a clear solution was obtained at a pH of approximately 10.35. (The pH was measured using a HACH sension™ PH 3 pH meter. The pH meter was calibrated using pH 4, pH 7 and pH 10 buffer solutions.) This solution was diluted with deionised water (or 2.5 nM fluorescence dye solution for FLCS studies) to obtain a final Fmoc-FF concentration of 0.3% (w/v). Gelation was then carried out by addition of 2 molar equivalents of glucono-δ-lactone (GdL) to the basic peptide solution and mixing was achieved by vortexing for 5 seconds. According to rheological measurements, full gelification at room temperature was achieved after 12 h.MNP@PEG@Fmoc-FF nanoparticles preparation
100 mg of MNP@PEG was suspended in 1.5 mL of an aqueous basic solution of Fmoc-FF 0.5% (w/v). The resulting suspension was sonicated for 10 min and then centrifuged for 5 min at 10![[thin space (1/6-em)]](https://www.rsc.org/images/entities/char_2009.gif) 000 rpm (Sigma 1-14 centrifuge); afterwards, the supernatant was removed (see sketch in Fig. 1). The quantification of the amount of Fmoc-FF adsorbed on MNP@PEG was calculated by absorption measurements. For this purpose, the absorbance of Fmoc-FF solutions of different concentrations was measured at the maximum of absorption (266 nm), obtaining a good linear relationship between absorbance and concentration. Then, the remaining amount of Fmoc-FF in the supernatant was measured spectrophotometrically using an Analytik Jena SPECORD® 200 Plus and thus concentration was obtained from the interpolation in the previous fitting (see Fig. S1 of the ESI†). From the average of three measurements, it was found that the adsorption of Fmoc-FF on MNP@PEG was 4.7775 × 10⁻² g Fmoc-FF per gram of MNP@PEG. To further confirm the Fmoc-FF adsorption on MNP@PEG, we performed measurements of the electrophoretic mobility of the new MNP@PEG@Fmoc-FF particles following a similar protocol to the described for the PEG-coated MNP.
000 rpm (Sigma 1-14 centrifuge); afterwards, the supernatant was removed (see sketch in Fig. 1). The quantification of the amount of Fmoc-FF adsorbed on MNP@PEG was calculated by absorption measurements. For this purpose, the absorbance of Fmoc-FF solutions of different concentrations was measured at the maximum of absorption (266 nm), obtaining a good linear relationship between absorbance and concentration. Then, the remaining amount of Fmoc-FF in the supernatant was measured spectrophotometrically using an Analytik Jena SPECORD® 200 Plus and thus concentration was obtained from the interpolation in the previous fitting (see Fig. S1 of the ESI†). From the average of three measurements, it was found that the adsorption of Fmoc-FF on MNP@PEG was 4.7775 × 10⁻² g Fmoc-FF per gram of MNP@PEG. To further confirm the Fmoc-FF adsorption on MNP@PEG, we performed measurements of the electrophoretic mobility of the new MNP@PEG@Fmoc-FF particles following a similar protocol to the described for the PEG-coated MNP.
MNP@PEG@Fmoc-FF composite hydrogel preparation
To an aqueous basic solution of Fmoc-FF 0.5% (w/v), the suitable weighted amount of MNP@PEG@Fmoc-FF particles to obtain the different final concentrations of 0.05 vol%, 0.1 vol%, 0.3 vol%, 0.6 vol%, and 0.9 vol%, corresponding to hydrogels MHG-0.05, MHG-0.1, MHG-0.3, MHG-0.6 and MHG-0.9, was added and diluted to a final Fmoc-FF concentration of 0.3% (w/v). This suspension was sonicated for 5 min to give a homogeneous suspension. This suspension was gelified by the addition of GdL, keeping it at room temperature for 24 h. To obtain the hydrogels with FeNPs aligned into column-like structures, after the addition of GdL and for 1 hour, the hydrogel was kept under the influence of a vertically applied magnetic field of 15 kA m−1 strength (we used a solenoid connected to a DC power supply for this purpose), followed by 23 h without the stimulus of the magnetic field at room temperature (Fig. 1).Characterization of the magnetic properties of the hydrogels
We obtained the magnetization curve of the magnetic hydrogels by means of a Quamtum Design NPMS X magnetometer. For this method, we applied different values of the magnetic field and measured the resulting magnetization of the samples.Optical microscopy
We analyzed the mesoscopic structure of the hydrogels by direct observation with an optical microscope (Nikon, SMZ800) at 5× magnification. We took photos of hydrogels prepared by different experimental protocols using a CCD camera (Pixelink, Canada) connected to the microscope.Electron microscopy
Circular dichroism (CD)
The CD spectra were recorded using an Olis DSM172 spectrofotometer with a xenon lamp of 150 W. The hydrogels were gelified into a 0.1 mm quartz cell (Hellma 0.1 mm quartz Suprasil®) using the protocol described above. Spectra were obtained from 200 to 320 nm with a 1 nm step and 0.1 s integration time per step at 25 °C. The data shown correspond to the average of 20 measurements.Fourier transform infra-red (FTIR) spectroscopy
Spectra were recorded using a Perkin-Elmer Two FTIR ATR spectrometer. The hydrogels and the xerogel were compressed onto the diamond crystal. All spectra were scanned over the range between 4000 and 450 cm−1.X-ray diffraction (XRD)
X-ray diffraction patterns were obtained with Cu Kα radiation (λ = 1.5418 Å) on a PANalytical X’Pert PRO diffractometer equipped with a PIXcel detector operating at 45 kV and 40 mA. The 2θ range was from 5° to 80° with a step size of (2θ) 0.039°. By varying the scattering angle, the explored momentum transfer vector (q) was in the range of 1 < q (nm−1) < 28.0, with q = (4p/k)sin![[thin space (1/6-em)]](https://www.rsc.org/images/entities/char_2009.gif) h, where h is the scattering angle. A freshly prepared gel was deposited on a silicon holder and dried overnight prior to data collection.
h, where h is the scattering angle. A freshly prepared gel was deposited on a silicon holder and dried overnight prior to data collection.
Synchrotron X-ray total scattering
Dried gels were loaded in glass capillaries of 0.8 mm diameter and measured at the X04SA-MS Beamline of the Swiss Light Source (SLS) of the Paul Scherrer Institut (PSI, Villigen, CH). The beam energy was set at 16 keV and the operational wavelength (λ = 0.77627 Å) precisely determined by collecting, under the same experimental conditions, a silicon powder standard [NIST 640c, a0 = 0.54311946(92) nm at 22.5 °C]. A position sensitive single-photon counting MYTHEN II was used as a detector. Independent He/air and capillary scattering curves, as well as empty and sample-loaded capillary transmission coefficients, were also measured and used for data subtraction of all extra-sample scattering effects and absorption correction.Fluorescence lifetime correlation spectroscopy
Fluorescence fluctuation traces of a xanthene derivative dye, 4-methoxy-Pennsylvania Green (4-OMe-PG),25 dissolved at 1 nM concentration in the different hydrogels were collected on a MicroTime 200 instrument (PicoQuant, GmbH), based on an Olympus IX-71 inverted confocal microscope. A 470 nm pulsed laser (PicoQuant LDH-P-C-470), controlled by a “Sepia II” driver, was used as the excitation source, working at a repetition rate of 20 MHz. The emitted fluorescence was collected through the 1.4 NA, 100× oil immersion objective and focused onto a 75 μm pinhole, after passing through a 510dcxr dichroic mirror and a HP500LP cut-off filter (AHF/Chroma). After the pinhole, the fluorescence light was split into two channels by a 50/50 beam splitter, spectrally filtered by a 520/35 bandpass filter (Semrock) for channel 1 or a 550/40 bandpass filter (Thorlabs) for channel 2, and detected in two avalanche photodiode detectors (SPCM-AQR SPAD, Perkin-Elmer). The data acquisition was performed with a TimeHarp 200 time-correlated single photon counting (TCSPC) module, working in time-tagged time-resolved (TTTR) mode.26 The incorporation of time-resolved fluorescence information within fluorescence correlation spectroscopy measurements has resulted in the so-called fluorescence lifetime correlation spectroscopy (FLCS), in which time-weighted filters are applied during the correlation to discriminate actual fluorescence photons from background noise or scattered light.27 We performed FLCS cross-correlation (CC) between the two detection channels, as well as FLCS autocorrelation (AC) of the signal on the individual channels. The CC and ACF curves, g(t), were fitted to the anomalous diffusion equation: | (1) |
The fluorescence fluctuation traces of the dissolved dye were collected by focusing 10 μm inside the hydrogel. At least 15 traces of 150 seconds were obtained in different points of each hydrogel, containing different mass weights of FeNPs, with the gelification performed in the presence of a magnetic field as described above. Appropriate controls of the dye dissolved in the NMHG, and in MHG-0.1 and MHG-0.3 but gelified in the absence of the external magnetic field were also obtained.
Rheological characterization
We characterized the rheological properties of the NMHG and MHGs by using a Haake MARS III controlled-stress rheometer (Thermo Fisher Scientific, Waltham, MA, USA). The experimental characterization of the rheological properties of hydrogels presents special challenges due to some phenomena that are difficult to control, such as solvent loss,30 changes in the microstructure caused by manipulation,31 and even wall slip effects.30,32 In order to avoid a wrong estimation of the rheological properties of our hydrogels due to the effect of these undesired phenomena, we used a double cone-plate geometry (60 mm in diameter and angle of 2°; sensor DC60/2° Ti L, Thermo Fisher Scientific, Waltham, MA, USA) for the characterization of the rheological properties, and we generated each of the hydrogels directly inside this geometry prior to measurement. For this method, we prepared the hydrogel-precursor mixture and immediately afterwards, we poured it in the cup of the measuring geometry, lowered down the double cone and covered with the upper plate. To avoid water evaporation, we created a supersaturated water atmosphere around the measuring geometry. Then, the mixture was left for gelation for 24 hours at 25 °C. For the application of a magnetic field during the initial steps of gelation, we used a coil placed coaxially with the axis of the double cone. After the 24 h period, we carried out the rheological characterization at 25 °C, without any prior preshear or manipulation, thus ensuring the unspoiled microstructure of the hydrogel. For each formulation we measured at least 3 different samples to ensure statistical significance of our results. We provide in this work the mean values and standard deviations of each magnitude. For a complete rheological characterization, we carried out different rheological tests, described in the following paragraphs.Results and discussion
Characterization of the magnetic particles
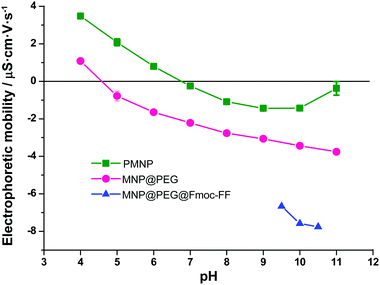
TEM micrographs revealed that FeNP powders were composed of spherical particles with a broad distribution in size (see Fig. S2 of the ESI†). Indeed, the particle size distribution of MNP fitted well to a Gaussian distribution (Fig. S3 of the ESI†), typical of particles resulting from growth starting from nuclei with negligible agglomeration.36 The best fit to a Gaussian distribution function provided a mean diameter ± standard deviation of 73 ± 20 nm. TEM pictures also demonstrate the successful coating of MNP@PEG by a thin layer of PEG (Fig. S2 of the ESI†). Furthermore, the existence of a PEG layer around the particles was corroborated by measurements of the electrophoretic mobility of the nanoparticles (Fig. 2). As observed, the electrophoretic mobility significantly decreased for MNP@PEG with respect to PMNP for the whole range of pH values under study (from pH 4 to pH 11). Furthermore, the isoelectric point (zero mobility) for PMNP is close to the characteristic value of hematite (pH 7),37 which is the iron oxide expected at the surface of iron. On the other hand, the isoelectric point of MNP@PEG is close to pH 4, considerably lower than that of PMNP. This is coherent with a PEG coating, since in this case, the surface of the nanoparticles is functionalized by hydroxyl groups and, thus, a trend to negative mobility is expected, as observed. Consequently, we can conclude that the particles were successfully coated by a PEG layer after treatment. In addition, the mobility was decreased even further after treatment with Fmoc-FF, which corroborates the adsorption of these molecules on MNP@PEG, also inferred from spectrophotometric measurements, as mentioned above. Note that for MNP@PEG@Fmoc-FF, measurements at pH 9 or smaller were impossible due to the formation of a gel. The treatment of MNP@PEG with Fmoc-FF peptide was carried out to improve the dispersion of the particles in the solution to originate homogeneous gels. In fact, when MNP@PEG particles were not pre-treated with Fmoc-FF, an inhomogeneous gel was obtained (data not shown). In this sense, all the experiments conducted in the hydrogels and discussed in the following subsections have been performed with these MNP@PEG@Fmoc-FF particles, for simplicity, sometimes mentioned as FeNPs.Magnetization studies
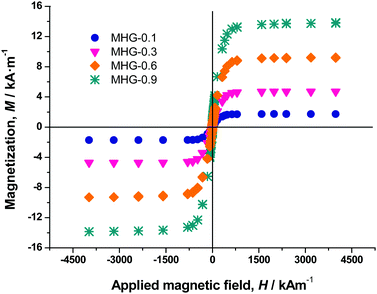
The magnetization curve of the iron powders demonstrated a typical ferromagnetic behavior for both PMNP and MNP@PEG (Fig. S4 of the ESI†). From these curves, we obtained the values of the saturation magnetization (1521 ± 15 kA m−1 for PMNP and 1530 ± 12 kA m−1 for MNP@PEG) and the values of the remnant magnetization (62.3 ± 2.4 kA m−1 for PMNP and 75 ± 3 kA m−1 for MNP@PEG). From these data, as well as for the general shape of the magnetization curves (Fig. S4 of the ESI†), we may conclude that the coating by PEG has an almost negligible effect on the magnetic properties of the iron powder. Furthermore, in both cases, a rather soft ferromagnetic behavior is evidenced. The slightly higher values of saturation magnetization and remnant magnetization in the case of MNP@PEG with respect to PMNP can be attributed to protection against oxidation due to the coating with PEG – in the case of PMNP, a thicker layer of nonmagnetic oxide is expected at the surface.Magnetization curves of magnetic hydrogels presented a similar shape to those of MNP@PEG, although with a much smaller saturation magnetization (Fig. 3). From these curves, we obtained the volume concentration of magnetic particles (ϕ) within the hydrogels using the mixing law of magnetism:38Msh = ϕ·Ms, with Msh and Ms being the saturation magnetizations of the hydrogels and MNP@PEG, respectively.
As observed, there is a good correspondence between concentrations according to preparation protocol and those obtained from magnetization measurements (Table S1 of the ESI†).
Morphology characterization
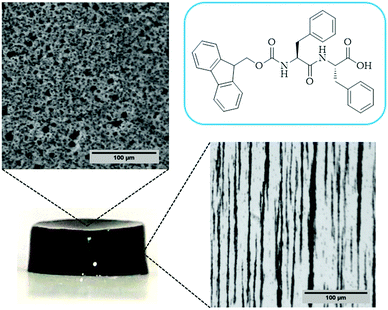
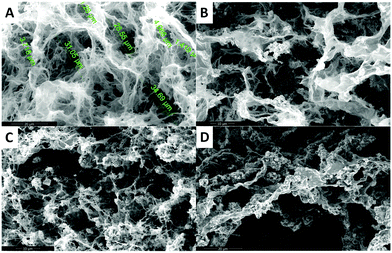
In the case of the MHGs, we were interested to see whether the Fmoc-dipeptide would be able to maintain the same microstructural order or would be significantly challenged by the presence of the FeNPs considering that the gel is formed in the presence of them. Furthermore, we looked for some clue for the reason of the maintenance of the particle column-like structures (aggregates) after the field removal. As we can see in Fig. 5B–D, the supramolecular structure of the peptide is maintained in all samples to originate a macroporous web now decorated all over with FeNPs. A possible explanation may be that the FeNP aggregates are included in the structure simultaneously during fiber and sheet formation. Quite interestingly, the peptide supramolecular arrangement is able to withstand up to 0.6 vol% FeNP loadings without significantly altering its structure, which is quite impressive considering the small amount of the peptide involved in this process. At the same time, the different particles that constitute each of the column-like aggregates observed by optical microscopy seem to be fixed together by the peptide structure, which would justify the maintenance of the percolating particle aggregates after the magnetic field is switched off. Interestingly, this particular distribution of FeNP column-like structures within the peptide network drastically reinforces the gel matrix without practically altering the pore size, whilst, at the same time, it improves the diffusion of a solute through it, as will be seen below.
Secondary structure
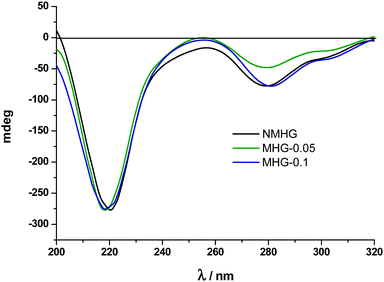
Circular dichroism (CD) and Fourier transform infrared spectra (FTIR) were used to analyse and compare the secondary structure of NMHG and MHG to address the degree of degradability of the supramolecular arrangement of Fmoc-FF dipeptide. For this purpose, we carried out both studies in the gel phase. Although CD analysis of these hydrogels could be prone to artifacts and is very sensitive to gel concentration,40a we were mainly interested in the comparison between gels. It is also known that the spectra of the hydrogel are also very sensitive to experimental conditions used to prepare it.41 In this sense, in our experimental conditions (pH switch using GdL), the CD spectrum of NMHG showed a maximum at 221 nm, which results from n–π transitions and at 279 nm, which corresponds to π–π transitions in the fluorenyl groups (Fig. 6).Ulijn and coworkers have suggested that Fmoc-FF may be assembled in a β-sheet structure in the hydrogel prepared by pH switch using HCl.40a In our case, the n–π transition is slightly shifted to lower wavelength (from 218 nm to 222 nm). This can be due to the different concentrations used for both experiments (Ulijn et al.: 1.07 wt%) and this work (0.3 wt%). This phenomenon has already been described and can only mean that a higher peptide concentration indicates the presence of more β-sheet conformation.42 Quite interestingly, the CD spectra of MHG-0.05 and MHG-0.1 showed a similar shape with the same two peaks at equal wavelengths (Fig. 6). These results indicate that the secondary structure derived from the self-assembly of the peptide practically remains unaltered in the presence of the FeNPs at these concentrations. Unfortunately, the CD spectra at higher FeNP concentrations could not be performed due to the light scattering caused by the sample.
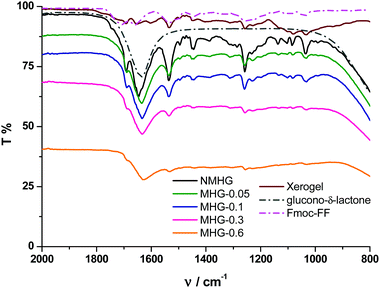
To further corroborate these results, we performed FTIR spectroscopy on all hydrogels. The FTIR spectrum of the NMHG xerogel (Fig. 7, dark red line) showed two main peaks at 1651 and 1534 cm−1. These bands can be assigned as the C![[double bond, length as m-dash]](https://www.rsc.org/images/entities/char_e001.gif) O stretching (amide I) and N–H bending (amide II) band, respectively.42 With respect to the corresponding xerogel, the C
O stretching (amide I) and N–H bending (amide II) band, respectively.42 With respect to the corresponding xerogel, the C![[double bond, length as m-dash]](https://www.rsc.org/images/entities/char_e001.gif) O stretching band (amide I) in the hydrogel NMHG (black line) is slightly red shifted (1645 cm−1) and the band of the N–H bending (amide II) is slightly blue shifted (1536 cm−1) indicating the formation of H-bonds.42,43 Similar to previous reports,40a,42 the presence of two amide bands at 1645 and 1536 cm−1 indicates a preference for a β-sheet conformation. Additionally, the presence of the band at 1692 cm−1 suggests an antiparallel β-sheet arrangement for the self-association of the Fmoc peptide.42 As we can observe from Fig. 7, the FTIR spectra of all MHGs have the same two amide bands at similar wavelengths to NMHG, which is in agreement with a β-sheet conformation and in line with the results observed in the CD. In this case, the amide I band in all the MHGs is red shifted to 1634 cm−1. This shift may be due to an increase in the H-bond formation between the peptide and the PEG shell of the FeNPs. These results evidence that the dispersion and distribution of FeNP column-like structures within the gel matrix did not significantly alter the secondary structure of the peptide. This phenomenon may be due to the smaller sizes of the metallic nanoparticles and their columnar aggregates with respect to the higher aspect ratio of the peptide supramolecular network. Also, the rigid FeNP column-like aggregates located at fixed positions under the influence of an external magnetic field could also minimize the disruption of the peptide self-assembly and secondary structure.
O stretching band (amide I) in the hydrogel NMHG (black line) is slightly red shifted (1645 cm−1) and the band of the N–H bending (amide II) is slightly blue shifted (1536 cm−1) indicating the formation of H-bonds.42,43 Similar to previous reports,40a,42 the presence of two amide bands at 1645 and 1536 cm−1 indicates a preference for a β-sheet conformation. Additionally, the presence of the band at 1692 cm−1 suggests an antiparallel β-sheet arrangement for the self-association of the Fmoc peptide.42 As we can observe from Fig. 7, the FTIR spectra of all MHGs have the same two amide bands at similar wavelengths to NMHG, which is in agreement with a β-sheet conformation and in line with the results observed in the CD. In this case, the amide I band in all the MHGs is red shifted to 1634 cm−1. This shift may be due to an increase in the H-bond formation between the peptide and the PEG shell of the FeNPs. These results evidence that the dispersion and distribution of FeNP column-like structures within the gel matrix did not significantly alter the secondary structure of the peptide. This phenomenon may be due to the smaller sizes of the metallic nanoparticles and their columnar aggregates with respect to the higher aspect ratio of the peptide supramolecular network. Also, the rigid FeNP column-like aggregates located at fixed positions under the influence of an external magnetic field could also minimize the disruption of the peptide self-assembly and secondary structure.
The XRD pattern of NMHG (curve a (blue) of Fig. S5 of the ESI†) is in good agreement with that previously reported for Fmoc-FF gels.40a,44 It shows a series of diffraction peaks appearing at d-spacing values equal to d/n (where 2 < n < 6). These periodic reflections are consistent with the presence of flat ribbons formed by the parallel stacking along their long axis of single fibrils.40a Plotting the n-order against the peak position (as scattering vector, q = (2π/λ)sin![[thin space (1/6-em)]](https://www.rsc.org/images/entities/char_2009.gif) θ), one can obtain the width of the single fibrils from the slope (inset in Fig. S5 of the ESI†). From the best linear fitting, we obtained a width of 26.1 Å for a single fibril, which is in perfect agreement with the values reported for similar gels.40a The spacing between peptides within the β-sheet structures, which typically ranges between 4 and 5 Å depending on the peptide sequence,40a appears at a d-spacing of 4.8 Å.
θ), one can obtain the width of the single fibrils from the slope (inset in Fig. S5 of the ESI†). From the best linear fitting, we obtained a width of 26.1 Å for a single fibril, which is in perfect agreement with the values reported for similar gels.40a The spacing between peptides within the β-sheet structures, which typically ranges between 4 and 5 Å depending on the peptide sequence,40a appears at a d-spacing of 4.8 Å.
Unfortunately, the corresponding signals of the supramolecular structure in MHG-0.3 (curve b (green line) of Fig. S5 of the ESI†) are masked by the high scattering signal of the nanoparticles at such small angles (curve b of Fig. S5 of the ESI†). To solve this problem, we collected the synchrotron X-ray total scattering patterns of the naked and the particle-bearing gels at the X04SA materials science beam-line of the SLS-PSI (Fig. 8). The periodic reflections (1 < n < 6) were visible in the pattern of the NMHG (Fig. 8 – curve a, blue line), confirming the formation of ribbons of stacked 26 Å-width single fibrils. The spacing between peptides within the β-sheets also appeared at a d-spacing of 4.85 Å. All these features, although poorly defined due to the scattering of the nanoparticles in this angular region, were distinguishable in the patterns of MHG-0.3 prepared in the absence (Fig. 8 – curve b, green line) and presence (Fig. 8 – curve c, orange line) of a magnetic field. Hence, these results indicate that the supramolecular arrangement of the hydrogels is maintained even when they are prepared in the presence of an external magnetic field, in accordance with the CD and FTIR results.
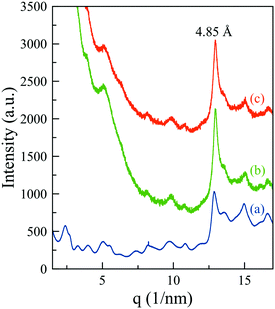 | ||
| Fig. 8 Synchrotron X-ray total scattering patterns of NMHG (a) and MHG-0.3 in the absence (b) and presence (c) of magnetic fields. | ||
FLCS studies
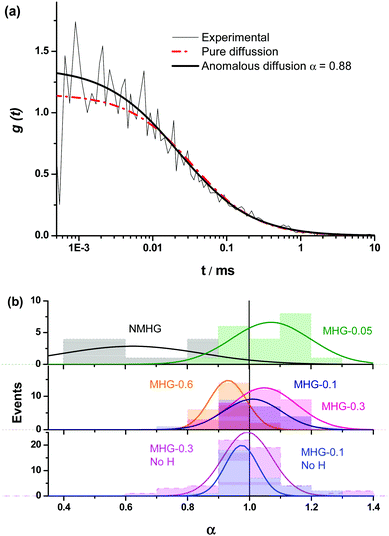
We were interested in knowing if the pore size distribution of the hydrogel network, and hence the diffusion of solutes through it, was significantly modified by the incorporation of the FeNPs. This is a fundamental question since traditional strategies that try to increase the mechanical properties of hydrogels imply a higher cross-linking, with the subsequent reduction in the pore size of the network hampering the diffusion of solutes through it. Alternative strategies, such as those described in the introduction do not guarantee an increase in the mechanical properties of the hydrogel or the maintenance of unaltered pore size or diffusion. This can be a serious drawback in certain biotechnological applications such as in vivo drug delivery and in tissue engineering where cells need adequate diffusion through the gel matrix for the interchange of nutrients and waste substances.In this sense, the diffusion pattern of a small dye, 4-OMe-PG, dissolved in the hydrogels was studied using FLCS. We chose this dye because of the low variation of the fluorescence features of fluorinated xanthenes at near-neutral pH.31,45 The AC and CC correlation curves of the dye in the MHGs showed a diffusional behavior very close to pure diffusion (Fig. 9a). Indeed, the α values ranged from 0.8 to 1.2 in the different measurements. Fig. 9b shows the α value distributions for the dye in gels carrying different loads of FeNPs. These distributions were fitted to a Gaussian function, in order to obtain the average value and the associated error (as the half-width of the function). The average α values were 1.07 ± 0.13, 1.01 ± 0.09, 1.05 ± 0.10, and 0.93 ± 0.06 for MHG-0.05, MHG-0.1, MHG-0.3 and MHG-0.6, respectively. A statistical comparison with α = 1 showed that the samples with 0.05 vol%, 0.1 vol%, and 0.3 vol% of FeNPs were statistically not different from pure diffusional behavior (p value >0.03). This implies that the 4-OMe-PG dye diffuses similarly in the hydrogel to in bulk solvent. Furthermore, the obtained apparent diffusion coefficients were 380 ± 130, 450 ± 170, and 400 ± 110 μm2 s−1, for the dye in MHG-0.05, MHG-0.1 and MHG-0.3, respectively. These values are in perfect agreement with the diffusion coefficient obtained for the free 4-OMe-PG dye in an aqueous solution of 410 ± 70 μm2 s−1, after fitting the FLCS-CC and AC functions to a pure diffusional model (with α = 1). Therefore, these values are in line with the diffusion coefficient of a small dye in aqueous solution, confirming the quasi-aqueous environment of the dye in the hydrogels. However, the population of samples in MHG-0.6 was statistically different from a pure diffusional behavior with a significance of 99% (p value = 3 × 10⁻⁶). This means that the 4-OMe-PG dye dissolved in the hydrogel with high loads of FeNPs presents a distinguishable subdiffusion behavior, although not very prominent. The average apparent diffusion coefficient for the dye in this gel was 540 ± 100 μm2 s−1. The apparent increase in the diffusion coefficient, compared to the other measurements, may be related to the formation of preferential channels for diffusion, restricting the pure 3D random walk of molecules. This effect is similar to the anomalous diffusion found for small dyes in the presence of large concentrations of crowding agents.46 The excluded volume caused by the external agent makes the diffusion of the dye apparently faster compared to a freely diffusional environment. In any case, the effect is very mild, confirming that the aqueous nature of the hydrogel is mainly maintained, and that the pore size in these gels is larger than the size of the dye. As previously reported for agarose gels, when the diffusing dye is much smaller than the pore size of the gel, an α value around 0.93 described the shape of the autocorrelation functions28 well and the dyes diffuse as if they were dissolved in homogeneous media. Although the refractive index mismatch between the probe medium and the glass may cause artifacts, such as the detection of an apparent anomalous diffusion behavior,47 the detected curves are similar to a pure diffusional model, meaning that this effect is likely negligible.
In order to test whether the quasi-aqueous environment for the 4-OMe-PG dye was promoted by the microscopic structure of the hydrogels being controlled by the long range sorting of the FeNP column-like aggregates due to the magnetic field, we probed the diffusional behavior of the dye in the MHG-0.1 and MHG-0.3 hydrogels, but formed without an external magnetic field, and in the NMHG. Fig. 9b shows the α value distributions of the 4-OMe-PG dye in these cases. Interestingly, the α distributions were very similar to the samples formed with and without the magnetic field. The average α values, obtained from the fits to a Gaussian function, were 0.97 ± 0.11 and 0.99 ± 0.08 for MHG-0.1 and MHG-0.3 respectively, formed without a field. Likewise, the average apparent diffusion coefficient values of the dye in such gels were 440 ± 190 and 410 ± 150 μm2 s−1 for MHG-0.1 and MHG-0.3, respectively. The α distributions for these hydrogels were not statistically different from α = 1 (p values >0.4), confirming also the quasi-aqueous environment of the dye in the gels. The most striking result was obtained, however, with the NMHG. The diffusion of the 4-OMe-PG dye in this gel was clearly anomalous, with an average α = 0.62 ± 0.22 (Fig. 9b), suggesting a more intricate micro-environment for the dye.
In conclusion, a small dye, such as 4-OMe-PG, finds a quasi-aqueous environment in the gels formed with FeNPs and a magnetic field, caused by the formation of preferential channels for diffusion. The formation of hydrogels with FeNPs, but in the absence of a magnetic field, leads to a very similar microenvironment. This gel microstructure largely contrasts with that of the hydrogel without FeNPs, which exhibits a diffusion in agreement with a close and tight network of fibrils. This difference in structures is in agreement with the information obtained in the ESEM images (Fig. 5).
Rheological studies
![[thin space (1/6-em)]](https://www.rsc.org/images/entities/char_2009.gif) 000 s. Finally, the values of both G′ and G′′ leveled off for times larger than approximately 50
000 s. Finally, the values of both G′ and G′′ leveled off for times larger than approximately 50![[thin space (1/6-em)]](https://www.rsc.org/images/entities/char_2009.gif) 000 s (approx. 14 hours). Similar trends were obtained for other hydrogels (not shown). Comparison between gelation kinetics for different hydrogels evidenced a faster growth of G′ and G′′ with time for magnetic hydrogels with respect to nonmagnetic hydrogels, although there was not a clear tendency to a faster gelation kinetics by increasing the content of FeNPs. Furthermore, as observed in Fig. S6 of the ESI,† from the very beginning of the experiments G′ was larger than G′′ (characteristic of the presence of a gel-like material), which is an indication of the immediate crosslinking, as soon as the GdL was added. This is not surprising since the addition of the GdL causes the immediate formation of fiber-like structures that interact by overlapping.24 Nevertheless, completion of the crosslinking process required very long times (more than 12 hours) as evidenced from the fact that the viscoelastic moduli continued to increase very quickly during this time.
000 s (approx. 14 hours). Similar trends were obtained for other hydrogels (not shown). Comparison between gelation kinetics for different hydrogels evidenced a faster growth of G′ and G′′ with time for magnetic hydrogels with respect to nonmagnetic hydrogels, although there was not a clear tendency to a faster gelation kinetics by increasing the content of FeNPs. Furthermore, as observed in Fig. S6 of the ESI,† from the very beginning of the experiments G′ was larger than G′′ (characteristic of the presence of a gel-like material), which is an indication of the immediate crosslinking, as soon as the GdL was added. This is not surprising since the addition of the GdL causes the immediate formation of fiber-like structures that interact by overlapping.24 Nevertheless, completion of the crosslinking process required very long times (more than 12 hours) as evidenced from the fact that the viscoelastic moduli continued to increase very quickly during this time.
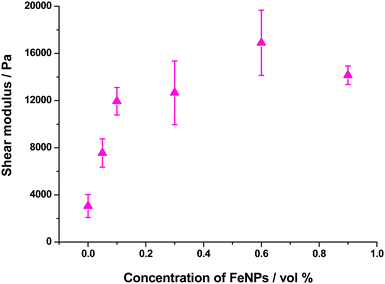
In the case of the present work, a different hypothesis should be given since the secondary structure of the peptide hydrogel was practically unperturbed by the introduction of the particles. As discussed before, some column-like particle aggregates were induced by the magnetic field at the start of gelation. Then, during the peptide gel formation, the FeNPs were assimilated within the peptide structure, which was able to withstand the column-like aggregates, as evidenced by optical microscopy (Fig. 4). Our hypothesis is that these column-like particle aggregates served as some microscopic scaffold on which the secondary structure of the peptide gel was supported, giving a superior mechanical strength to the resulting hydrogels. From the optical microscopy, it is evident that the resulting particle structures are percolating. Furthermore, from the theoretical point of view, the following analysis can be made. In a first approximation, the particle structures induced by the field can be considered as long cylinders aligned in the direction of the applied field (unit vector e1), whereas the applied shear stress is τ12. Then, according to the most common model for the mechanical properties of composite materials with cylinder inclusions, introduced by Hashin and Rosen,50 we have the following expression for the shear modulus of the composite in the cylinder direction, G12:
 | (2) |
| G12 = ΦGc + (1 − Φ)Gm | (3) |
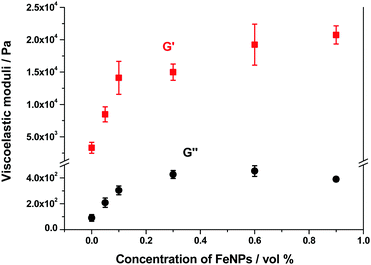
As mentioned above, all hydrogels (magnetic and nonmagnetic) of the present work presented a similar trend of G′ and G′′ as a function of strain amplitude. The main difference was the relative values of these magnitudes that increased strongly with FeNP concentrations up to 0.1 vol%, and then at a smaller rate with a tendency to level off at concentrations above 0.6 vol% – see a plot with the values corresponding to the LVR in Fig. 11. Note that an increase of G′ of approx. 7 times is obtained for the highest concentration of FeNPs (0.9 vol%) with respect to the NMHG. This trend is similar to the one discussed above for the shear modulus.
Other parameters that depend on FeNP concentration are the amplitudes of the shear strain and the shear stress corresponding to the yield point (peak value of G′′ in curves like this of Fig. S8 of the ESI†). In the case of these hydrogels, the shear strain at the yield point showed a tendency to decrease as the content of FeNPs increased, whereas the shear stress at the yield point increased with FeNP content (Fig. S10 of the ESI†). We obtained similar trends (not shown here) for the critical shear strain and critical shear stress that marked the onset of the nonlinear viscoelastic region. In overall terms, we can conclude that as FeNPs are included at a larger proportion in the composition of these supramolecular hydrogels (prepared under an applied magnetic field), the resulting magnetic hydrogels become tougher and, accordingly, their strain at fracture diminishes.
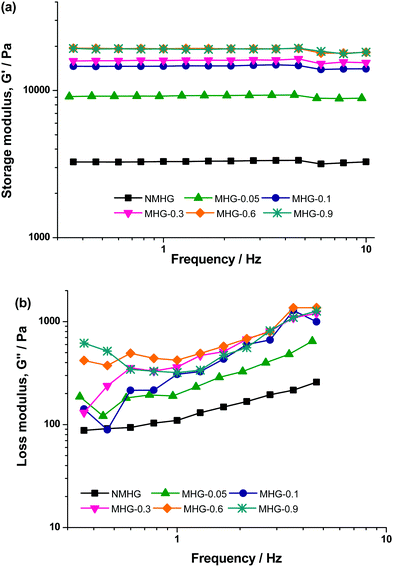
Finally, we also obtained the oscillograms (curves of G′ and G′′ as a function of frequency of oscillatory shear strain) corresponding to the LVR (Fig. 12). As observed, trends are similar for NMHG and MHGs, independent of the concentration of magnetic nanoparticles, where the values of G′ and G′′ are the only distinctive difference between the curves corresponding to different hydrogels. In all cases, G′ showed a constant value within the whole range of frequencies under study. As for G′′, first it increased smoothly with frequency, then it reached a maximum around a frequency of 4 Hz, afterwards it decreased sharply, and finally showed a tendency to level off at the highest frequencies. The independence of G′ on the frequency of the oscillatory shear, as well as the smooth increase of G′′ with frequency, are typical of strongly cross-linked systems, like rubber.51 Concerning the decrease of G′′ observed around 4 Hz, it has been previously observed for polymer hydrogels.49
| Hydrogel | Storage modulus (Pa) | Loss modulus (Pa) |
|---|---|---|
| NMHG | 2960 ± 160 | 209 ± 8 |
| MHG-0.3H | 1120 ± 120 | 124 ± 13 |
| MHG-0.3V | 5900 ± 300 | 352 ± 23 |
Conclusions
Novel short-peptide supramolecular magnetic hydrogels have been prepared by the self-assembly of Fmoc-FF in a suspension containing iron nanoparticles (FeNPs) in the presence or absence of an external magnetic field. The influence of the magnetic field modifies the structural characteristics of the hydrogels inducing the formation of FeNP column-like aggregates. The resulting anisotropic structure composed of vertically aligned FeNP columns-like aggregates engulfed by the peptide fibers is responsible for the enhancement in the mechanical properties of these hydrogels. As far as we know, this is the first time that such an enhancement in the mechanical properties of a supramolecular hydrogel has been mediated by the presence of FeNPs, and can only be explained due to the particular characteristics of this material, in which the non-covalent nature of the peptide self-assembly is essential. Quite interestingly, the peptide β-sheet secondary structure is conserved as well as the pore size, making this one of the few examples in which the mechanical strength of the gel is enhanced without significantly altering the microstructure of the gel network and improving the diffusion of a solute through it.Conflicts of interest
There are no conflicts of interest to declare.Acknowledgements
This study was supported by projects CTQ-2014-53598-R and FIS2013-41821-R (Plan Nacional de Investigación Científica, Desarrollo e Innovación Tecnológica, MINECO (Spain), co-funded by ERDF, European Union), FIS2017-85954-R (Agencia Estatal de Investigación, AEI, Spain, co-funded by Fondo Europeo de Desarrollo Regional, ERDF, European Union) and by Junta de Andalucía (Spain) project P12-FQM-2721. We also thank the “Unidad de Excelencia Química aplicada a Biomedicina y Medioambiente” (UGR) for funding.References
- (a) M. Ebara, et al., Smart Biomaterials, NIMS Monographs, National Institute for Materials Science, Japan, Springer Japan, 2014 DOI:10.1007/978-4-431-54400-5; (b) A. Döring, W. Birnbaum and D. Kuckling, Chem. Soc. Rev., 2013, 42, 7391 RSC.
- (a) E. I. Anastasova, V. Ivanovski, A. F. Fakhardo, A. I. Lepeshkin, S. Omar, A. S. Drozdov and V. V. Vinogradov, Soft Matter, 2017, 13, 8651 RSC; (b) A. Campanella, O. Holderer, K. Raftopoulos, C. Papadakis, M. Staropoli, M. Appavou, P. Müller-Buschbaum and H. Frielinghaus, Nanotechnology (IEEE-NANO), 2016 IEEE 16th International Conference on, 2016, p. 446 Search PubMed; (c) J. Thévenot, H. Oliveira, O. Sandre and S. Lecommandoux, Chem. Soc. Rev., 2013, 42, 7099 RSC.
- (a) Y. Li, G. Huang, X. Zhang, B. Li, Y. Chen, T. Lu, T. J. Lu and F. Xu, Adv. Funct. Mater., 2013, 23, 660 CrossRef CAS; (b) J. Zhang, S. Xu and E. Kumacheva, J. Am. Chem. Soc., 2004, 126, 7908 CrossRef CAS PubMed.
- (a) C. D. Jones and J. W. Steed, Chem. Soc. Rev., 2016, 45, 6546 RSC; (b) X. Du, J. Zhou, J. Shi and B. Xu, Chem. Rev., 2015, 115, 13165–13307 CrossRef CAS PubMed.
- A. Wang, W. Shi, J. Huang and Y. Yan, Soft Matter, 2016, 12, 337 RSC.
- (a) K. Tao, A. Levin, L. Adler-Abramovich and E. Gazit, Chem. Soc. Rev., 2016, 45, 3935 RSC; (b) S. Fleming and R. V. Ulijn, Chem. Soc. Rev., 2014, 43, 8150 RSC; (c) A. Dasgupta, J. H. Mondal and D. Das, RSC Adv., 2013, 3, 9117 RSC.
- E. R. Draper and D. J. Adams, Chem, 2017, 3, 390 CAS.
- (a) D. J. Cornwell and D. K. Smith, Mater. Horiz., 2015, 2, 279 RSC; (b) M. Conejero-Muriel, R. Contreras-Montoya, J. J. Díaz-Mochón, L. Álvarez de Cienfuegos and J. A. Gavira, CrystEngComm, 2015, 17, 8072 RSC; (c) M. Conejero-Muriel, J. A. Gavira, E. Pineda-Molina, A. Belsom, M. Bradley, M. Moral, J.-D. García-López Durán, A. Luque González, J. J. Díaz-Mochón, R. Contreras-Montoya, Á. Martínez-Peragón, J. M. Cuerva and L. Álvarez de Cienfuegos, Chem. Commun., 2015, 51, 3862 RSC.
- (a) J. Raeburn, C. Mendoza-Cuenca, B. N. Cattoz, M. A. Little, A. E. Terry, A. Z. Cardoso, P. C. Griffiths and D. J. Adams, Soft Matter, 2015, 11, 927 RSC; (b) J. Raeburn, G. Pont, L. Chen, Y. Cesbron, R. Levy and D. J. Adams, Soft Matter, 2012, 8, 1168 RSC; (c) L. Chen, J. Raeburn, S. Sutton, D. G. Spiller, J. Williams, J. S. Sharp, P. C. Griffiths, R. K. Heenan, S. M. King, A. Paul, S. Furzeland, D. Atkins and D. J. Adams, Soft Matter, 2011, 7, 9721 RSC; (d) W. Helen, P. D. Leonardis, R. V. Ulijn, J. Gough and N. Tirelli, Soft Matter, 2011, 7, 1732 RSC.
- (a) V. Jayawarna, S. M. Richardson, A. R. Hirst, N. W. Hodson, A. Saiani, J. E. Gough and R. V. Ulijn, Acta Biomater., 2009, 5, 934 CrossRef CAS PubMed; (b) M. Zhou, A. M. Smith, A. K. Das, N. W. Hodson, R. F. Collins, R. V. Ulijn and J. E. Gough, Biomaterials, 2009, 30, 2523 CrossRef CAS PubMed.
- (a) G. Pont, L. Chen, D. G. Spiller and D. J. Adams, Soft Matter, 2012, 8, 7797 RSC; (b) L. Chen, S. Revel, K. Morris, D. G. Spiller, L. C. Serpell and D. J. Adams, Chem. Commun., 2010, 46, 6738 RSC.
- J. Wang, Z. Wang, J. Gao, L. Wang, Z. Yang, D. Kong and Z. Yang, J. Mater. Chem., 2009, 19, 7892 RSC.
- R. Huang, W. Qi, L. Feng, R. Su and Z. He, Soft Matter, 2011, 7, 6222 RSC.
- J. Nanda, B. Adhikari, S. Basak and A. Banerjee, J. Phys. Chem. B, 2012, 116, 12235 CrossRef CAS PubMed.
- S. Roy and A. Banerjee, RSC Adv., 2012, 2, 2105 RSC.
- B. Adhikari and A. Banerjee, Soft Matter, 2011, 7, 9259 RSC.
- M. Ikeda, S. Ueno, S. Matsumoto, Y. Shimizu, H. Komatsu, K.-I. Kusumoto and I. Hamachi, Chem. – Eur. J., 2008, 14, 10808 CrossRef CAS PubMed.
- R. M. Christensen, Mechanics of Composite Materials, Krieger Publishing Company, Malabar, 1991 Search PubMed.
- M. C. Nolan, A. M. Fuentes Caparrós, B. Dietrich, M. Barrow, E. R. Cross, M. Bleuel, S. M. King and D. J. Adams, Soft Matter, 2017, 13, 8426 RSC.
- Z. Yang, H. Gu, J. Du, J. Gao, B. Zhang, X. Zhang and B. Xu, Tetrahedron, 2007, 63, 7349 CrossRef CAS.
- L. Rodriguez-Arco, I. A. Rodriguez, V. Carriel, A. B. Bonhome-Espinosa, F. Campos, P. Kuzhir, J. D. G. Duran and M. T. Lopez-Lopez, Nanoscale, 2016, 8, 8138 RSC.
- (a) R. Petros and J. M. De Simone, Nat. Rev. Drug Discovery, 2010, 9, 615 CrossRef CAS PubMed; (b) M. Arruebo, M. Galan, N. Navascues, C. Tellez, C. Marquina, M. R. Ibarra and J. Santamaria, Chem. Mater., 2006, 18, 1911 CrossRef CAS; (c) H. Otsuka, Y. Nagasaki and K. Kataoka, Adv. Drug Delivery Rev., 2012, 64, 246 CrossRef.
- J. Chatterjee, M. Bettge, Y. Haik and C. J. Chen, J. Magn. Magn. Mater., 2005, 293, 303 CrossRef CAS.
- D. J. Adams, L. M. Mullen, M. Berta, L. Chena and W. J. Frith, Soft Matter, 2010, 6, 1971 RSC.
- V. Puente-Muñoz, J. M. Paredes, S. Resa, A. M. Ortuño, E. M. Talavera, D. Miguel, J. M. Cuerva and L. Crovetto, Sens. Actuators, B, 2017, 250, 623 CrossRef.
- M. Wahl, R. Erdmann, K. Lauritsen and H. J. Rahn, Proc. SPIE, 1998, 173, 3259 Search PubMed.
- (a) S. Rüttinger, P. Kapusta, M. Patting, M. Wahl and R. Macdonald, J. Fluoresc., 2010, 20, 105 CrossRef PubMed; (b) P. Kapusta, M. Wahl, A. Benda, M. Hof and J. Enderlein, J. Fluoresc., 2007, 17, 43 CrossRef CAS PubMed.
- N. Fatin-Rouge, K. Starchev and J. Buffle, Biophys. J., 2004, 86, 2710 CrossRef CAS PubMed.
- J. M. Paredes, S. Casares, M. J. Ruedas-Rama, E. Fernández, F. Castello, L. Varela-Álvarez and A. Orte, Int. J. Mol. Sci., 2012, 13, 9400 CrossRef CAS PubMed.
- J. M. Piau, J. Non-Newtonian Fluid Mech., 2007, 144, 1 CrossRef CAS.
- D. Bonn and M. M. Denn, Science, 2009, 324, 1401 CrossRef CAS PubMed.
- S. Aktas, D. M. Kalyon, B. M. Marin-Santibanez and J. Perez-Gonzalez, J. Rheol., 2014, 58, 513 CrossRef CAS.
- H. H. Winter, Polym. Eng. Sci., 1987, 27, 1698 CAS.
- J. Cho, M. C. Heuzey and M. L. Hamdine, Macromol. Mater. Eng., 2007, 292, 571 CrossRef CAS.
- E. Moghimi, A. R. Jacob, N. Koumakis and G. Petekidis, Soft Matter, 2017, 13, 2371 RSC.
- K. Kimura, Fine particles, Marcel Dekker, Inc., 2000, pp. 513–551 Search PubMed.
- K. Quast, International Journal of Mining Engineering and Mineral Processing, 2012, 1, 73–83 CrossRef.
- R. E. Rosensweig, Ferrohydrodynamics, Cambridge University Press, Cambridge, 1985 Search PubMed.
- G. Bossis, O. Volkova, S. Lacis and A. Meunier, Lect. Notes Phys., 2002, 594, 201 Search PubMed.
- (a) A. M. Smith, R. J. Williams, C. Tang, P. Coppo, R. F. Collins, M. L. Turner, A. Saiani and R. V. Ulijn, Adv. Mater., 2008, 20, 37 CrossRef CAS; (b) A. Mahler, M. Reches, M. Rechter, S. Cohen and E. Gazit, Adv. Mater., 2006, 18, 1365 CrossRef CAS.
- B. Ding, Y. Li, M. Qin, Y. Ding, Y. Cao and W. Wang, Soft Matter, 2013, 9, 4672 RSC.
- B. Adhikari, G. Palui and A. Banerjee, Soft Matter, 2009, 5, 3452 RSC.
- A. Banerjee, G. Palui and A. Banerjee, Soft Matter, 2008, 4, 1430 RSC.
- X. Mu, K. M. Eckes, M. M. Nguyen, L. J. Suggs and P. Ren, Biomacromolecules, 2012, 13, 3562 CrossRef CAS PubMed.
- (a) L. F. Mottram, S. Boonyarattanakalin, R. E. Kovel and B. R. Peterson, Org. Lett., 2006, 8, 581 CrossRef CAS PubMed; (b) A. Orte, L. Crovetto, E. M. Talavera, N. Boens and J. M. Alvarez-Pez, J. Phys. Chem. A, 2005, 109, 734 CrossRef CAS PubMed.
- (a) S. Smith, C. Cianci and R. Grima, J. R. Soc., Interface, 2017, 14, 0047 CrossRef PubMed; (b) H. Sanabria, Y. Kubota and M. N. Waxham, Biophys. J., 2007, 92, 313 CrossRef CAS PubMed.
- S. Lehmann, S. Seiffert and W. Richtering, Macromol. Chem. Phys., 2015, 216, 156 CrossRef CAS.
- D. Borin, D. Günther, C. Hintze, G. Heinrich and S. Odenbach, J. Magn. Magn. Mater., 2012, 324, 3452 CrossRef CAS.
- A. B. Bonhome-Espinosa, F. Campos, I. A. Rodriguez, V. Carriel, J. A. Marins, A. Zubarev, J. D. G. Duran and M. T. Lopez-Lopez, Soft Matter, 2017, 13, 2928 RSC.
- Z. Hashin and B. W. Rosen, J. Appl. Mech., 1964, 31, 223 CrossRef.
- C. W. Macosko, Rheology: principles, measurements and applications, Wiley-VCH, Weinheim, 1994 Search PubMed.
Footnotes |
| † Electronic supplementary information (ESI) available: Supplementary figures. See DOI: 10.1039/c7qm00573c |
| ‡ Present address: Dpto de Química Inorgánica, Facultad de Ciencias, (UGR), Spain. |
| This journal is © the Partner Organisations 2018 |

