Azo and imine functionalized 2-naphthols: promising supramolecular gelators for selective detection of Fe3+ and Cu2+, reactive oxygen species and halides†
Atanu
Panja
and
Kumaresh
Ghosh
 *
*
Department of Chemistry, University of Kalyani, Kalyani-741235, India. E-mail: ghosh_k2003@yahoo.co.in; kumareshchem18@klyuniv.ac.in; Fax: +91 3325828282; Tel: +91 3325828750
First published on 8th August 2018
Abstract
Azo and imine functionalised 2-naphthols 1–3 have been established as low molecular weight supramolecular gelators (LMWGs). Hydrogen bonding and π–π stacking between the naphthalene units contribute a weak force for gelation. The gels have sufficient mechanical strength and are responsive to multiple ions. While the gel of 1 in CH3CN![[thin space (1/6-em)]](https://www.rsc.org/images/entities/char_2009.gif) :
:![[thin space (1/6-em)]](https://www.rsc.org/images/entities/char_2009.gif) H2O (1
H2O (1![[thin space (1/6-em)]](https://www.rsc.org/images/entities/char_2009.gif) :
:![[thin space (1/6-em)]](https://www.rsc.org/images/entities/char_2009.gif) 1, v/v) is responsive to Fe3+ and Cu2+ ions, under identical conditions the gel of 2 is sensitive to Fe3+ ions involving a gel-to-sol transition. The imine compound 3 in its gel state (DMSO
1, v/v) is responsive to Fe3+ and Cu2+ ions, under identical conditions the gel of 2 is sensitive to Fe3+ ions involving a gel-to-sol transition. The imine compound 3 in its gel state (DMSO![[thin space (1/6-em)]](https://www.rsc.org/images/entities/char_2009.gif) :
:![[thin space (1/6-em)]](https://www.rsc.org/images/entities/char_2009.gif) H2O; 1
H2O; 1![[thin space (1/6-em)]](https://www.rsc.org/images/entities/char_2009.gif) :
:![[thin space (1/6-em)]](https://www.rsc.org/images/entities/char_2009.gif) 1 v/v) displays selective interaction with Fe3+ ions over a series of other metal ions through a color change of the gel state from yellow to dark brown. Compound 3, in this context, is an LMWG that selectively detects Fe3+ and also Fe2+ in the presence of an oxidising agent. Oxidation of Fe2+ by reactive oxygen species (ROS) and its subsequent colorimetric effect on the gel of 3 finds application in ROS detection. Moreover, the Fe3+ ion-induced colored gel of 3 successfully senses F− ions visually from other halides. For real-life application, a test strip of 3 for the detection of these analytes and also its use as a rewritable display material and combinational logic gate system are demonstrated.
1 v/v) displays selective interaction with Fe3+ ions over a series of other metal ions through a color change of the gel state from yellow to dark brown. Compound 3, in this context, is an LMWG that selectively detects Fe3+ and also Fe2+ in the presence of an oxidising agent. Oxidation of Fe2+ by reactive oxygen species (ROS) and its subsequent colorimetric effect on the gel of 3 finds application in ROS detection. Moreover, the Fe3+ ion-induced colored gel of 3 successfully senses F− ions visually from other halides. For real-life application, a test strip of 3 for the detection of these analytes and also its use as a rewritable display material and combinational logic gate system are demonstrated.
Introduction
In recent years, the design and synthesis of stimuli responsive low molecular weight gelators (LMWGs) has been of foremost interest in molecular recognition and material science because of their wide range of potential applications in biomedicine, drug delivery and sensing etc.1 Gels are viscoelastic semisolid materials formed by caging a large volume of solvent into the intermolecularly linked three-dimensional architecture of a gel matrix through several non-covalent interactions like hydrogen bonding, π–π stacking, van der Waals interactions etc.2 Different functional entities of compounds of this class play a crucial role in establishing such non-covalent interactions leading to self organization. Of the different functional architectures available, salen-type imine and azo phenol motifs receive attention in molecular recognition because of their binding properties towards cations and anions.3 Several approaches in developing stimuli responsive organogelators based on these motifs are known.4 Intramolecular H-bonding and extensive π–π stacking between the aromatic rings assist the self aggregation of these molecules. Compounds of this class also exhibit several interesting properties like AIE (aggregation induced emission), photochromism, thermochromism and solvatochromism etc.5 In order to exploit such a class of compounds in metal ion sensing through a gel–sol methodology, we report here some naphthol-based azo and imine compounds 1–3 which exhibit gelation in semi-aqueous solvents. While the gel of 1 was responsive to both Fe3+ and Cu2+ ions, the gel state of 2 was only sensitive to Fe3+ ions, involving a reversible gel–sol transition. The imine compound 3 showed selective visual sensing of Fe3+ ions via a noticeable color change from yellow to dark brown in the gel state.Among the different transition metals, the sensing and detection of Fe3+ and Cu2+ ions are important because of their biological relevance. Cu2+ ions serve as a catalytic cofactor for a variety of metalloenzymes,6 though an excess of it can damage several body functions such as gastrointestinal disturbance and liver or kidney damage.7 On the other hand, the Fe3+ ion is an essential element in living cells, performing vital roles in the function of haemoglobin or other cellular metabolism processes.8 A deficiency of Fe3+ can lead to liver damage, anaemia, Alzheimer's disease, Parkinson's disease and cancer.9 Again, sensing probes for Fe3+ ions have often suffered from interference by Fe2+ or other cations.10 So, the specific detection of these metal ions is crucial. Although several fluorimetric and colorimetric sensing probes for Fe3+ ions have been reported in the literature,10,11 until now there have only been a few reports of their detection involving gel media.10i,j Thus, the scope for the development of a new supramolecular gelator for the selective recognition of Fe3+ ions is exceedingly demanding.
Results and discussion
Synthesis
Compounds 1–3 were synthesized according to Scheme 1.12 A diazo coupling reaction of 2-naphthol with aniline and 3-amino pyridine afforded compounds 1 and 2, respectively. On the other hand, Schiff base formation between 3-aminopyridine and 2-hydroxy-1-napthaldehyde in dry benzene introduced compound 3 in appreciable yield.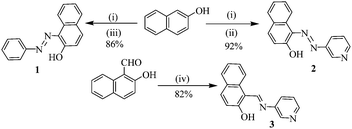 | ||
| Scheme 1 NaOH, 0–5 °C, 15 min; (ii) 3-amino pyridine, NaNO2, HCl, 0–5 °C, 30 min; (iii) aniline, NaNO2, HCl, 0–5 °C, 30 min; (iv) 3-amino pyridine, benzene, reflux, 4 h. | ||
Gelation study, aggregation and morphology of gels
The gelation tendencies of compounds 1–3 were investigated in a number of pure organic solvents and solvent mixtures. All the compounds were prone to form gels in semi-aqueous solvents rather than in pure organic solvents (Table 1S, ESI†). In polar solvents like THF, DMSO or DMF they remained soluble, but in the presence of water they readily formed aggregations leading to gelation. While the azo dyes 1 and 2 formed gels in CH3CN or CH3CN![[thin space (1/6-em)]](https://www.rsc.org/images/entities/char_2009.gif) :
:![[thin space (1/6-em)]](https://www.rsc.org/images/entities/char_2009.gif) H2O solvent systems, the imine analogue 3 was unable to undergo self-association under similar conditions. Compound 3 formed a gel from DMSO
H2O solvent systems, the imine analogue 3 was unable to undergo self-association under similar conditions. Compound 3 formed a gel from DMSO![[thin space (1/6-em)]](https://www.rsc.org/images/entities/char_2009.gif) :
:![[thin space (1/6-em)]](https://www.rsc.org/images/entities/char_2009.gif) H2O (1
H2O (1![[thin space (1/6-em)]](https://www.rsc.org/images/entities/char_2009.gif) :
:![[thin space (1/6-em)]](https://www.rsc.org/images/entities/char_2009.gif) 1, v/v). There was a noticeable difference in their minimum gelation concentrations (mgc) and gel melting temperatures (Tgel).
1, v/v). There was a noticeable difference in their minimum gelation concentrations (mgc) and gel melting temperatures (Tgel).
For our study, we focused on the CH3CN![[thin space (1/6-em)]](https://www.rsc.org/images/entities/char_2009.gif) :
:![[thin space (1/6-em)]](https://www.rsc.org/images/entities/char_2009.gif) H2O (1
H2O (1![[thin space (1/6-em)]](https://www.rsc.org/images/entities/char_2009.gif) :
:![[thin space (1/6-em)]](https://www.rsc.org/images/entities/char_2009.gif) 1, v/v) gels of 1 and 2, and the DMSO
1, v/v) gels of 1 and 2, and the DMSO![[thin space (1/6-em)]](https://www.rsc.org/images/entities/char_2009.gif) :
:![[thin space (1/6-em)]](https://www.rsc.org/images/entities/char_2009.gif) H2O (1
H2O (1![[thin space (1/6-em)]](https://www.rsc.org/images/entities/char_2009.gif) :
:![[thin space (1/6-em)]](https://www.rsc.org/images/entities/char_2009.gif) 1, v/v) gel of 3 due to their lower mgc values for gelation. Both azo dye-based gelators 1 and 2 underwent gelation in CH3CN
1, v/v) gel of 3 due to their lower mgc values for gelation. Both azo dye-based gelators 1 and 2 underwent gelation in CH3CN![[thin space (1/6-em)]](https://www.rsc.org/images/entities/char_2009.gif) :
:![[thin space (1/6-em)]](https://www.rsc.org/images/entities/char_2009.gif) H2O (1
H2O (1![[thin space (1/6-em)]](https://www.rsc.org/images/entities/char_2009.gif) :
:![[thin space (1/6-em)]](https://www.rsc.org/images/entities/char_2009.gif) 1, v/v) to give red and orange colored gels, respectively. Gelator 2 exhibited low mgc and high Tgel values (mgc = 8 mg mL−1 and at mgc Tgel = 42 °C) compared to 1 (mgc = 9 mg mL−1 and at mgc Tgel = 38 °C) thereby highlighting the subtle role of pyridine in 2. In our opinion, pyridine forms hydrogen bonds with water and introduces a cross-linked network in solution to form a gel. Furthermore, the gel forming abilities of the pyridyl conjugates 2 and 3 in THF
1, v/v) to give red and orange colored gels, respectively. Gelator 2 exhibited low mgc and high Tgel values (mgc = 8 mg mL−1 and at mgc Tgel = 42 °C) compared to 1 (mgc = 9 mg mL−1 and at mgc Tgel = 38 °C) thereby highlighting the subtle role of pyridine in 2. In our opinion, pyridine forms hydrogen bonds with water and introduces a cross-linked network in solution to form a gel. Furthermore, the gel forming abilities of the pyridyl conjugates 2 and 3 in THF![[thin space (1/6-em)]](https://www.rsc.org/images/entities/char_2009.gif) :
:![[thin space (1/6-em)]](https://www.rsc.org/images/entities/char_2009.gif) H2O compared to the phenyl analogue 1 that remained in solution, supported the participation of pyridyl nitrogen in gelation.
H2O compared to the phenyl analogue 1 that remained in solution, supported the participation of pyridyl nitrogen in gelation.
In FTIR study (Fig. 1S, ESI†), the stretching signals of phenolic –OH (at 3421 cm−1 and 3418 cm−1 for 1 and 2, respectively) became broad. The stretching frequency for the azo –N![[double bond, length as m-dash]](https://www.rsc.org/images/entities/char_e001.gif) N– bond (at 1547 cm−1 and 1578 cm−1 for 1 and 2, respectively) also shifted downfield and appeared as an overlapped band in the broad region 1634 cm−1. This suggested the breaking of some intramolecular H-bonding with the simultaneous making of intermolecular linkages involving the solvent as mediator during gelation. In the case of 3, the stretching signal for the imine –C
N– bond (at 1547 cm−1 and 1578 cm−1 for 1 and 2, respectively) also shifted downfield and appeared as an overlapped band in the broad region 1634 cm−1. This suggested the breaking of some intramolecular H-bonding with the simultaneous making of intermolecular linkages involving the solvent as mediator during gelation. In the case of 3, the stretching signal for the imine –C![[double bond, length as m-dash]](https://www.rsc.org/images/entities/char_e001.gif) N bond (1621 cm−1) also moved to the higher region by 23 cm−1 on changing from an amorphous to a gel state (Fig. 1S, ESI†) and we thereby inferred a similar situation to that proposed for 1 and 2. The aggregates are stabilized by a π-stacking force, occurring among the naphthalenes of the gelators. Intramolecular hydrogen bonding between the imine or azo nitrogen with the –OH group locks the molecular conformation into a planar arrangement and thereby results in extensive π–π stacking between the naphthalene rings, which governs the gel formation.4a
N bond (1621 cm−1) also moved to the higher region by 23 cm−1 on changing from an amorphous to a gel state (Fig. 1S, ESI†) and we thereby inferred a similar situation to that proposed for 1 and 2. The aggregates are stabilized by a π-stacking force, occurring among the naphthalenes of the gelators. Intramolecular hydrogen bonding between the imine or azo nitrogen with the –OH group locks the molecular conformation into a planar arrangement and thereby results in extensive π–π stacking between the naphthalene rings, which governs the gel formation.4a
All the gels exhibited thermally activated gel–sol phase transition. A sharp increase in Tgel was observed with an increase in gelator concentration (Fig. 2S, ESI†).
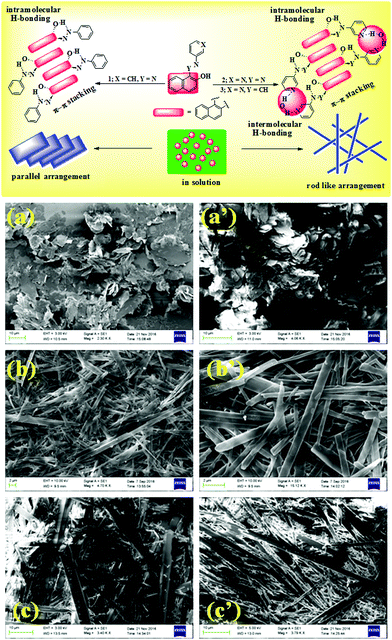
The morphologies of the gels were characterised by SEM images that revealed closely packed flakes for 1 and rod like fibrous networks for 2 and 3 (Fig. 1). In our opinion, as π–π stacking between the naphthalene units is the only stabilizing force for gelation of 1, a layer-by-layer arrangement of a large number of flakes is observed. In comparison, intermolecular hydrogen bonding involving pyridyl nitrogen atoms in 2 and 3 could possibly lead to the formation of rod-like fibers in the gel architectures.
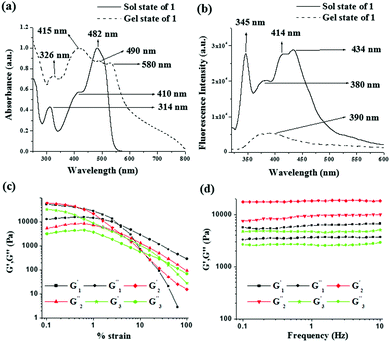
To understand the molecular aggregation, UV-vis and fluorescence spectra of compounds 1–3 in the solution and gel states were recorded and compared. The absorptions for compound 1, noted at 314 nm, 410 nm and 482 nm in solution, were red shifted to 326 nm, 415 nm and 490 nm, respectively in the gel state. In addition, a weak shoulder at 580 nm in the gel state corroborated the aggregation. A red shift of 5 nm of the absorption peak at 410 nm during gelation indicated π–π stacking (J aggregate)13 between the naphthalene rings (Fig. 2a). For compound 2, significant broadening of the absorption in the region 350–470 nm and for compound 3 a red shift of the absorption band at 432 nm by 33 units in the gel states compared to their sol states (Fig. 3S, ESI†) supported the stacking interaction.
In the fluorescence spectra, emissions centered at 380 nm, 375 nm and 362 nm for 1, 2 and 3 in the sol states, due to their excited state keto forms through ESIPT (excited state intramolecular proton transfer), were quenched and suffered red shifts by 10 nm, 8 nm and 32 nm in the gel states, respectively (for 1: Fig. 2b, for 2 and 3: Fig. 3S, ESI†). This was attributed to the existence of π–π stacking among the naphthalenes in the gel matrixes.14
Rheological study
A detailed rheological study reported the viscoelastic properties of the gels. In this experiment, the strain sweep and frequency sweep gave sufficient information about the deformation and flow characteristics of the compounds in the gel states (Fig. 2c and d). To compare the results, we prepared the three gels at a common concentration of 15 mg mL−1. The change in storage modulus (G′) and loss modulus (G′′) of the gels was recorded against increasing strain at a fixed frequency (ω) of 1 Hz (Fig. 2c). The gels were mechanically strong (G′ > G′′) over a wide range of applied strain; however, beyond a certain strain, a sharp fall in both G′ and G′′ resulted in a crossover point (critical strain) and the gels were disrupted. The crossover points were detected at 3.3%, 3.7% and 31.2% of strain for the gels of 1, 2 and 3, respectively (Table 1). Disintegration of the gel of 3 at a higher critical strain suggested its greater strain bearing capability.1f In the frequency sweep experiment (Fig. 2d) at a constant strain of 0.5%, for all the gels, both G′ and G′′ were frequency independent over the entire range studied and the values of G′ were always higher than those of G′′ (almost doubled) at any frequency. This confirmed that all the gels were elastic semisolid and stable over the entire region studied. Importantly, the gel of 2 exhibited a higher storage modulus (G′) compared to the gels of 1 and 3 (almost 3–4 times higher, Table 1). Analysis of tan![[thin space (1/6-em)]](https://www.rsc.org/images/entities/char_2009.gif) δ values (tan
δ values (tan![[thin space (1/6-em)]](https://www.rsc.org/images/entities/char_2009.gif) δ = G′′/G′; 0.59, 0.50 and 0.58 for the gels of 1, 2 and 3, respectively) revealed that the gel of 2 exhibited higher mechanical strength (lower tan
δ = G′′/G′; 0.59, 0.50 and 0.58 for the gels of 1, 2 and 3, respectively) revealed that the gel of 2 exhibited higher mechanical strength (lower tan![[thin space (1/6-em)]](https://www.rsc.org/images/entities/char_2009.gif) δ) compared to the other two gels.1g
δ) compared to the other two gels.1g
Metal ion responsive behavior of the gels
The stimuli responsive natures of the gels were investigated by adding aqueous solutions of different metal salts (as perchlorate salts, c = 0.2 M) in 1 equiv. amount on the top of the gels. In the case of 1, only Cu2+ and Fe3+ ions disintegrated the gel and validated their visual sensing. While Cu2+ ions disintegrated the gel within 1 h, Fe3+ ions took 3 h for complete rupturing of the gel. Under identical conditions, other cations did not show any phase change (Fig. 3a).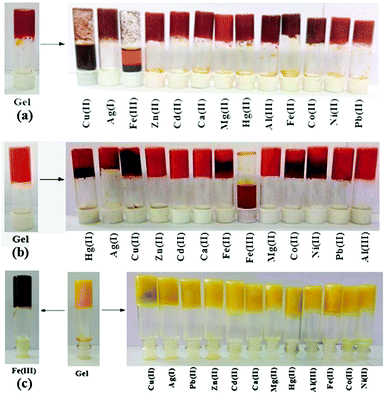 | ||
| Fig. 3 Photograph showing the changes in the gel state of (a) 1, (b) 2 and (c) 3 (at mgc) upon the addition of different metal ions. | ||
In the case of 2, only Fe3+ ions over the other metal ions examined disintegrated the gel within 1 h (Fig. 3b) and thus the gel state of 2 was more selective than the gel of 1.
To become acquainted with the sensitivity of the gel state for metal ion detection, 0.5 equiv. amounts of the metal ions instead of 1 equiv. amounts were used in the study and the same observations were noted. Only the gel to sol conversion was achieved in a longer time (Fig. 4S, ESI†). To be precise, a detailed study, as shown in Fig. 4S (ESI†), reveals that the gels of 1 and 2 were interactive with Cu2+ and Fe3+ ions when they were treated with the metal ions with a concentration as low as 0.02 M for 1 and 0.03 M for 2. Below these concentrations, there was gel formation.
The recovery of the gels from Cu2+ and Fe3+ ion-induced broken gels was tested upon separate additions of EDTA, acetylacetone, and 1-dodecanethiol (Fig. 5S and 6S, ESI†). In both cases, EDTA retrieved the gels. In contrast, while 1-dodecanethiol recovered the gel from Cu2+-induced broken gel by complexing Cu2+ ions, under similar conditions the Fe3+-induced broken gel remained unaffected. Similarly, acetyl acetone only regenerated the gel from an Fe3+-induced broken gel through strong chelation of Fe3+. These observations are worthwhile for distinguishing these metal ions.
Like the gels of 1 and 2, the metal ion responsive nature of the DMSO![[thin space (1/6-em)]](https://www.rsc.org/images/entities/char_2009.gif) :
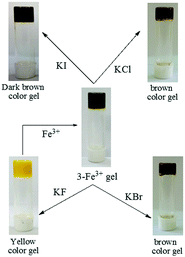
:![[thin space (1/6-em)]](https://www.rsc.org/images/entities/char_2009.gif) H2O gel of 3 was verified using the same metal ions. None of the metal ions ruptured the gel when added in 1 equiv. amount (as perchlorate salts, c = 0.2 M). Only in the presence of Fe3+ ions, the yellow colored gel turned into dark brown without showing any phase change (Fig. 3c). Upon addition of Fe3+ ions, the yellowish gel slowly changed to light brown and finally to dark brown after 24 h (Fig. 7S, ESI†). It is worth mentioning here that the dark brown colored metallogel was obtained instantly when the gel was prepared by adding an aqueous solution of Fe3+ ions to the DMSO solution of 3 by maintaining the required ratio of solvents. Thorough experiments pointed out that the presence of 0.03 equiv. of Fe3+ ions (c = 0.003 M) was the optimum at which the gel of 3 was capable of changing its color from yellow to dark brown (Fig. 8S, ESI†). Fe2+ ions did not bring about this sharp color change in the gel.
H2O gel of 3 was verified using the same metal ions. None of the metal ions ruptured the gel when added in 1 equiv. amount (as perchlorate salts, c = 0.2 M). Only in the presence of Fe3+ ions, the yellow colored gel turned into dark brown without showing any phase change (Fig. 3c). Upon addition of Fe3+ ions, the yellowish gel slowly changed to light brown and finally to dark brown after 24 h (Fig. 7S, ESI†). It is worth mentioning here that the dark brown colored metallogel was obtained instantly when the gel was prepared by adding an aqueous solution of Fe3+ ions to the DMSO solution of 3 by maintaining the required ratio of solvents. Thorough experiments pointed out that the presence of 0.03 equiv. of Fe3+ ions (c = 0.003 M) was the optimum at which the gel of 3 was capable of changing its color from yellow to dark brown (Fig. 8S, ESI†). Fe2+ ions did not bring about this sharp color change in the gel.
To check whether the counter anions of the Fe3+-salt had any role, salts other than perchlorate, such as FeCl3 and Fe2(SO4)3, were used in the study. Observations in all cases were identical. However, when an aqueous solution of K3Fe(CN)6 was used, no change in the color of the gel state was observed due to the non-existence of free Fe3+ ions (Fig. 9S, ESI†). These findings not only ruled out the role of counter anions but also indicated the key function of free Fe3+ ions in bringing a color change to the gel state. As in the case of 1 and 2, the yellow color of the original gel of 3 was recovered upon addition of an aqueous solution of EDTA (Fig. 10S, ESI†). Thus compound 3, comprising a naphthalene-salicylideneaniline architecture, acted as a new supramolecular gelator to selectively detect Fe3+ ions by the naked eye from other various metal ions tested.
Since most Fe3+-sensors suffer from interference by Fe2+ ions,10d–f the development of a selective, sensitive and efficient probe for Fe3+ ions is a great challenge. Gelator 3 solves this problem by giving a different coloration of the gel in the presence of Fe3+ and Fe2+ ions (Fig. 8S and 9S, ESI†).
The spectacular color change of the gel state of 3 in the presence of Fe3+ ions can presumably be attributed to the subtle change in the molecular structure of the gelator/ligand upon complexation of Fe3+ that augments the charge transfer occurring between the ligand and the metal ions.15 The SEM image of the Fe3+-3 gel exhibited clusters of small sized rods (Fig. 11S, ESI†) which is in contrast to the morphology of the gel of 3 (Fig. 1c). Even the thermal and mechanical properties of the Fe3+-induced colored gel of 3 varied from those of the simple gel of 3. A slight increase in Tg (4 °C) was recorded at the mgc of 3 in the presence of 1 equiv. of Fe3+ ions. In a dynamic amplitude sweep experiment (at a fixed frequency ω = 1 Hz) of 3-Fe3+ gel, the crossover point was detected at 1.99% strain (for the gel of 3 it was 31.2%) which indicated a decrease in the strain bearing capability and elastic nature of the gel in the presence of Fe3+ ions (Fig. 12S, ESI†). However, in a frequency sweep experiment (at a constant strain of 0.5%), the 3-Fe3+ gel was found to exhibit a higher storage modulus (G′) compared to the gel of 3 (almost 1.3 times higher), which suggested an increase in its mechanical strength.
A UV-vis spectral study of the gel of 3 itself and in the presence of Fe3+ was performed. As can be seen from Fig. 13S (ESI†), the absorption bands at 382 nm (assigned to the n–π* transition of the imine bond) and 465 nm (for the keto-amine form of the Schiff base) of the gel of 3 underwent a marked change in the presence of Fe3+. The addition of Fe3+ showed the disappearance of the peak at 382 nm followed by the appearance of a 5 nm blue shifted peak at 460 nm. This observation enables us to presume that there is a difference in the population of the equilibrium forms of the imine and keto-amine forms in the gel of 3 when Fe3+ ions are present.
An FTIR study of compounds 1–3 in their gel states was performed in the absence and presence of the said metal ions. As can be seen from Fig. 39S (ESI†), the azo motifs in 1 and 2, which appeared at 1558 cm−1 and 1578 cm−1 respectively, moved to lower stretching frequencies in the presence of metal ions (for 1: 1539 cm−1 and 1545 cm−1 in the presence of Fe3+ and Cu2+ ions respectively; for 2: 1552 cm−1 in the presence of Fe3+ ions). Similarly, in the case of 3 the stretching frequency for the imine bond at 1622 cm−1 in the gel state became broad in the presence of Fe3+ ions and it was difficult to interpret. However, in all cases, the C–O bond stretch moved to lower regions to different extents in the presence of the metal ions (Fig. 14S, ESI†). This information demonstrates that the imine or azo group in the compounds participates in interaction with the metal ions either individually or collaborately with the phenolic-OH.
Metal ion interaction in solution
![[thin space (1/6-em)]](https://www.rsc.org/images/entities/char_2009.gif) :
:![[thin space (1/6-em)]](https://www.rsc.org/images/entities/char_2009.gif) H2O (1
H2O (1![[thin space (1/6-em)]](https://www.rsc.org/images/entities/char_2009.gif) :
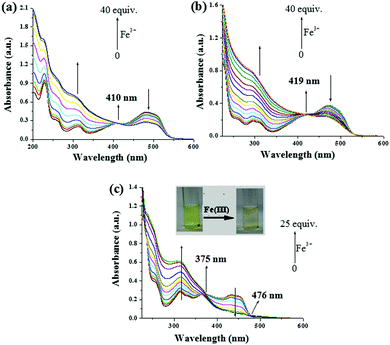
:![[thin space (1/6-em)]](https://www.rsc.org/images/entities/char_2009.gif) 1, v/v). During titration with different metal ions, the absorption spectra of all the compounds were influenced by Fe3+ ions alone (Fig. 15S, ESI†). Upon titration with Fe3+ ions (up to 40 equiv.), for compound 1, the absorption at 482 nm was gradually decreased followed by an increase in intensity of the band at 314 nm, resulting in an isosbestic point at 410 nm (Fig. 4a), which clearly indicated the complexation of Fe3+ ions with 1. Except for Cu2+ ions (up to 5 equiv.) which brought about a weak ratiometric response (Fig. 16S, ESI†), other metal ions did not significantly affect the absorption spectrum of 1 (Fig. 15Sa, ESI†). In our opinion, such a weak interaction of 1 with Cu2+ ions was sufficient to disturb the gel state.
1, v/v). During titration with different metal ions, the absorption spectra of all the compounds were influenced by Fe3+ ions alone (Fig. 15S, ESI†). Upon titration with Fe3+ ions (up to 40 equiv.), for compound 1, the absorption at 482 nm was gradually decreased followed by an increase in intensity of the band at 314 nm, resulting in an isosbestic point at 410 nm (Fig. 4a), which clearly indicated the complexation of Fe3+ ions with 1. Except for Cu2+ ions (up to 5 equiv.) which brought about a weak ratiometric response (Fig. 16S, ESI†), other metal ions did not significantly affect the absorption spectrum of 1 (Fig. 15Sa, ESI†). In our opinion, such a weak interaction of 1 with Cu2+ ions was sufficient to disturb the gel state.
Like 1, a ratiometric spectral change for pyridyl azo analogue 2 with Fe3+ was observed (Fig. 4b), where all the other metal ions were found to be non-interacting (Fig. 15Sb, ESI†).
The UV-vis spectrum of the imine analogue 3 that exhibited four absorption bands at 314 nm, 368 nm, 432 nm and 452 nm, was also influenced by Fe3+ ions. Upon the gradual addition of 25 equiv. amounts of Fe3+ ions, a ratiometric change with two isosbestic points at 375 nm and 476 nm associated with a noticeable color change from light green to a faint pale brown color was observed (Fig. 4c). Other metal ions, except Cu2+, did not show any considerable change in absorption (Fig. 15Sc, ESI†). Although Cu2+ brought about a change in the absorption spectra, the light green color of the solution remained unchanged (Fig. 17S and 18S, ESI†).
![[thin space (1/6-em)]](https://www.rsc.org/images/entities/char_2009.gif) :
:![[thin space (1/6-em)]](https://www.rsc.org/images/entities/char_2009.gif) 1 binding interaction of 1 and 2 with Fe3+ and Cu2+ ions (Fig. 23S and 24S, ESI†). Benesi–Hilderband plots17 from the UV and fluorescence for 1 and 2 with these metal ions also showed linearity and indicated a 1
1 binding interaction of 1 and 2 with Fe3+ and Cu2+ ions (Fig. 23S and 24S, ESI†). Benesi–Hilderband plots17 from the UV and fluorescence for 1 and 2 with these metal ions also showed linearity and indicated a 1![[thin space (1/6-em)]](https://www.rsc.org/images/entities/char_2009.gif) :
:![[thin space (1/6-em)]](https://www.rsc.org/images/entities/char_2009.gif) 1 binding stoichiometry (Fig. 25S–27S, ESI†). Further confirmation was achieved from mass analysis (Fig. 28S, ESI†). The detection limits18 for Fe3+ and Cu2+ ions were found to be moderate (Fig. 29S and 30S, ESI†). In this regard, Table 2S (ESI†) summarizes the findings.
1 binding stoichiometry (Fig. 25S–27S, ESI†). Further confirmation was achieved from mass analysis (Fig. 28S, ESI†). The detection limits18 for Fe3+ and Cu2+ ions were found to be moderate (Fig. 29S and 30S, ESI†). In this regard, Table 2S (ESI†) summarizes the findings.
Compound 3 demonstrates ESIPT (excited state intramolecular proton transfer).5 The enol form of salicylideneaniline 3 involves intramolecular proton transfer from the oxygen to the nitrogen atom to give the keto form.19 In CH3CN, compound 3 exhibited two emission bands at 343 nm and 432 nm corresponding to the monomeric enol form and stacked naphthalene excimer emissions, respectively. However, in CH3CN![[thin space (1/6-em)]](https://www.rsc.org/images/entities/char_2009.gif) :
:![[thin space (1/6-em)]](https://www.rsc.org/images/entities/char_2009.gif) H2O (1
H2O (1![[thin space (1/6-em)]](https://www.rsc.org/images/entities/char_2009.gif) :
:![[thin space (1/6-em)]](https://www.rsc.org/images/entities/char_2009.gif) 1, v/v) it exhibited emissions at 346 nm and 434 nm with reduced intensities for monomer and excimer emissions, respectively. Over time the monomer emission at 362 nm progressively increased, showing a noticeable color change from almost colorless (faint green color) to light green (Fig. 31S, ESI†). This is happened due to the slow disintegration of the aggregation of 3 and the emission reached a plateau region on standing at room temperature for 11 h (Fig. 32S, ESI†).
1, v/v) it exhibited emissions at 346 nm and 434 nm with reduced intensities for monomer and excimer emissions, respectively. Over time the monomer emission at 362 nm progressively increased, showing a noticeable color change from almost colorless (faint green color) to light green (Fig. 31S, ESI†). This is happened due to the slow disintegration of the aggregation of 3 and the emission reached a plateau region on standing at room temperature for 11 h (Fig. 32S, ESI†).
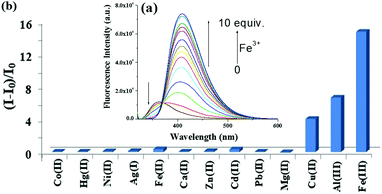
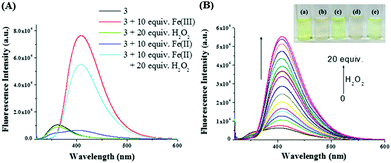
A fluorescence titration of 3 with the said metal ions was, therefore, performed 11 h after the preparation of the solution. Upon titration, Fe3+ ions resulted in a ratiometric change by showing a decrease in emission at 362 nm, with the simultaneous generation of a new peak at 408 nm. On the gradual addition of Fe3+ ions (up to 10 equiv.) the new emission at 408 nm for chelation enhanced fluorescence (CHEF) was progressively increased with a clear isoemissive point at 368 nm (Fig. 5a). Strong chelation causes intramolecular bond rotation and stops the nonradiative decay. Like Fe3+, Al3+ and Cu2+ ions also induced similar spectral changes but to lesser extents, as realized from the bar plot in Fig. 5b. In the event, Fe2+ ions did not change the emission (Fig. 33S, ESI†).
Fe3+ ions interacted with 3 in 1![[thin space (1/6-em)]](https://www.rsc.org/images/entities/char_2009.gif) :
:![[thin space (1/6-em)]](https://www.rsc.org/images/entities/char_2009.gif) 2 [G
2 [G![[thin space (1/6-em)]](https://www.rsc.org/images/entities/char_2009.gif) :
:![[thin space (1/6-em)]](https://www.rsc.org/images/entities/char_2009.gif) H] stoichiometric fashion, as is evident from the Job plot (Fig. 34S, ESI†). This was further supported by mass spectroscopy (Fig. 35S, ESI†). The non-linear fitting of the UV-vis and emission titration data (Fig. 36S and 37S, ESI†) gave values of the binding constant which were found to be higher than those of the Fe3+ complexes of 1 and 2 (Table 2S, ESI†). The detection limit for Fe3+ ions was determined to be 6.67 × 10⁻⁶ M and 9.76 × 10⁻⁷ M from UV-vis and fluorescence, respectively (Fig. 36S and 37S, ESI†).
H] stoichiometric fashion, as is evident from the Job plot (Fig. 34S, ESI†). This was further supported by mass spectroscopy (Fig. 35S, ESI†). The non-linear fitting of the UV-vis and emission titration data (Fig. 36S and 37S, ESI†) gave values of the binding constant which were found to be higher than those of the Fe3+ complexes of 1 and 2 (Table 2S, ESI†). The detection limit for Fe3+ ions was determined to be 6.67 × 10⁻⁶ M and 9.76 × 10⁻⁷ M from UV-vis and fluorescence, respectively (Fig. 36S and 37S, ESI†).
To understand the interaction further, 1H NMR of 1, 2 and 3 with the said metal ions were recorded in CDCl3, but no measurable change in chemical shift was observed (Fig. 38S and 39S, ESI†). The signal for phenolic –OH in each case was retained even in the presence of the metal ions, thereby indicating the existence of strong intramolecular hydrogen bonding.
Applications of gel 3
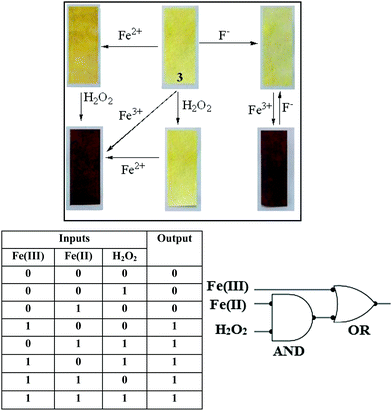
The Fenton reaction in the gel state was also performed successfully. A thorough experiment, in this context, is represented in Fig. 7. We performed several parallel experiments using Fe3+ and Fe2+-salts in 0.3 equiv. amounts (c = 0.03 M in H2O). In the study, compound 3 was taken in DMSO and the gelations were investigated in the presence of an aqueous solution of either Fe2+ ions or H2O2. In such cases, the gels were orange or brown colored. In contrast, the addition of an aqueous solution of Fe3+ ions to a DMSO solution of 3 yielded a deep brown colored gel. This was attained, in another way, when Fe2+ and H2O2 were added together to a DMSO solution of 3. This implied the in situ oxidation of Fe2+ into Fe3+ and its subsequent effect on the gel in bringing about a color. To the best of our knowledge, this is the first report of utilizing the Fenton reaction condition in the gel state for discriminating Fe3+ from Fe2+ ions.
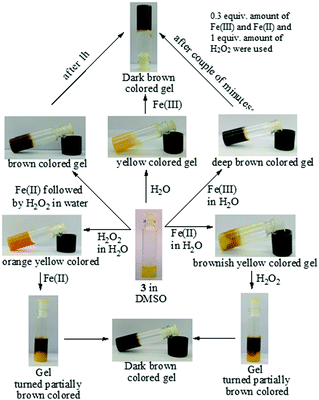 | ||
Fig. 7 Chemical responsiveness of the yellow colored DMSO![[thin space (1/6-em)]](https://www.rsc.org/images/entities/char_2009.gif) : :![[thin space (1/6-em)]](https://www.rsc.org/images/entities/char_2009.gif) H2O (1 H2O (1![[thin space (1/6-em)]](https://www.rsc.org/images/entities/char_2009.gif) : :![[thin space (1/6-em)]](https://www.rsc.org/images/entities/char_2009.gif) 1, v/v) gel of 3 under different conditions. 1, v/v) gel of 3 under different conditions. | ||
Since compound 3 successfully performed the Fenton reaction condition both in gel and solution states, we then explored it for the sensing of reactive oxygen species (ROS) which are expected to oxidize the Fe2+ into Fe3+ ions. Although numerous fluorimetric sensing probes for the recognition of reactive oxidants in solution have been reported in the literature, very few supramolecular gelators are known which have validated their visual sensing.20
In this study, compound 3 (11 mg mL−1) was taken in DMSO and then an aqueous solution of Fe2+ ions was added to it followed by the addition of different ROS like H2O2, TBHP, mCPBA, perborate and perchlorate (as an Na-salt), iodate and periodate (as a K-salt). The solutions were kept undisturbed for a while. Only H2O2 was found to be efficient in bringing about a dark brown coloration of the gel (Fig. 8). Thus, this simple experiment becomes pretty handy in the selective visual recognition of H2O2 from other ROS.
![[thin space (1/6-em)]](https://www.rsc.org/images/entities/char_2009.gif) :
:![[thin space (1/6-em)]](https://www.rsc.org/images/entities/char_2009.gif) H2O solution of 3 and then drying them in air (Fig. 10). When the yellow colored 3-coated test kit was plunged deep into the Fe3+ solution a couple of times and dried in the air, it turned an intense brown color. Under identical conditions no color changes of the test kits were observed for Fe2+ or H2O2. Then we put the test kit into the Fe2+ solution first, and then into the H2O2. Here we also got similar deep brown colored kits. Again, the brown color kit turned to a pale yellow color in the presence of F− ions. These results indicated that compound 3 can be used as a suitable practical sensor for multi-analyte recognition.
H2O solution of 3 and then drying them in air (Fig. 10). When the yellow colored 3-coated test kit was plunged deep into the Fe3+ solution a couple of times and dried in the air, it turned an intense brown color. Under identical conditions no color changes of the test kits were observed for Fe2+ or H2O2. Then we put the test kit into the Fe2+ solution first, and then into the H2O2. Here we also got similar deep brown colored kits. Again, the brown color kit turned to a pale yellow color in the presence of F− ions. These results indicated that compound 3 can be used as a suitable practical sensor for multi-analyte recognition.
Recovery of the yellow colored kit upon fluoride treatment enabled us to establish compound 3 as rewritable display material, as shown in Fig. 41S (ESI†). Interestingly, writing on the Fe3+ coated brown colored strip with a brush dipped into an aqueous solution of F− resulted in a yellowish written image. The written image was detectable by the naked eye, as there was a sharp color change. However, the written image could be wiped out by washing with a solution of Fe3+ ions and regenerated upon treatment with F− solution.
Furthermore, compound 3 could also be represented as a molecular system exhibiting combinational logic gate properties based on three inputs (Fe3+, Fe2+ and H2O2) and one output (emission of 3 at 408 nm; see Fig. 6) (Fig. 10). In order to represent the corresponding changes in emission to a logic gate mimicking circuit, the absence and presence of Fe3+, Fe2+ and H2O2 were considered as inputs 0 and 1, respectively. And similarly, the output was considered as 0 in the case of no change in fluorescence intensity and 1 in the case of fluorescence enhancement at 408 nm. Among all the combinations, the three input signals (000, 010 and 001) exhibited no change in the fluorescence intensity of 3 at 408 nm, and thereby displayed the output as “OFF” with the readout signal as 0, whereas any other combination showed fluorescence enhancement of 3 at 408 nm and thereby displayed the output as “ON” with the AND logic gate, and the output of the AND logic obtained with Fe3+ build-up the OR logic gate. Similar logic gate mimicking could also be constructed in the gel phase, based on the same inputs and the formation of a dark brown colored gel as the output signal (readout signal as 1). Thereby compound 3 could be demonstrated to be a molecular system which could respond to a three input one output combinational logic gate mimicking circuit in solution as well as in gel states.
Conclusions
In conclusion, the gelling properties and the stimuli responsive nature of azo and imine functionalized 2-naphthols 1–3 have been investigated in detail for the first time. Compounds 1–3 exhibit gelation from various solvents. While the gel of 1 from CH3CN/H2O was found to be responsive to Fe3+ and Cu2+ ions, the gel state of 2 under identical conditions was only responsive to Fe3+ ions, via a reversible gel–sol phase transition. On the other hand, the imine analogue 3 turned out to be an excellent system compared to 1 and 2 for its various functions, such as (i) selective visual detection of Fe3+ ions through a color change from yellow to dark brown in the gel-to-gel state, (ii) visual discrimination of Fe3+ and Fe2+ ions in solution phase, (iii) selective visual recognition of ROS like H2O2 in the gel phase, (iv) visual discrimination of F− from other halides, (v) as a ratiometric fluorescence sensing probe in detecting Fe3+ ions, of comparable performance with the reported systems in the literature (Table 3S, ESI†).10,21System 3 was furthermore of practical use and in this regard, several features were established: (i) the feasibility of a Fenton reaction in both solution and gel states, (ii) the preparation of test kits for several analytes (Fe3+, H2O2 and F−) and (iii) the formation of a combinational logic gate system.
Experimental
Materials
2-Naphthol, 3-aminopyridine, NaNO2, HCl and ROSs were purchased from Spectrochem and were carefully handled. Perchlorate salts of cations used in the study were purchased from Sigma-Aldrich. All solvents used in the synthesis were purified, dried and distilled as required. Solvents used in the NMR experiments were obtained from Aldrich. Thin layer chromatography was performed on Merck precoated silica gel 60-F254 plates. 1H and 13C NMR spectra were recorded using a Bruker 400 MHz instrument using TMS as the internal standard. High resolution mass data were acquired by the electron spray ionization (ESI) technique on a XEVO GS-2 QTOf Waters mass spectrometer. FTIR measurements of all the compounds and dried gels (xerogels) were carried out using a PerkinElmer L120-00A spectrometer (νmax in cm−1) using a KBr cell and KBr pellets, respectively. Scanning electron microscopy (SEM) images were obtained on an EVO LS-10 ZEISS instrument. Fluorescence and UV-vis studies were performed using a Horiba Fluoromax 4C spectrofluorimeter and a Shimadzu UV-2450 spectrophotometer, respectively.Synthesis
![[thin space (1/6-em)]](https://www.rsc.org/images/entities/char_2009.gif) :
:![[thin space (1/6-em)]](https://www.rsc.org/images/entities/char_2009.gif) 10 v/v) afforded an orange red colored pure product 1 (2.29 g, yield 86%, mp 126 °C). 1H NMR (CDCl3, 400 MHz): δ 16.29 (s, 1H), 8.59 (d, 1H, J = 8 Hz), 7.75 (m, 3H), 7.62 (d, 1H, J = 8 Hz), 7.58 (t, 1H, J = 8 Hz), 7.50 (t, 2H, J = 8 Hz), 7.42 (t, 1H, J = 8 Hz), 7.32 (t, 1H, J = 8 Hz), 6.89 (d, 1H, J = 8 Hz); 13C NMR (CDCl3, 100 MHz): 172.1, 144.6, 140.1, 133.5, 130.0, 129.6, 128.8, 128.6, 128.0, 127.4, 125.7, 124.8, 121.7, 118.5 (one carbon not found due to overlap); FTIR (KBr) ν cm−1: 3421, 1617, 1496, 1447, 1206, 1142; HRMS (TOF MS ES +): calcd 249.1022 (M + H)+, found 249.1033 (M + H)+.
10 v/v) afforded an orange red colored pure product 1 (2.29 g, yield 86%, mp 126 °C). 1H NMR (CDCl3, 400 MHz): δ 16.29 (s, 1H), 8.59 (d, 1H, J = 8 Hz), 7.75 (m, 3H), 7.62 (d, 1H, J = 8 Hz), 7.58 (t, 1H, J = 8 Hz), 7.50 (t, 2H, J = 8 Hz), 7.42 (t, 1H, J = 8 Hz), 7.32 (t, 1H, J = 8 Hz), 6.89 (d, 1H, J = 8 Hz); 13C NMR (CDCl3, 100 MHz): 172.1, 144.6, 140.1, 133.5, 130.0, 129.6, 128.8, 128.6, 128.0, 127.4, 125.7, 124.8, 121.7, 118.5 (one carbon not found due to overlap); FTIR (KBr) ν cm−1: 3421, 1617, 1496, 1447, 1206, 1142; HRMS (TOF MS ES +): calcd 249.1022 (M + H)+, found 249.1033 (M + H)+.
Gelation test and SEM imaging
The required amounts of the compounds were first dissolved in suitable organic solvents and slightly warmed to form a homogeneous solution. The required amount of water was added to the solution and it was kept at room temperature undisturbed. Gel formation was tested by the inversion of the vial method. A sample of gel for SEM imaging was dried under vacuum and then coated with a thin layer of gold metal.Determination of gel–sol transition temperature (Tgel)
The gel-to-sol transition temperature (Tgel) was defined as the temperature at which the gel melted and started to flow. Tgel was measured by the dropping ball method. In this test, a small glass ball was carefully placed on the top of the gel to be tested, which was present in a test tube. The tube was slowly heated in a thermostated oil bath until the ball fell to the bottom of the test tube. The temperature at which the ball reaches the bottom of the test tube is taken as the Tgel of that system.General procedures for fluorescence and UV-vis titrations
Stock solutions of the compounds were prepared in CH3CN/H2O (1![[thin space (1/6-em)]](https://www.rsc.org/images/entities/char_2009.gif) :
:![[thin space (1/6-em)]](https://www.rsc.org/images/entities/char_2009.gif) 1, v/v) at a concentration of 2.50 × 10⁻⁵ M. Stock solutions of metal ions were also prepared in the same solvent at a concentration of 1.0, put in the cuvette and different metal ions were individually added in different amounts. Upon addition, the change in emission of the compounds was recorded. The same stock solutions were used to perform the UV-vis titration experiments in the same way.
1, v/v) at a concentration of 2.50 × 10⁻⁵ M. Stock solutions of metal ions were also prepared in the same solvent at a concentration of 1.0, put in the cuvette and different metal ions were individually added in different amounts. Upon addition, the change in emission of the compounds was recorded. The same stock solutions were used to perform the UV-vis titration experiments in the same way.
Binding constant determination17
A Benesi–Hildebrand plot was adopted to determine the binding constant value using the expression: I0/(I − I0) = [εM/(εM − εC)](Ka−1Cg−1 + 1), where εM and εC represent the molar extinction coefficients for the receptor and the complex, respectively, at a selected wavelength, I0 denotes the emission intensity of the free receptor at that specific wavelength and Cg is the concentration of the guest. The measured absorbance I0/(I − I0) as a function of the inverse of the guest concentration fits a linear relationship, indicating 1![[thin space (1/6-em)]](https://www.rsc.org/images/entities/char_2009.gif) :
:![[thin space (1/6-em)]](https://www.rsc.org/images/entities/char_2009.gif) 1 stoichiometry of the receptor–guest complex. The ratio of the intercept to the slope was used to determine the binding constant Ka. Instead of fluorescence intensities, the respective absorbance of the receptor was also used to obtain the binding constant values.
1 stoichiometry of the receptor–guest complex. The ratio of the intercept to the slope was used to determine the binding constant Ka. Instead of fluorescence intensities, the respective absorbance of the receptor was also used to obtain the binding constant values.
Calculation of detection limit18
The detection limit was calculated using the fluorescence and UV-vis titration data. The emission and absorbance of the compounds were measured 5 times, and the standard deviation of blank measurement was achieved. To obtain the slope, emission intensities and absorbance values were plotted against concentrations of metal ions. The detection limits were calculated using the equation: detection limit = 3σ/k, where σ is the standard deviation of blank measurement, and k is the slope.Conflicts of interest
There are no conflicts to declare.Acknowledgements
AP thanks CSIR, New Delhi, India for a fellowship. KG thanks SERB, DST, New Delhi, for financial support (File No. EMR/2016/008005/OC).Notes and references
- (a) J. W. Steed, Chem. Soc. Rev., 2010, 39, 3686 RSC; (b) Functional Molecular Gels, in Soft Matter, ed. B. Escuder, J. F. Miravet, The Royal Society of Chemistry, Cambridge, 2014 Search PubMed; (c) S. Datta and S. Bhattacharya, Chem. Soc. Rev., 2015, 44, 5596 RSC; (d) G. Yu, X. Yan, C. Han and F. Huang, Chem. Soc. Rev., 2013, 42, 6697 RSC; (e) N. M. Sangeetha and U. Maitra, Chem. Soc. Rev., 2005, 34, 821 RSC; (f) Rajkamal, N. P. Pathak, D. Chatterjee, A. Paul and S. Yadav, RSC Adv., 2016, 6, 92225 RSC; (g) R. Roy, T. K. Adalder and P. Dastidar, Chem. – Asian J., 2018, 13, 552 CrossRef PubMed.
- (a) R. G. Weiss and P. Terech, Molecular Gels, Springer, Dordrecht, 2006, p. 978 CrossRef; (b) F. Fages, Low Molecular Mass Gelators, Topics in Current Chemistry, Springer-Verlag, Berlin, 2005, vol. 256, p. 283 Search PubMed; (c) D. K. Smith, Molecular Gels-Nanostructured Soft Materials, in Organic Nanostructures, ed. J. L. Atwood and J. W. Steed, Wiley-VCH, Weinheim, 2008 Search PubMed; (d) S. S. Babu, V. K. Praveen and A. Ajayaghosh, Chem. Rev., 2014, 114, 1973 CrossRef PubMed; (e) P. A. Gale, N. Busschaert, C. J. E. Haynes, L. E. Karagiannidis and I. L. Kirby, Chem. Soc. Rev., 2014, 43, 205 RSC.
- (a) D. Udhayakumari and S. Velmathi, Sens. Actuators, B, 2015, 209, 462 CrossRef; (b) S. Mukherjee, A. K. Paul and H. Stoeckli-Evans, Sens. Actuators, B, 2014, 202, 1190 CrossRef; (c) Y. J. Na, G. J. Park, H. Y. Jo, S. A. Lee and C. Kim, New J. Chem., 2014, 38, 5769 RSC; (d) K. Rezaeian and H. Khanmohammadi, Supramol. Chem., 2016, 28, 256 CrossRef; (e) L. Yan, T. Qing, R. Li, Z. Wang and Z. Qi, RSC Adv., 2016, 6, 63874 RSC; (f) S. M. Kim, M. Kang, I. Choi, J. J. Lee and C. Kim, New J. Chem., 2016, 40, 776 Search PubMed; (g) Q. Y. Cao, M. Li, L. Zhou and Z. W. Wang, RSC Adv., 2014, 4, 4041 RSC; (h) A. Hens, RSC Adv., 2015, 5, 54352 RSC.
- (a) K. Ghosh and S. Panja, Supramol. Chem., 2017, 29, 350 CrossRef; (b) J. Sun, Y. Liu, L. Jin, T. Chen and B. Yin, Chem. Commun., 2016, 52, 768 RSC; (c) K. Fan, J. Song, J. Li, X. Guan, N. Tao, C. Tong, H. Shen and L. Niu, J. Mater. Chem. C, 2013, 1, 7479 RSC.
- (a) V. S. Padalkar and S. Seki, Chem. Soc. Rev., 2016, 45, 169 RSC; (b) A. Ohshima, A. Momotake and T. Arai, J. Photochem. Photobiol., A, 2004, 162, 473 CrossRef; (c) H. Joshi, F. S. Kamounah, C. Gooijer, G. van der Zwan and L. Antonov, J. Photochem. Photobiol., A, 2002, 152, 183 CrossRef; (d) X. Ma, R. Sun, J. Cheng, J. Liu, F. Gou, H. Xiang and X. Zhou, J. Chem. Educ., 2016, 93, 345 CrossRef.
- E. L. Que, D. W. Domaille and C. J. Chang, Chem. Rev., 2008, 108, 1517 CrossRef PubMed.
- B. Sarkar, In Metal Ions in Biological Systems, ed. H. Siegel, A. Siegel, Marcel Dekker, New York, 1981, vol. 12, pp. 233–282 Search PubMed.
- T. A. Rouault, The role of iron regulatory proteins in mammalian iron homeostasis and disease, Nat. Chem. Biol., 2006, 2, 406 CrossRef PubMed.
- (a) E. C. Theil and D. J. Goss, Chem. Rev., 2009, 109, 4568 CrossRef PubMed; (b) N. Narayanaswamy and T. Govindaraju, Sens. Actuators, B, 2012, 161, 304 CrossRef.
- (a) J. Wang, Y. Li, N. G. Patel, G. Zhang, D. Zhoub and Y. Pang, Chem. Commun., 2014, 50, 12258 RSC; (b) Y. S. Kim, G. J. Park, J. J. Lee, S. Y. Lee, S. Y. Lee and C. Kim, RSC Adv., 2015, 5, 11229 RSC; (c) S. Paul, A. Manna and S. Goswami, Dalton Trans., 2015, 44, 11805 RSC; (d) A. Mitra, B. Ramanujam and C. P. Rao, Tetrahedron Lett., 2009, 50, 776 CrossRef; (e) L. Yang, W. Zhu, M. Fang, Q. Zhang and C. Li, Spectrochim. Acta, Part A, 2013, 109, 186 CrossRef PubMed; (f) P. Kumar, V. Kumar and R. Gupta, RSC Adv., 2015, 5, 97874 RSC; (g) S. Sen, S. Sarkar, B. Chattopadhyay, A. Moirangthem, A. Basu, K. Dhara and P. Chattopadhyay, Analyst, 2012, 137, 3335 RSC; (h) J.-L. Zhong, X.-J. Jia, H.-J. Liu, X.-Z. Luo, S.-G. Hong, N. Zhanga and J.-B. Huang, Soft Matter, 2016, 12, 191 RSC; (i) M. Shellaiah, Y.-H. Wu, A. Singh, M. V. R. Raju and H.-C. Lin, J. Mater. Chem. A, 2013, 1, 1310 RSC; (j) S. Sen, S. Sarkar, B. Chattopadhyay, A. Moirangthem, A. Basu, K. Dhara and P. Chattopadhyay, Analyst, 2012, 137, 3335 RSC; (k) J.-L. Zhong, X.-J. Jia, H.-J. Liu, X.-Z. Luo, S.-G. Hong, N. Zhanga and J.-B. Huang, Soft Matter, 2016, 12, 191 RSC; (l) J.-F. Chen, Q. Lin, H. Yao, Y.-M. Zhang and T.-B. Wei, Mater. Chem. Front., 2018, 2, 999 RSC.
- (a) S. K. Sahoo, D. Sharma, R. K. Bera, G. Crisponi and J. F. Callan, Chem. Soc. Rev., 2012, 41, 7195 RSC; (b) H. Zhu, J. Fan, B. Wang and X. Peng, Chem. Soc. Rev., 2015, 44, 4337 RSC.
- (a) T. S. B. Baul and D. Deg, Synth. React. Inorg. Met. -Org. Chem., 1990, 20, 541 CrossRef; (b) T. M. Florence, D. A. Johnson and G. E. Batley, J. Electroanal. Chem. Interfacial Electrochem., 1974, 50, 113 CrossRef; (c) H. Unver, M. Yıldız, D. M. Zengin, S. Ozbey and E. Kendi, J. Chem. Crystallogr., 2001, 31, 211 CrossRef; (d) G. R. Ferreira, B. L. Marcial, H. C. Garcia, F. R. L. Faulstich, H. F. D. Santos and L. F. C. de Oliveira, Supramol. Chem., 2015, 27, 13 CrossRef.
- (a) F. Würthner, T. E. Kaiser and C. R. Saha-Möller, Angew. Chem., Int. Ed., 2011, 50, 3376 CrossRef PubMed; (b) Y. Hong, J. W. Y. Lam and B. Z. Tang, Chem. Soc. Rev., 2011, 40, 5361 RSC; (c) T. Kobayashi, j-Aggregates, World Scientific, Singapore, 1996, vol. 2 CrossRef.
- (a) D. B. Rasale, I. Maity and A. K. Das, Chem. Commun., 2014, 50, 11397 RSC; (b) S. Basak, J. Nanda and A. Banerjee, Chem. Commun., 2013, 49, 6891 RSC.
- A. Kundu, P. S. Hariharan, K. Prabakaran and S. P. Anthony, Sens. Actuators, B, 2015, 206, 524 CrossRef.
- P. Job, Ann. Chim., 1928, 9, 113 Search PubMed.
- P. T. Chou, G. R. Wu, C. Y. Wei, C. C. Cheng, C. P. Chang and F. T. Hung, J. Phys. Chem. B, 2000, 104, 7818 CrossRef.
- A. R. Sarkar, C. H. Heo, M. Y. Park, H. W. Lee and H. M. Kim, Chem. Commun., 2014, 50, 1309 RSC.
- (a) A. Ohshima, A. Momotake, R. Nagahata and T. Arai, J. Phys. Chem. A, 2005, 109, 9731 CrossRef PubMed; (b) L. Zang, H. Shang, D. Wei and S. Jiang, Sens. Actuators, B, 2013, 185, 389 CrossRef; (c) A. Ohshima, A. Momotake and T. Arai, J. Photochem. Photobiol., A, 2004, 162, 473 CrossRef.
- (a) H. Shigemitsu and I. Hamachi, Acc. Chem. Res., 2017, 50, 740 CrossRef PubMed; (b) H. S. Bhattacharya, R. Sarkar, S. Nandi, A. Porgador and R. Jelinek, Anal. Chem., 2017, 89, 830 CrossRef PubMed.
- (a) X. Yang, X. Chen, X. Lu, C. Yan, Y. Xu, X. Hang, J. Qu and R. Liu, J. Mater. Chem. C, 2016, 4, 383 RSC; (b) C. Kar, S. Samanta, S. Mukherjee, B. K. Datta, A. Ramesh and G. Das, New J. Chem., 2014, 38, 2660 RSC; (c) A. K. Singh and R. Nagarajan, Dalton Trans., 2015, 44, 19786 RSC.
Footnote |
| † Electronic supplementary information (ESI) available: Gelation tests, gel pics, figures showing the changes in emission and absorption spectra, binding curves, detection limit, 1H, 13C NMR and HRMS are available. See DOI: 10.1039/c8qm00257f |
| This journal is © the Partner Organisations 2018 |


