MOF-derived sponge-like hierarchical porous carbon for flexible all-solid-state supercapacitors†
Xiao-Man
Cao
,
Zhi-Jia
Sun
,
Si-Yu
Zhao
,
Bing
Wang
and
Zheng-Bo
Han
 *
*
College of Chemistry, Liaoning University, Shenyang 110036, P. R. China. E-mail: ceshzb@lnu.edu.cn
First published on 17th July 2018
Abstract
Novel three-dimensional (3D) interconnected hierarchical sponge-like porous carbons (PCs) using Zn-based MOFs (Zn(tbip)) with two distinct particle sizes as precursors were prepared via a one-step pyrolysis process. The size effect of the precursor on the porous architecture has been evaluated in detail. The porous carbon derived from small-sized Zn(tbip) at 900 °C (denoted as C-S-900) possesses a hierarchical porous structure with the highest specific surface area (1356 m2 g−1), which benefits ion immersion and retention. C-S-900 demonstrates an ultrahigh specific capacitance of 369 and 226 F g−1 at 10 and 400 mV s−1 in a 6 mol L−1 KOH electrolyte, respectively. In addition, a symmetric flexible all-solid-state supercapacitor device was assembled with the electrode of C-S-900 and PVA/KOH gel electrolyte. The device can offer 96% capacity after 2000 stretching–bending cycles and operate micro-electronic devices displaying excellent mechanical robustness and cycling stability. The present work explored the relationship between the size effect of MOF precursors and the porous carbon architectures to optimize the performance of supercapacitors.
1. Introduction
Flexible all-solid-state supercapacitors have become a research focus in recent years as a promising class of energy storage device and have attracted great attention due to their several important advantages including miniaturization, light-weight, flexibility, wearability and safety.1 Much effort has been made to fabricate flexible electrodes owing to the energy storage capability being mainly influenced by the electrode material. Therefore, developing new electrode materials would be significant for the development of supercapacitors.2 To date, carbon materials with diverse nanostructures have been explored as electrode materials, such as onion-like carbons (0D); carbon nanotubes (1D); graphene (2D), porous carbons (3D).3 Among these carbonaceous materials, three-dimensional (3D) hierarchical porous carbons have been expected as promising electrode materials because (i) the 3D structure can avoid overlapping-induced specific surface area loss, (ii) the hierarchical porous structure benefits the electrolyte ion immersion and retention.4 Recently, metal–organic frameworks (MOFs), consisting of metal ions and organic ligands assembled into periodically porous architecture, have been considered as outstanding templates or precursors with various properties and tunable particle sizes and morphology to prepare porous carbon materials. Xu et al. achieved porous carbon materials using MOFs as sacrificial templates for the first time,5 and demonstrated MOFs as templates to synthesize carbon materials showing high potential as electrode materials for supercapacitors. Subsequently, several studies have reported the use of MOFs as templates to obtain different structures of carbon materials.6 Yamauchi’ group prepared nanoporous carbons with two particle sizes derived from ZIF-8, and the large-sized NPC demonstrated a maximum specific capacitance of 251 F g−1 in a 1 M H2SO4 electrolyte.7 Very Recently, Xu and coworkers have reported 1D carbon nanorods and 2D graphene nanoribbons by morphology-preserved thermal transformation of rod-shaped MOFs to use as electrodes exhibiting a specific capacitance of 164 F g−1 and 193 F g−1 at 10 mV s−1, respectively.8 These results show the significant influence of MOF-derived nanostructures on capacitor performance. However, it is still a great challenge to manufacture a programmable and tunable structure, which influences or even determines the physico–chemical properties and electrochemical performance of supercapacitors.9In this work, a typical microporous MOF, Zn(tbip) consisting of zinc metal ions and tbip linkers (tbip = 5-tert-butyl isophthalate) features a three-dimensional framework with close-packed 1D channels along the c axis direction.10Zn(tbip) was selected as the precursor to prepare hierarchical porous carbon materials. Meanwhile, the C-rich tbip ligand can offer a rich carbon source that enhances the electrical conductivity of the 3D network. Two particle sizes of Zn(tbip) were prepared by facile hydrothermal processes. Whereafter, we obtained 3D interconnected sponge-like hierarchical porous carbon via one-step pyrolysis of Zn(tbip) under different temperatures (800, 900, 1000 °C). In addition, as far as we know, the synthesis of porous carbon based on Zn(tbip) has not previously been reported. The size effect of the MOF precursor on the nanostructure of the MOF derivatives was carefully investigated. Then, we used these porous carbons as electrodes to explore the relationship between the derived porous architecture and the electrochemical performance for supercapacitors. The porous carbon (C-S-900) from small-sized Zn(tbip) pyrolysed at 900 °C displayed an ultrahigh specific capacitance and was further fabricated into a flexible all-solid-state supercapacitor device exhibiting excellent mechanical and cycling stability, high power density and energy density. The sponge-like porous carbon material superbly improved the electrochemical performance for supercapacitors, which should be ascribed to the high specific surface area, hierarchically porous structure and 3D interconnected network.
2. Experimental
2.1 Materials
All of the chemicals in this work were commercially available and used without further purification. 5-tert-butylisophthalic acid (H2tbip, 99%) and poly(ethylene glycol) (PEG K10) were purchased from TCI Chemical Industry Co. Ltd. Zinc nitrate hexahydrate (Zn(NO3)2·6H2O, 99%), polytetrafluoroethylene (PTFE, 60 wt% suspension) and polyvinyl alcohol (PVA) were obtained from Shanghai Mackin Biochemical Co., Ltd. Carbon cloth was purchased from CeTech (Taiwan). Anhydrous ethanol (CH3COOH, 99%) was purchased from Tianjin Yongda Chemical Reagent Co. Ltd. Deionized (DI) water was used throughout all the experiments.2.2 Synthesis of milli-sized Zn(tbip) crystals and nano-sized Zn(tbip) crystals
The synthesis of Zn(tbip) crystals with distinct particle sizes was performed using different approaches. The milli-sized Zn(tbip) crystals were obtained using the same synthetic process as the previous reported literature,10 and were denoted as Zn(tbip)-B (average particle diameter ∼ 0.5 mm). The nano-sized Zn(tbip) crystals were obtained using a similar synthetic process to Zn(tbip)-B except for adding surfactant (PEG K10 0.02 mmol), and were denoted as Zn(tbip)-S (average particle diameter ∼ 600 nm). The two sizes of Zn(tbip) were obtained after washing by distilled water and ethanol to remove impurities and PEG K10.2.3 Pyrolysis of the Zn(tbip) samples
Zn(tbip)-B and Zn(tbip)-S were respectively transferred into an alumina boat then placed in a tube furnace under flowing Ar for 1 h to exclude air. The temperature inside the tube furnace was increased from room temperature to the target temperature n (n = 800, 900, 1000 °C) at a heating rate of 4 °C min−1, followed by a “heat soak” time of 2 h under Ar flow, then cooled down to room temperature. The resultant porous carbons under identical annealing conditions were denoted as C-B-800, C-S-800, C-B-900, C-S-900, C-B-1000 and C-S-1000.2.4 Materials characterization
The surface morphology and microstructures of Zn(tbip) and the PCs were obtained by using Scanning Electron Microscopy (SEM, a Hitachi SU8010 system, Japan) and Transmission Electron Microscopy (TEM, a Hitachi JEM-2100 system, Japan). Powder X-ray diffraction (PXRD) patterns were collected using a Bruker AXS D8 advanced automated diffractometer at 40 kV and 40 mA with Cu-Kα radiation as the X-ray source in the 2θ range of 10–85°. Raman spectra were obtained using a Renishaw Confocal micro-Raman Spectrometer equipped with a HeNe (633 nm) laser operating at 10% power. The specific surface area and pore structure of the PCs were measured by N2 adsorption–desorption isotherms at 77 K on a Quantachrome Autosorb-iQ Instrument. Before adsorption measurements, the samples were out-gassed under vacuum for at least two hours at 200 °C. The specific surface area of the samples was calculated using the BET method. The total pore volume was estimated from the amount adsorbed at a relative pressure of about 0.995. The primary mesopore volume, Vp, and micropore volume, Vmi, were respectively evaluated using the αs-plot method with the relationship of αs with relative pressure P/P0 defined by the equation: αs = 0.1385(60.65/(0.03071 − ln(P/P0)))^0.3968.11 The Vmi was calculated using the standard reduced adsorption, αs, in the interval from about 0.8 to 1.2 and from about 1.8 to 2.2 for the calculation of Vmi+me.2.5 Electrode preparation and electrochemical measurements
All of the electrochemical performances of C-B-n and C-S-n were tested in a two-electrode cell with 6 M KOH aqueous solution as electrolyte. Each electrode was prepared by mixing PCs (80%), acetylene black (10%) and PTFE binder (10%) in ethanol. The loading mass of the electrode was about 2 mg cm−2. Non-woven fabric was utilized as a separator, and nickel foam was used as a current collector. Before the measurements, the two identical electrodes were soaked adequately by the electrolyte.Flexible all-solid-state supercapacitors: The working electrodes were prepared with the aforementioned process. For the gel electrolyte preparation, PVA powder (1 g) was dissolved in 10 mL of deionized water with vigorous stirring at 85 °C until the solution became clear then cooled down to 40 °C. After cooling, KOH (1 g) was added to the mixture and stirred for 10 min. The resulting gel was poured onto a PTFE plate and dried in air to vaporize the excess water. After solidifying at room temperature, the gel electrolyte was cut into pieces matching the size of the electrodes. The symmetric flexible all-solid-state supercapacitors were assembled by sandwiching the self-supporting solidified gel with two pieces of identical electrodes.
All electrochemical measurements were carried out at room temperature by using a CHI660E electrochemical workstation (Shanghai Chenhua Instruments Co., China). Furthermore, the electrochemical properties of the symmetric supercapacitor were investigated by cyclic voltammetry (CV), galvanostatic charge-discharge measurements (GCD) and electrochemical impedance spectroscopy (EIS).
Cyclic voltammetry (CV) measurement was conducted between 0 and 1 V at increasing scan rates from 10 to 400 mV s−1. The specific capacitance calculated from CV tests can be calculated from the following formula (1):
 | (1) |
Galvanostatic charge–discharge (GCD) cycling was obtained in the potential range of 0 to 1 V by varying the constant current densities (based on the mass loading of the electrodes) from 0.05 to 20 A g−1 to evaluate the specific capacitance, the energy densities, and the power densities. The specific capacitance derived from galvanostatic tests was calculated on the basis of the discharge profile according to formula (2), and the energy densities and power densities were determined by formula (3) and (4),
 | (2) |
 | (3) |
 | (4) |
Electrochemical impedance spectroscopy (EIS) was performed at open circuit voltage (−0.02 V) within the frequency range of 10−2 to 104 Hz and 0.005 V amplitude (alternate current amplitude).
The coulombic efficiency was evaluated as the ratio between the discharging and charging time by formula (5).
 | (5) |
3. Results and discussion
3.1 Structure and texture characterization
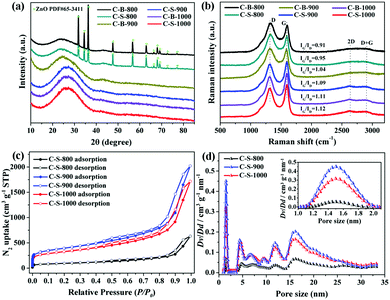
The as-synthesized powder XRD patterns of Zn(tbip)-B and Zn(tbip)-S are similar to the corresponding simulated one, confirming that Zn(tbip)-B and Zn(tbip)-S have been synthesized successfully (Fig. S1, ESI†). The PXRD patterns of the synthesized C-B-n and C-S-n samples show two broad peaks at 2θ ≈ 23° and 44°, which correspond to the (002) and (101) facets of graphitic carbon, and the sharp peaks of C-B-800 and C-S-800 are attributed to ZnO (PDF #65-3411) (Fig. 1a). Compared with C-S-900, C-B-1000 and C-S-1000, the (002) peaks of C-B-800, C-S-800, and C-B-900 shift to a lower angle toward the left direction, and the intensity of the peak is relatively weak and faintly broadened, which suggests a decreased degree of graphitization and crystallinity.12 Raman spectroscopy was used to investigate the nature of C-B-n and C-S-n. Two distinctive peaks are observed at ∼1328 cm−1 and ∼1590 cm−1, which correspond to D and G bands, respectively (Fig. 1b). The D band is related to the presence of disordered carbon structures, and the G band indicates the vibration of sp2-hybridized carbon atoms in a graphitic layer.13 The IG/ID ratio depends on the type of graphitic materials, and reflects the graphitization degree of carbon materials.14 With the increase of carbonization temperature, the IG/ID value of C-B-n and C-S-n increases gradually, which reflects the aggrandizement of the percentage of graphitic carbon.15 Moreover, the appearance of distinct peaks at 2650 cm−1 (2D band) and 2900 cm−1 (D + G band) in the Raman spectra further confirms the presence of a graphene-like structure.16The specific surface areas and the pore size distributions of the Zn(tbip)-derived PC samples were evaluated by Nitrogen adsorption–desorption isotherms measured at 77 K. The Brunauer-Emmett-Teller (BET) method was utilized to calculate the specific surface area. The cumulative pore volume and the pore size distributions were derived using the Non-Local Density Functional Theory (NLDFT, nitrogen on carbon, slit/cylinder pore) equilibrium model. As shown in Fig. 1c and Fig. S2 (ESI†), the general shape of the N2 sorption isotherms for the PC samples derived from Zn(tbip)-S crystals display typical characteristics of type-IV isotherm profiles, which suggests the existence of different pore sizes spanning from micro to macropores.8,17 At low relative pressure (P/P0 < 0.1), a steep increase in the adsorbed volume was observed, which reveals the existence of microporosity in these PCs. The hysteresis loop between adsorption and desorption branches in the P/P0 range of 0.5–1.0 can be observed for the three PCs, denoting the presence of mesopores. The vertical tails at P/P0 ≈ 1.0 point to the presence of macroporosity.18
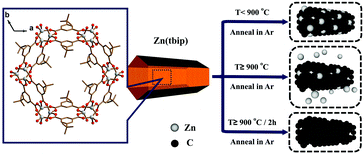
The specific surface areas and the total pore volume of the PCs are summarized in Table 1. The highest specific surface area was obtained by C-S-900, whereas the lowest one was shown by C-B-800. This result possibly can be attributed to two factors: the carbonization temperature and the particle sizes. The carbonization temperature 800 °C was not sufficient to carbonize into highly porous carbons.16 However, when the carbonization temperature reaches 900 °C, the carbon networks can be fully developed, resulting in a high surface area and porosity due to the reduction of ZnO and Zn vaporizing (ZnO(s) + C(s) → Zn + COx).18a,19 With the carbonization temperature increasing to 1000 °C, PC particles undergo agglomeration and are closely restacked leading to the decrease of porosity.
| Samples | BET (m2 g−1) | V total (cm3 g−1) | V micro (cm3 g−1) | V meso (cm3 g−1) |
|---|---|---|---|---|
| a Total pore volume based on the N2 adsorbed at P/P0 ≈ 0.995; which is the sum of micropore, mesopore and interparticle volumes. b Micropore volume according to αs-plots analysis. c Mesopore volume according to αs-plots analysis. | ||||
| C-S-800 | 318.6 | 0.78 | 0.10 | 0.51 |
| C-S-900 | 1356.3 | 2.72 | 0.33 | 1.85 |
| C-S-1000 | 1122.3 | 2.26 | 0.19 | 1.53 |
| C-B-800 | 191.2 | 0.48 | 0.06 | 0.30 |
| C-B-900 | 542.5 | 1.10 | 0.11 | 0.72 |
| C-B-1000 | 527.5 | 1.04 | 0.09 | 0.73 |
As shown in Fig. 1d, the PC samples display very close pore size distribution including a narrow micropore size at 1.5 nm and a relatively wide mesopore size ranging from 5 nm to 30 nm. It should be noted that the presence of micropores and mesopores depends on the gasification of the carbons and high evaporation etching of the Zn.20 The carbonization process is shown in Scheme 1. It can be deduced that the carbonization temperature is the critical factor for the structural evolution of PCs.7
Morphologies and microstructures of the C-B-n and C-S-n were observed by SEM and TEM (Fig. S3–S5, ESI†). The formation of PCs and the evolution of porous structures could be clearly observed in the SEM images (Fig. 2). Apparently, C-S-900 exhibits the most uniform dispersive porous texture. Compared with C-S-900, the other five samples display distinct microstructures. At the same calcination temperature, the morphologies of the PCs derived from different particle size precursors are completely different. From the SEM images, it is clear that these PC particles derived from milli-sized Zn(tbip) with an average particle size of ∼50 nm, and derived from nano-sized Zn(tbip) (∼20 nm). In addition, the evolution of porous structures also could be clearly observed in the TEM images (Fig. S5, ESI†). Compared with other PCs, C-S-900 shows a set of crumpled wrinkles with an observable graphite crystalline structure. The C-S-900 sample contained distinct pores, which are circled by white dashed lines in Fig. 2c. To closely view C-S-900, the graphitization nanostructure shows a clear lattice spacing, which calculated from the HRTEM image was ca. 0.36 nm and 0.21 nm corresponding to the (002) plane and (101) plane respectively (Fig. 2d). The different morphologies and nanostructures may lead to different electrochemical capacitance behaviors of the PCs.
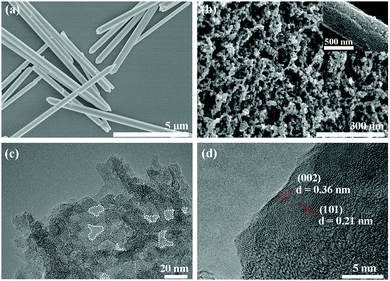 | ||
| Fig. 2 Typical SEM images of (a) nano-sized Zn(tbip) and (b) C-S-900; (c) TEM image and (d) HRTEM image of C-S-900. The circled areas mark the pores. | ||
3.2 Electrochemical properties of the porous carbons as electrode materials for supercapacitors
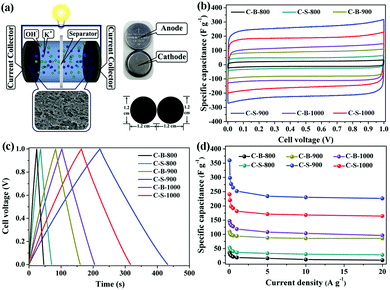
To further confirm the roles of specific surface area, porosity and electrical conductivity, we analysed the supercapacitor performances of the C-B-n and C-S-n by a two-electrode cell (Fig. 3a). The cyclic voltammetry (CV) curves of C-B-n and C-S-n at the scan rate of 50 mV s−1 were measured in 6 M KOH electrolyte. As shown in Fig. 3b, the CV curves show a symmetric rectangular shape at applied scan rates, demonstrating an ideal capacitive behavior. Fig. S6 (ESI†) shows the CV curves of C-B-n and C-S-n in the 6 M KOH aqueous electrolyte at various scan rates from 10 to 400 mV s−1. The capacitance values of C-S-n obtained from the CV curves based on formula (1) were higher than that of C-B-n when the n value was identical (Table S1, ESI†). This can be explained by the fact that, the C-S-n has a higher surface area with more sites, which are available for ions to be accumulated by electrostatic interactions and will result in an improved capacitance. The specific capacitance values at the scan rate of 10 mV s−1 for the C-S-800, C-S-900 and C-S-1000 samples were found to be 61, 369, and 248 F g−1, and for the C-B-800, C-B-900 and C-B-1000 samples were 35, 116, and 148 F g−1, respectively. Among all the samples, the maximum specific capacitance (369 F g−1) was obtained by C-S-900 with an approximately perfect rectangular shape. Additionally, it features a high capacitance retention rate of 61% (226 F g−1), even at the high scan rate of 400 mV s−1, indicating good charge propagation. It is shown by comparison of the specific capacitances of C-B-n and C-S-n that the C-S-900 sample has better capacitance performance than the other samples due to the hierarchical porous structure, the highest surface area and the largest pore volume.To further evaluate the performance of the C-B-n and C-S-n electrode, galvanostatic charge–discharge (GCD) measurements were carried out at different current densities. Fig. 3c and Fig. S7 (ESI†) show the GCD curves of the C-B-n and C-S-n symmetric supercapacitance in a 6 M KOH electrolyte. The GCD curves revealed a nearly isosceles-triangular shape with a small Ohmic drop, which suggested that the C-B-n and C-S-n electrodes possessed comparatively ideal capacitive performances and good electrochemical reversibility, which is consistent with their CV results. Moreover, a linear dependence of the discharge potential on time is identified, implying no major faradaic process.21 The specific capacitances which were calculated from the charge–discharge curves based on formula (2) at various current densities are shown in Fig. 3d. The capacitance value at 0.5 A g−1 was found to be 43, 264, and 192 F g−1 for the C-S-800, C-S-900 and C-S-1000 samples, and 21, 96, and 127 F g−1 for the C-B-800, C-B-900 and C-B-1000 samples, respectively. As expected, C-S-900 evidently exhibits the highest specific capacitance among the C-S-n and C-B-n samples. More importantly, even at a high current density up to 20 A g−1, the specific capacitance of C-S-900 still remains to be 226 F g−1 (63% of its initial capacitance at 0.05 A g−1), suggesting that C-S-900 holds excellent rate capability. Compared with the reported MOF-derived carbons for supercapacitors in the aspect of specific capacitance, we found that the C-S-900 electrode material exhibited obvious advantages (Table 2).
| No. | Samples | Current density (A g−1) | Scan rate (mV s−1) | Electrolyte | Potential window [V] | Capacitance [F g−1] | Ref. |
|---|---|---|---|---|---|---|---|
| 1 | AS-ZC-800 | 0.25 | — | 1 M H2SO4 | −0.5 to 0.5 | 251 | 4b |
| 2 | NPC-MOF-5 | 0.25 | — | 1 M H2SO4 | −0.5 to 0.5 | 258 | 5 |
| 3 | Graphene nanoribbons | 0.05 | — | 1 M H2SO4 | 0 to 1 | 198 | 8 |
| 4 | NPC650 | — | 10 | 1 M H2SO4 | −0.5 to 0.5 | 165 | 18b |
| 5 | C800 | — | 5 | 1 M H2SO4 | −0.5 to 0.5 | 188 | 20 |
| 6 | NPC | — | 5 | 1 M H2SO4 | 0 to1 | 251 | 7 |
| 7 | KBM-700 | 1 | — | 6 M KOH | −1 to 0.2 | 230 | 18c |
| 8 | Carbon-L-950 | 10 | — | 6 M KOH | −1 to 0 | 178 | 12 |
| 9 | C-S-900 | 20 | — | 6 M KOH | 0 to 1 | 226 | This Work |
| — | 10 | — | — | 369 |
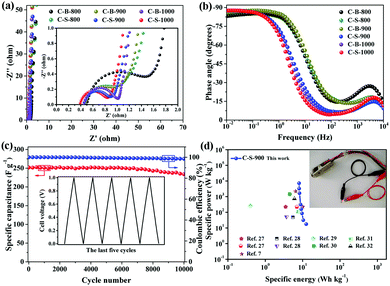
To further understand the improved capacitance of C-S-900 among the C-B-n and C-S-n samples, the electrochemical impedance spectroscopy (EIS) studies of the PCs were carried out. As we can see, the charge-transfer resistance (Rct) of C-B-n and C-S-n gradually decreases with increasing carbonization temperature from 800 to 1000 °C, indicating that high graphitization is beneficial for accelerating the ion and electron conductivity transport (Fig. 4a). Among them, the Nyquist plots show that C-S-900 has a relatively lower electrochemical series resistance (Rs = 0.43 Ω) calculated from the intercept with the real axis in the region of high frequency. Additionally, C-S-900 electrodes also show a slope of ∼45° of the portion of the curve in the middle frequency region (Warburg impedance, W), evidencing the lower resistance. Generally speaking, the lower resistance value indicates the better electrical conductivity and a fast ion transfer/diffusion rate into the pores of electrode materials, which is beneficial for the capacitive behaviours (Cdl).8
The Bode plot (phase angle vs. frequency) shows a phase angle of ∼90° in the low frequency region for C-S-900, indicating a near-ideal capacitive behaviour (Fig. 4b).22 Moreover, the operating frequency f0 (f0 is the characteristic frequency at the phase angle of 45°) of C-S-900 is 3.9 Hz, corresponding to the relaxation time constant t0 (t0 = 1/f0) is 0.256 s. The time constant is greatly shorter than those of the conventional AC supercapacitors (≈10 s),15,23 and hierarchical carbon nanocages (0.6 s),24 indicating a better capacitive behavior.
The better capacitive behaviour of C-S-900 is attributed to the following aspects: first, the specific surface area has an important effect on the charge storage of supercapacitors. The high surface areas are available for ions to be accumulated by electrostatic interactions, which will result in an improved capacitance; second, the hierarchical pore structure is beneficial to the quick diffusion and transport of electrolyte ions even at rapid charge/discharge operations. In particular, micropore-based charge storage can efficiently improve the capacitance of supercapacitors.8 Third, the pore networks of the MOF-derived carbons are interconnected unlike other carbon materials, and this allows for charge utilization of almost all of the accessible surface area. This combination of aforementioned factors greatly improved the supercapacitor performance. These experiments clearly indicate that C-S-900 as an electrode material possesses better conductivity and capacitive behaviours than the other C-B-n and C-S-n samples.
The cycling stability of the device is an important factor for application because it is closely related to the interfacial properties of the electrode/electrolyte and the electrode/current collector.25 The cycling stability of the symmetric supercapacitor device made from a C-S-900 electrode was examined using the GCD technique. Fig. 4c shows the discharge capacitance of the symmetric supercapacitor with an increasing cycle number at a current density of 1 A g−1. The specific capacitance retention remains at 93% after 10![[thin space (1/6-em)]](https://www.rsc.org/images/entities/char_2009.gif) 000 cycles. The superb long-term cycling stability of the device can be attributed to the good structural stability and electrochemical stability of C-S-900. In addition, the coulombic efficiency was about 99%, demonstrating that the C-S-900 electrode has excellent capacitive properties due to the stability of the 3D networks.
000 cycles. The superb long-term cycling stability of the device can be attributed to the good structural stability and electrochemical stability of C-S-900. In addition, the coulombic efficiency was about 99%, demonstrating that the C-S-900 electrode has excellent capacitive properties due to the stability of the 3D networks.
The energy and power densities of the device are other distinctly important parameters in practical applications.26 The Ragone plot correlating the specific energy (E) with the specific power (P) calculated from the charge–discharge data by formulas (3) and (4) is shown in Fig. 4d and Fig. S8 (ESI†). The symmetric supercapacitor using a C-S-900 electrode exhibited the highest energy density of 12.5 W h kg−1 and power density of 7200 W kg−1, respectively. Compared with other previously reported symmetric supercapacitor devices in aqueous systems, the power and rate capability of the C-S-900 are higher than those of many carbon-based supercapacitors.7,27–32 A red light emitting diode (LED, rated voltage: 3 V) was successfully lighted by three series-connected supercapacitor devices (Fig. 4d, inset), showing the potential application of the supercapacitor as a power supply.
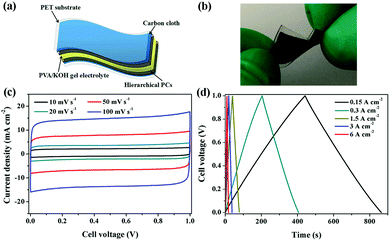
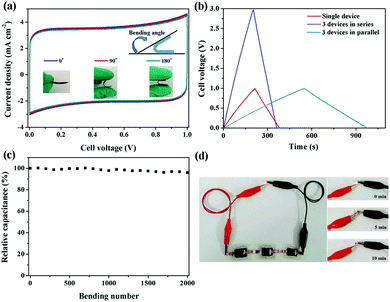
Flexible supercapacitors with exceptional electrochemical performance under mechanical deformation are highly desirable for meeting the requirements of wearable and smart electronics development.33 We then built a flexible all-solid-state supercapacitor device based on C-S-900 with an electrode–electrolyte–electrode integrated sandwich structure (Fig. 5a). The constructed supercapacitor in a bent state is shown in Fig. 5b. A PVA/KOH gel electrolyte, which serves as both the solid-state electrolyte and a thin separator,34 can be easily impregnated into the network, and in this way, the thickness of the entire device can be minimized. The CV curves of the flexible all-solid-state supercapacitor are shown in Fig. 5c, demonstrating the near ideal capacitive characteristics of the device. Fig. 5d shows GCD curves of the flexible supercapacitor measured under different current densities. The triangular-shaped GCD curves again demonstrate its capacitive characteristics. The flexible supercapacitor reaches a highest area specific capacitance of 159 mF cm−2 under a current density of 0.15 A cm−2. The highest power density of 0.58 W cm−2 and the maximum energy density of 0.0049 mW h cm−2 were achieved. We also tested the performance of such device under various practical conditions. To evaluate the feasibility of C-S-900 as a flexible electronic device, the device was pressed with various mechanical bending angles and its electrochemical performance was investigated by CV curves, as depicted in Fig. 6a. Due to the excellent mechanical property of the 3D network carbon materials, little change in the CV curves was shown at angles of 0°, 90° and 180°. We further explored the potential of the flexible supercapacitor devices for practical applications in series and in parallel with a current density of 0.15 A cm−2. Compared to a single device, three as-prepared devices in series show triple output voltage of 3.0 V, and three as-prepared devices in parallel show almost triple charge–discharge time while charging to the same voltage of 1 V, revealing that the as-prepared solid-state supercapacitor exhibits almost no performance decay (Fig. 6b). A fatigue test reveals that after 2000 stretching–bending cycles, the specific capacitance of the device maintained at 96% of the original value (Fig. 6c). To explore more practical applications, we successfully powered up a red light-emitting-diode (LED) for more than 10 min arranging three connected flexible supercapacitor devices in series (Fig. 6d). From all these results, we can determine that C-S-900, with good mechanical properties, is an excellent candidate for a flexible supercapacitor device.
4. Conclusions
In summary, Zn(tbip) precursors with controlled particle sizes have been obtained by a facile hydrothermal process. Following a one-step pyrolysis process, 3D sponge-like porous carbons were successfully prepared at 800–1000 °C. The C-S-900 prepared by annealing the small-sized Zn(tbip) at 900 °C showed the highest surface area of 1356 m2 g−1, providing more charge storage sites and an interconnected hierarchical porous architecture, providing unhindered ion diffusion paths. Benefitting from these characteristics, the C-S-900 exhibited the highest specific capacitance of 369 F g−1 at 10 mV s−1. In addition, the assembled flexible all-solid-state device displayed high capacitance, as well as excellent mechanical and cycling stability. Considering its cost effectiveness, and superb electrochemical performance, the C-S-900 could be a promising electrode material for a variety of energy-related applications. The present study demonstrated the fact that, the size of the MOF precursor had a profound influence on the porous carbon architecture. In future work, the optimization of the electrochemical performance of porous carbons could be improved by size control of the MOF precursor.Conflicts of interest
There are no conflicts of interest to declare.Acknowledgements
This work was granted financial support from the National Natural Science Foundation of China (No. 21671090 and. 21271096).Notes and references
- (a) P. P. Li, Z. Y. Jin, L. Peng, F. Zhao, D. Xiao, Y. Jin and G. H. Yu, Adv. Mater., 2018, 1800124 CrossRef PubMed; (b) L. Yao, Q. Wu, P. X. Zhang, J. M. Zhang, D. R. Wang, Y. L. Li, X. Z. Ren, H. W. Mi, L. B. Deng and Z. J. Zheng, Adv. Mater., 2018, 1706054 CrossRef PubMed; (c) X. Peng, H. L. Liu, Q. Yin, J. C. Wu, P. Z. Chen, G. Z. Zhang, G. M. Liu, C. Z. Wu and Y. Xie, Nat. Commun., 2017, 7, 11782 CrossRef PubMed; (d) Y. X. Chen, K. F. Cai, C. C. Liu, H. J. Song and X. W. Yang, Adv. Energy Mater., 2017, 1701247 CrossRef.
- (a) F. X. Wang, X. W. Wu, X. H. Yuan, Z. C. Liu, Y. Zhang, L. J. Fu, Y. S. Zhu, Q. M. Zhou, Y. P. Wu and W. Huang, Chem. Soc. Rev., 2017, 46, 6816 RSC; (b) F. Yu, T. Wang, Z. B. Wen and H. X. Wang, J. Power Sources, 2017, 364, 9 CrossRef.
- (a) S. Kumar, M. Nehra, D. Kedia, N. Dilbaghi, K. Tankeshwar and K. H. Kim, Prog. Energy Combust. Sci., 2018, 64, 219 CrossRef; (b) X. L. Li and L. J. Zhi, Chem. Soc. Rev., 2018, 47, 3189 RSC; (c) L. L. Zhang and X. S. Zhao, Chem. Soc. Rev., 2009, 38, 2520 RSC; (d) X. M. Zhang, Y. Q. Jiao, L. Sun, L. Wang, A. P. Wu, H. J. Yan, M. C. Meng, C. G. Tian, B. J. Jiang and H. G. Fu, Nanoscale, 2016, 8, 2418 RSC.
- (a) Y. G. Wang, Y. F. Song and Y. Y. Xia, Chem. Soc. Rev., 2016, 45, 5925 RSC; (b) A. J. Amali, J. K. Sun and Q. Xu, Chem. Commun., 2014, 50, 1519 RSC; (c) M. Cheng, Y. N. Meng, Q. H. Meng, L. J. Mao, M. Zhang, K. Amin, A. Ahmad, S. X. Wu and Z. X. Wei, Mater. Chem. Front., 2018, 2, 986 RSC; (d) Y. W. Zhu, S. Murali, M. D. Stoller, K. J. Ganesh, W. W. Cai, P. J. Ferreira, A. Pirkle, R. M. Wallace, K. A. Cychose, M. Thommes, D. Su, E. A. Stach and R. S. Ruoff, Science, 2011, 332, 1537 CrossRef PubMed.
- B. Liu, H. Shioyama, T. Akita and Q. Xu, J. Am. Chem. Soc., 2008, 130, 5390 CrossRef PubMed.
- (a) J. Tang, R. R. Salunkhe, J. Liu, N. L. Torad, M. Imura, S. Furukawa and Y. Yamauchi, J. Am. Chem. Soc., 2015, 137, 1572 CrossRef PubMed; (b) X. H. Cao, C. L. Tan, M. Sindoro and H. Zhang, Chem. Soc. Rev., 2017, 46, 2660 RSC; (c) R. R. Salunkhe, Y. V. Kaneti, J. Kim, J. H. Kim and Y. Yamauchi, Acc. Chem. Res., 2016, 49, 2796 CrossRef PubMed; (d) C. F. Chen, A. P. Wu, H. J. Yan, Y. L. Xiao, C. G. Tian and H. G. Fu, Chem. Sci., 2018, 9, 4746 RSC.
- R. R. Salunkhe, Y. Kamachi, N. L. Torad, S. M. Hwang, Z. Sun, S. X. Dou, J. H. Kim and Y. Yamauchi, J. Mater. Chem. A, 2014, 2, 19848 RSC.
- P. Pachfule, D. Shinde, M. Majumder and Q. Xu, Nat. Chem., 2016, 8, 718 CrossRef PubMed.
- S. Dang, Q. L. Zhu and Q. Xu, Nat. Rev. Mater., 2017, 3, 17075 CrossRef.
- L. Pan, B. Parker, X. Y. Huang, D. H. Olson, J. Y. Lee and J. Li, J. Am. Chem. Soc., 2006, 128, 4180 CrossRef PubMed.
- M. Kruk, M. Jaroniec, C. H. Ko and R. Ryoo, Chem. Mater., 2000, 12, 1961 CrossRef.
- P. Zhang, F. Sun, Z. G. Shen and D. P. Cao, J. Mater. Chem. A, 2014, 2, 12873 RSC.
- J. Zhang, D. G. Yang, W. J. Li, Y. Gao and H. Li, Electrochim. Acta, 2014, 130, 699 CrossRef.
- Y. H. Zhao, M. X. Liu, X. X. Deng, L. Miao, P. K. Tripathi, X. M. Ma, D. Z. Zhu, Z. J. Xu, Z. X. Hao and L. H. Gan, Electrochim. Acta, 2015, 153, 448 CrossRef.
- J. Y. Zhu, A. S. Childress, M. Karakaya, S. Dandeliya, A. Srivastava, Y. Lin, A. M. Rao and R. Podila, Adv. Mater., 2016, 28, 7185 CrossRef PubMed.
- S. Zhong, C. X. Zhan and D. P. Cao, Carbon, 2015, 85, 51 CrossRef.
- W. Xia, B. Qiu, D. G. Xia and R. Q. Zou, Sci. Rep., 2013, 3, 1935 CrossRef PubMed.
- (a) S. J. Yang, T. Kim, J. H. Im, Y. S. Kim, K. Lee, H. Jung and C. R. Park, Chem. Mater., 2012, 24, 464 CrossRef; (b) B. Liu, H. Shioyama, H. L. Jiang, X. B. Zhang and Q. Xu, Carbon, 2010, 48, 456 CrossRef; (c) Y. Pan, Y. X. Zhao, S. J. Mu, Y. Wang, C. M. Jiang, Q. Z. Liu, Q. R. Fang, M. Xue and S. L. Qiu, J. Mater. Chem. A, 2017, 5, 9544 RSC.
- (a) E. A. Fletcher, Ind. Eng. Chem. Res., 1999, 38, 2275 CrossRef; (b) C. M. Zhao, X. Y. Dai, T. Yao, W. X. Chen, X. Q. Wang, J. Wang, J. Yang, S. Q. Wei, Y. Wu and Y. D. Li, J. Am. Chem. Soc., 2017, 139, 8078 CrossRef PubMed; (c) P. Zhang, F. Sun, Z. H. Xiang, Z. G. Shen, J. Yun and D. P. Cao, Energy Environ. Sci., 2014, 7, 442 RSC.
- H. L. Jiang, B. Liu, Y. Q. Lan, K. Kuratani, T. Akita, H. Shioyama, F. Zong and Q. Xu, J. Am. Chem. Soc., 2011, 133, 11854 CrossRef PubMed.
- L. Hao, J. Ning, B. Lou, B. Wang, Y. B. Zhang, Z. H. Tang, J. H. Yang, A. Thomas and L. J. Zhi, J. Am. Chem. Soc., 2015, 137, 219 CrossRef PubMed.
- (a) X. W. Yang, J. W. Zhu, Q. Qiu and D. Li, Adv. Mater., 2011, 23, 2833 CrossRef PubMed; (b) J. Zhao, Y. F. Jiang, H. Fan, M. Liu, O. Zhou, X. Z. Wang, Q. Wu, L. J. Yang, Y. W. Ma and Z. Hu, Adv. Mater., 2017, 29, 1604569 CrossRef PubMed; (c) J. R. Miller, R. A. Outlaw and B. C. Holloway, Science, 2010, 329, 1637 CrossRef PubMed.
- X. M. Fan, C. Yu, J. Yang, Z. Ling, C. Hu, M. D. Zhang and J. S. Qiu, Adv. Energy Mater., 2014, 5, 1401761 CrossRef.
- Y. F. Bu, T. Sun, Y. J. Cai, L. Y. Du, O. Zhuo, L. J. Yang, Q. Wu, X. Z. Wang and Z. Hu, Adv. Mater., 2017, 29, 1700470 CrossRef PubMed.
- J. L. Kang, S. F. Zhang and Z. J. Zhang, Adv. Mater., 2017, 1700515 CrossRef PubMed.
- N. Choudhary, C. Li, J. L. Moore, N. Nagaiah, L. Zhai, Y. Jung and J. Thomas, Adv. Mater., 2017, 1605336 CrossRef PubMed.
- X. Q. Li, C. L. Hao, B. C. Tang, Y. Wang, M. Liu, Y. W. Wang, Y. H. Zhu, C. G. Lu and Z. Y. Tang, Nanoscale, 2017, 9, 2178 RSC.
- C. Zheng, L. Qi, M. Yoshio and H. Y. Wang, J. Power Sources, 2010, 195, 4406 CrossRef.
- B. E. Conway, J. Electrochem. Soc., 1991, 138, 1539 CrossRef.
- Q. Wang, J. Yan, T. Wei, J. Feng, Y. M. Ren, Z. J. Fan and M. L. Zhang, Carbon, 2013, 60, 481 CrossRef.
- X. J. He, N. Zhao, J. S. Qiu, N. Xiao, M. X. Yu, C. Yu, X. Y. Zhang and M. D. Zheng, J. Mater. Chem. A, 2013, 1, 9440 RSC.
- X. J. He, R. C. Li, J. S. Qiu, K. Xie, P. H. Ling, M. X. Yu, X. Y. Zhang and M. D. Zheng, Carbon, 2012, 50, 4911 CrossRef.
- B. C. Kim, J. Y. Hong, G. G. Wallace and H. S. Park, Adv. Energy Mater., 2015, 5, 1500959 CrossRef.
- J. Zhi, C. Y. Lin, H. L. Cui, Z. Wang, H. Zhang and F. Q. Huang, Nanoscale, 2016, 8, 4054 RSC.
Footnote |
| † Electronic supplementary information (ESI) available. See DOI: 10.1039/c8qm00284c |
| This journal is © the Partner Organisations 2018 |

