 Open Access Article
Enhanced moisture sensing properties of a nanostructured ZnO coated capacitive sensor
Harinder Singha,
Akshay Kumara,
Babankumar S. Bansodb,
Tejbir Singhc,
Anup Thakurd,
Tarandip Singhe and
Jeewan Sharma *a
*a
aDepartment of Nanotechnology, Sri Guru Granth Sahib World University, Fatehgarh Sahib, 140 407, India. E-mail: jeewansharma29@gmail.com
bCentral Scientific Instruments Organization, Chandigarh, 160 030, India
cDepartment of Physics, Sri Guru Granth Sahib World University, Fatehgarh Sahib, 140 407, India
dDepartment of Basic and Applied Sciences, Punjabi University, Patiala, Punjab 147 002, India
eDepartment of Electronics Engineering, Sri Guru Granth Sahib World University, Fatehgarh Sahib, 140 407, India
First published on 19th January 2018
Abstract
This work reports the enhancement in sensitivity of a simple and low-cost capacitive moisture sensor using a thin film of zinc oxide (ZnO) nanoparticles on electrodes. The ZnO nanoparticles are systematically characterized using X-ray diffraction, atomic force microscopy, transmission electron microscopy, BET surface area analysis, Fourier transform infrared spectroscopy, and UV-visible and photoluminescence (PL) spectroscopy. The average crystallite size of the ZnO nanoparticles is ∼16 nm with a surface roughness of ∼3 nm. Blue emission in the PL spectrum confirms the presence of oxygen vacancy dipoles, which are responsible for enhancing the dielectric properties of the ZnO nanoparticles. The effect of the ZnO nanoparticles on the sensitivity of a moisture sensor cell has been studied using wheat grains with a moisture content from 7% to 25%. An enhancement in sensitivity of 36.4% at 1 MHz and 97.4% at 500 Hz has been observed. A detailed sensing mechanism is proposed and the enhancement in sensing has been explained based on the interaction of ZnO with water vapor and the dielectric behavior of the nanostructured ZnO. The present results establish ZnO as a sensing material for improving the utility of moisture sensors.
1 Introduction
The measurement of moisture/humidity has great importance in various industry related and commercial applications, such as the monitoring of environment, industrial processes, soil, medicine analysis industries, food grains and beverages.1 Food is one of the important requirements for the survival of living organisms, so its safe storage is a highly important issue for a nation’s economy. Post-harvest losses badly affect the sustainability of the food ecosystem. During harvest, high moisture levels in food grains can deteriorate or ferment them. Therefore, it is important to measure precisely the grain moisture levels. The basic principle of a humidity/moisture sensor is based on the change in the refractive index (optical),2 mass (gravimetric),3 dielectric constant (capacitive)4,5 or in the conductivity (resistive)6–8 of the active material with the moisture content. Furthermore, the essential properties of moisture sensors for their extensive use include low cost, high sensitivity, precision and good performance.9 Amongst various moisture sensors, the capacitance measurement based sensor became most popular due to numerous merits such as being non-destructive, fast response time, small sampling volumes, higher accuracy and low cost.10,11 In the case of food grains, the capacitance value depends upon many factors9 and can be expressed using eqn (1)
 | (1) |
ZnO is a group II–VI, wide band gap (3.3 eV) semiconducting compound14 with a stable wurtzite structure15 and can be synthesized in various morphologies.16–19 It exhibits distinctive properties and is widely applicable as an electrical generator,20 or in light emitting diodes,21 solar cells,22 and different types of gas, as well as humidity, sensor.18,23,24 Due to the high chemical stability, low cost, non-toxic nature, chemical sensitivity to gases, ease of doping and enhanced dielectric properties, ZnO nanoparticles were conceived to be beneficial in gas sensing applications and moisture detection.25 ZnO nanoparticles have been synthesized using different alkaline solutions.26–28 Im et al.26 suggested that in alkaline solutions, ZnO nanoparticles are more stable and have few aggregates. Furthermore, they reported that ZnO nanoparticles obtained using LiOH show excellent electrochemical performance, high discharge capacity and small charge transfer resistance (Rct). Moreover, the maximum yield of ZnO nanoparticles has been obtained using LiOH among different alkaline hydroxides.27 Recently, it has been reported that LiOH can act as a very efficient base to control the synthesis and hence the properties of ZnO nanoparticles.28
In the present report, ZnO nanoparticles are synthesized using LiOH as a precursor and characterized using different techniques. Furthermore, efforts are made to visualize the enhancement in the sensitivity of a capacitive moisture sensor by depositing nanostructured ZnO thin films on cell electrodes. The modified and low cost sensor has been used to measure the capacitive signal for different moisture concentrations (7–25%) in wheat.
2 Materials and methods
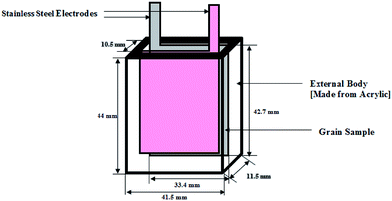
The established experimental set up included a capacitive sensor cell as the sensing system followed by an LCR meter for data measurement and acquisition. The rectangular cell was fabricated from an acrylic sheet with outer dimensions of 44.0 mm × 41.5 mm × 11.5 mm, as shown in Fig. 1. Stainless steel sheets with dimensions of 42.7 mm × 33.4 mm were used for the electrodes. The space (d) between the electrodes was 10.5 mm. These electrodes were coated with a nanocrystalline ZnO thin film using a 1000S Milman spin coating unit.29A wet chemical method was used to synthesize the ZnO nanoparticles with zinc acetate and lithium hydroxide as the precursors. The chemicals of AR grade were procured from Sigma Aldrich, India. The solutions of zinc acetate and lithium hydroxide were prepared by dissolving 3.35 mmol of Zn(Ac)2·2H2O in 31.25 ml of methanol and 6.59 mmol of lithium hydroxide powder in 50 ml of methanol under continuous stirring, respectively. Lithium hydroxide solution was added dropwise to zinc acetate solution with continuing stirring at 60 °C. After one and a half hours, the solution became turbid and ZnO nanoparticles started to precipitate. The solution was kept undisturbed for another 2 hours. The zinc oxide nanocrystals were filtered and washed twice with methanol.
The wheat grain samples with a specified moisture content were prepared as specified in ISO 712:2009.30 Four wheat samples with a 7%, 15%, 20% and 25% moisture content were prepared. For each sample, 50 g of wheat was stored in dried, cleaned and airtight polythene bags. The required quantity of deionized water was introduced into the bags and the samples were shaken energetically for 4 days. All of the wheat samples were stored at 2–6 °C and sealed after ensuring uniform distribution of water (moisture).31 The samples so prepared were then introduced into the sensor cell and the capacitance was measured using a data logging system. An LCR meter (QuadTech 1920) was used to record the capacitance of the sensor cell. These observations were recorded in the frequency range from 500 Hz to 1 MHz. Before starting the measurements, the sensor was calibrated properly for the wheat samples with differing moisture content.32 The variations in the grain size and rate of grain gaps were taken care of by repeating the experiment three times and the average value of the capacitance was considered. The stability of the sensor was ensured by repeating the experiment twice with an interval of one month. The distance between the electrodes was fixed and all of these measurements were recorded at room temperature. X-ray diffraction (XRD) spectrum was recorded using an XPERT-PRO X-ray diffractometer, with CuKα1 radiation with λ = 1.54060 Å. To study the morphological features, transmission electron microscopy (TEM) images were obtained on an FEI: FP 5022/22-Tecnai G2 20 S-Twin microscope. The specific surface area of the sample was measured with the Brunner–Emmet–Teller (BET) method using a nitrogen adsorption system (Microtrac Belsorp Mini-II). The Fourier transform infrared spectroscopy (FTIR) spectrum was recorded using a BRUKER-ALPHA spectrometer in the spectral range of 4000 to 300 cm−1. A UV-visible spectrum was obtained using a U-3900H UV-visible spectrophotometer. A fluorescence spectrophotometer (VARIAN) was used to study the photoluminescence (PL) behavior of ZnO. atomic force microscopy (AFM) images were obtained using a Veeco Explorer Instrument (USA) in contact mode over a scanning area of 3 μm × 3 μm.
3 Results and discussion
Fig. 2(a) shows the XRD spectrum of the synthesized material along with the standard pattern. The XRD analysis confirms the synthesis of hexagonal ZnO [JCPDS data file no. 00-003-0888]. The spectrum indicates the presence of peaks arising from (100), (002), (101), (102), (110), (103) and (112) reflections from the polycrystalline ZnO [JCPDS data file no. 00-003-0888]. The average crystallite size (D) has been calculated using Scherer’s equation
 | (2) |
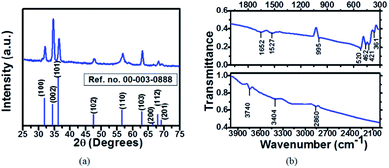 | ||
| Fig. 2 (a) The XRD pattern of the ZnO nanoparticles along with the standard data and (b) the FTIR spectrum of the ZnO nanoparticles. | ||
The FTIR spectrum of the ZnO nanoparticles in the spectral range of 4000 to 300 cm−1 is shown in Fig. 2(b). The band located at 460–520 cm−1 has been correlated to the stretching of Zn–O due to the E2 mode of the hexagonal ZnO structure.33 The peak at 3404 cm−1 confirms the presence of hydroxyl groups (O–H mode of vibration). The symmetrical bending mode vibration of C![[double bond, length as m-dash]](https://www.rsc.org/images/entities/char_e001.gif) O has been observed at 1527 cm−1. A band at 2860 cm−1 was observed due to the symmetric C–H stretching vibrational mode.34 There is an absorption band at 995 cm−1 corresponding to stretching of C–O bonds. This band confirms the presence of zinc acetate even after repeated washing of the samples.
O has been observed at 1527 cm−1. A band at 2860 cm−1 was observed due to the symmetric C–H stretching vibrational mode.34 There is an absorption band at 995 cm−1 corresponding to stretching of C–O bonds. This band confirms the presence of zinc acetate even after repeated washing of the samples.
Fig. 3(a and b) shows AFM images that confirm the good distribution of the ZnO nanoparticles along the surface. The Root Mean Square (RMS) roughness is considered as one of the most important parameters for characterizing the surface profile of a material. Analytically, it can be estimated using AFM as
 | (3) |
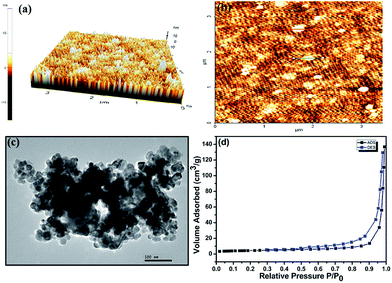 | ||
| Fig. 3 (a, b) AFM images, (c) a TEM image and (d) the nitrogen adsorption–desorption isotherm of the ZnO nanoparticles. | ||
Fig. 4(a) shows the absorption spectrum of the ZnO nanoparticles in the UV-visible region. The inset in the figure represents the variation of (αhν)2 with energy. A direct band gap value of 3.40 eV has been measured by extrapolating the straight line portion of this graph to the energy axis. A blue shift of 0.10 eV has been observed with respect to its bulk counterpart.36 Borah et al.37 obtained a blue shift of 0.58 eV due to the quantum confinement effect in ZnS nanoparticles with a size of 5.86 nm. A blue shift in the band gap of ZnO nanoparticles has also been observed with variation in the particle size from 14.69 nm to 5.57 nm.38 It has been proposed that the shift in the absorption edge is due to the polycrystalline nature of ZnO. In polycrystalline materials, there is an increase of extended localization in the conduction and valence bands leading to blue shift in the absorption edge.39 In the present study, the main reasons for the blue shift are the surface roughness and the polycrystalline nature of the ZnO nanoparticles as quantum confinement dominates at much lower particle sizes in ZnO.
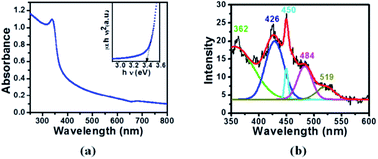 | ||
| Fig. 4 (a) Absorption spectrum and an inset showing the variation of (αhν)2 with energy and (b) photoluminescence spectrum with a fitting profile for the ZnO nanoparticles excited at 330 nm. | ||
PL study of a material provides valuable information about the defect states and charge dynamics of the recombination mechanism.40 Fig. 4(b) shows the PL curve of the ZnO nanoparticles over a wavelength range of 350 to 600 nm (excited at 330 nm). The emission spectrum was analyzed by fitting with multiple Gaussian curves. The fitting profile of the experimental data has a best fit with five peaks. The near-band-edge emission at 362 nm (UV region) is attributed to a free exciton–exciton recombination mechanism.41 The appearance of a band in the visible region is due to the existence of deep level defects arising from zinc interstitials, oxygen vacancies and the attachment of hydroxyl groups in the lattice.42 More specifically, the peak position at 426 nm corresponds to violet emission due to the transition from the conduction band to the deep hole trapped levels such as zinc vacancies (VZn).43,44 Blue emissions at 450 nm and 484 nm can be associated with the transition due to the oxygen vacancy defects (OZn).43,45 These oxygen vacancy defects act as dipoles and enhance the dielectric properties of the material.46 The emission of green coloured light around 519 nm has been assigned to the presence of Zn and oxygen at interstitial positions.47–49
To check the effect of depositing ZnO nanoparticles on electrodes, the capacitance without and with ZnO deposition has been computed. Fig. 5 shows an improved equivalent electric circuit model suggested by Nahar et al.50 for porous structured capacitor electrodes. Based on this equivalent circuit, the capacitance can be obtained as50
 | (4) |
 | (5) |
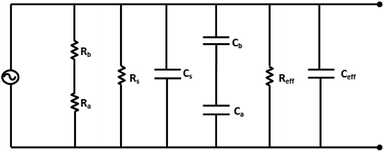 | ||
| Fig. 5 Schematic of the electrical equivalent circuit model of a moisture sensor with ZnO nanoparticles on electrodes. | ||
Fig. 6(a) shows the variation of the capacitance with frequency for differing moisture content. There is an enhancement in the capacitive signal with deposition of the ZnO nanoparticles on the electrodes. To estimate the enhancement in the sensitivity, a parameter S, which is the ratio of change in the capacitance with unit change in moisture content, has been calculated using51
 | (6) |
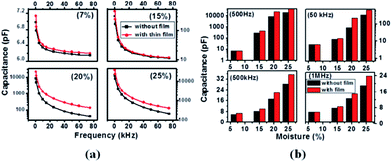 | ||
| Fig. 6 Variation of the capacitance (a) with frequency at different moisture content and (b) with moisture content at different frequencies. | ||
The variation of the capacitance with moisture content at frequencies of 500 Hz, 50 kHz, 500 kHz and 1 MHz is shown in Fig. 6(b). The enhancement in the capacitance is more prominent for lower frequencies even for the low moisture content samples. At higher frequencies, the capacitance decreases sharply due to the lack of polarization of the oxygen vacancy dipoles and adsorbed water molecules because these dipoles are not able to keep up with the rapid change in the electric field’s direction due to inertia.52 Thakur et al.53 also reported a similar frequency dependence for a CeO2 based humidity sensor. In the present work, the enhancement in the sensitivity is 97.4% at low frequency (500 Hz) and 36.4% at higher frequency (1 MHz). Lazarus et al.54 obtained a sensitivity of 0.31% pF/% RH for a parallel plate moisture sensor and Kumar55 reported a similar type of humidity sensor (capacitive) using porous alumina with limited sensitivity at lower moisture content compared to our case.
Sensing mechanism
The enhancement in sensing, due to the ZnO nanoparticles, can be explained based on the interaction of ZnO with water vapor56 along with the dielectric behavior of the nanostructured ZnO. The adsorption mechanism of water vapor on the ZnO nanoparticles is a combined effect of condensation of vapor within the capillary pores between grains57 along with chemisorption and physisorption of vapor on to the ZnO grains. Fig. 7(a) shows the layout of the inter-grain pore structure of the ZnO nanoparticles. The water vapor can easily condense due to capillary action of the pores. On exposure to moisture, there is chemisorption of water molecules on activated sites of the ZnO grains. This vapor dissociates to form hydroxyl groups when water reacts with lattice oxygen58 generating oxygen vacancies (Ov) as per eqn (7).| H2O + ZnO ↔ 2OH − Zn + Ov + 2e− | (7) |
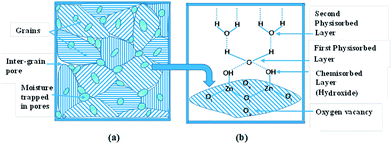 | ||
| Fig. 7 (a) The inter-grain pore structure of the ZnO nanoparticles containing water vapor and (b) chemical and physical adsorption of water molecule layers on a grain along with oxygen vacancies. | ||
There is an electronic interchange produced by the condensation of water vapor on the ZnO interface.24 More water vapor layers are physisorbed on the hydroxyl layer by hydrogen bonding (Fig. 6(b)). The singly bonded water molecules are able to form continuous dipoles leading to an increase in the dielectric constant.57 Hence, the enhancement in the capacitive signal is prominent for higher moisture content samples. In addition, the dielectric constant of ZnO itself plays an important role in enhancing the capability of the sensor. Nano-crystalline materials are well known to have a majority of atoms in grain boundaries and a very high density of surface defects.59 Hence, the grain boundaries of ZnO nanoparticles should be rich in oxygen vacancies. These vacancies act as dipoles (Fig. 7(b)) leading to higher values of the dielectric constant.46
4 Conclusions
ZnO nanoparticles were successfully synthesized using a wet chemical method. The XRD results reveal the formation of a hexagonal phase that have a predominant (002) plane of ZnO nanoparticles with an average crystallite size of ∼16 nm. TEM results also suggest the crystallite size is in the range ∼15–20 nm. FTIR and photoluminescence studies also confirm the formation of ZnO nanoparticles. BET analysis confirms a highly mesoporous structure of the ZnO nanoparticles. A blue shift in the optical band gap of the ZnO nanoparticles was observed as compared to their bulk counterpart. The surface RMS roughness for the ZnO nanoparticles is ∼3 nm. Experimental observations reveal that, after film deposition, the cell shows high-moisture sensitivity and good stability. Furthermore, the sensitivity shows much higher values at lower frequencies. The maximum enhancement in sensitivity is 97.4% at 500 Hz. This study demonstrates that the ZnO nanoparticles can be used as the sensing material for enhancing the capability of moisture sensors for wheat and other grains. The fabricated sensor is cost effective and easy to operate. For the future, ZnO nanomaterials exhibit vast possibilities in moisture sensing applications for grains.Conflicts of interest
There are no conflicts of interest to declare.Acknowledgements
The authors are thankful to Kuldeep Kumar and Alka Monga, Panjab University, Chandigarh, India, Ishita Chakrabarti, DAV Model School, Sector 15, Chandigarh, India, Jagvir Singh, Lethbridge College, Edmonton, Canada and Ritula Thakur, NITTTR, Sector 26, Chandigarh, India for their suggestions and motivation in completing this manuscript.References
- C.-Y. Lee and G.-B. Lee, Sens. Lett., 2005, 3, 1–14 CrossRef CAS
.
- R. Srivastava, N. Nidhi and B. C. Yadav, Adv. Sci. Lett., 2014, 20, 917–922 CrossRef
.
- P. Bruno, G. Cicala, F. Corsi, A. Dragone and A. M. Losacco, Sens. Actuators, B, 2004, 100, 126–130 CrossRef CAS
.
- T. Islam, A. T. Nimal, U. Mittal and M. U. Sharma, Sens. Actuators, B, 2015, 221, 357–364 CrossRef CAS
.
- H. M. J. Al-Taii, Y. M. Amin and V. Periasamy, Sci. Rep., 2016, 6, 25519 CrossRef CAS PubMed
.
- J. Qian, Z. Peng, Z. Shen, Z. Zhao, G. Zhang and X. Fu, Sci. Rep., 2016, 6, 25574 CrossRef CAS PubMed
.
- S. K. Shukla, S. K. Shukla, P. P. Govender and E. S. Agorku, Microchim. Acta, 2016, 183, 573–580 CrossRef CAS
.
- G. Korotcenkov, V. Brinzari and B. K. Cho, Microchim. Acta, 2016, 183, 1033–1054 CrossRef CAS
.
- L. Yang, Y. Zheng, Z. Jiang and Z. Ren, Improvement of the capacitive grain moisture sensor, in Computer and Computing Technologies in Agriculture V (CCTA 2011), ed. D. Li and Y. Chen, IFIP Advances in Information and Communication Technology, Springer, Berlin, 2012, vol. 370, pp. 300–307 Search PubMed
.
- T. A. Blank, L. P. Eksperiandova and K. N. Belikov, Sens. Actuators, B, 2016, 228, 416–442 CrossRef CAS
.
- S. U. Susha Lekshmi, D. N. Singh and A. N. D. M. S. Baghini, Measurement, 2014, 54, 92–105 CrossRef
.
- W. Bolton, Engineering Science, Newnes, Oxford, 5th edn, 2006 Search PubMed
.
- Q. Qi, T. Zhang, Y. Zeng and H. Yang, Sens. Actuators, B, 2009, 137, 21–26 CrossRef
.
- B. Weintraub, Z. Zhou, Y. Li and Y. Deng, Nanoscale, 2010, 2, 1573–1587 RSC
.
- A. Torabi and V. N. Staroverov, J. Phys. Chem. Lett., 2015, 6, 2075–2080 CrossRef CAS PubMed
.
- W. Wang, T. Ai and Q. Yu, Sci. Rep., 2017, 7, 42615 CrossRef CAS PubMed
.
- J. Shi, Y. Liu, Q. Peng and Y. Li, Nano Res., 2013, 6, 441–448 CrossRef CAS
.
- J. Guo, J. Zhang, M. Zhu, D. Ju, H. Xu and B. G. Cao, Sens. Actuators, B, 2014, 199, 339–345 CrossRef CAS
.
- D. Li, L. Zhao, R. Wu, C. Ronning and J. G. Lu, Nano Res., 2011, 4, 1110–1116 CrossRef CAS
.
- J. Cho, Q. Lin, S. O. Yang, J. G. Simmons Jr, Y. Cheng, E. Lin, J. Yang, J. V. Foreman, H. O. Everitt, W. Yang, J. Kim and J. Liu, Nano Res., 2012, 5, 20–26 CrossRef CAS
.
- K. Bhavsar, D. Ross, R. Prabhu and P. Pollard, Nano Rev., 2015, 6, 26711 CrossRef PubMed
.
- Z. Liang, Q. Zhang, L. Jiang and G. Cao, Energy Environ. Sci., 2015, 8, 3442–3476 CAS
.
- W. Xuan, M. He, N. Meng, X. He, W. Wang, J. Chen, T. Shi, T. Hasan, Z. Xu, Y. Xu and J. K. Luo, Sci. Rep., 2014, 4, 7206 CrossRef CAS PubMed
.
- J. Herran, I. Fernandez, E. Ochoteco, G. Cabanero and H. Grande, Sens. Actuators, B, 2014, 198, 239–242 CrossRef CAS
.
- D. Fu, C. Zhu, X. Zhang, C. Li and Y. Chen, J. Mater. Chem. A, 2016, 4, 1390–1398 CAS
.
- Y. Im, S. Kang, B. S. Kwak, K. S. Park, T. W. Cho, J. S. Lee and M. Kang, Korean J. Chem. Eng., 2016, 33, 1447–1455 CrossRef CAS
.
- A. Anzlovar, K. Kogej, Z. C. Orel and M. Zigon, Cryst. Growth Des., 2014, 14, 4262–4269 CAS
.
- Y. Lv, W. Xiao, W. Li, J. Xue and J. Ding, Nanotechnology, 2013, 24, 175702 CrossRef PubMed
.
- M. A. Basyooni, M. Shaban and A. M. E. Sayed, Sci. Rep., 2017, 7, 41716 CrossRef CAS PubMed
.
- B. S. Bansod, R. Thakur and M. Singla, Trans. Inst. Meas. Control, 2012, 34, 539–545 CrossRef
.
- B. S. Bansod and R. Thakur, J. Sci. Ind. Res., 2011, 70, 41–44 CAS
.
- H. Singh, B. S. Bansod, R. Thakur, T. Singh and J. Sharma, Int. J. Pure Appl. Phys., 2017, 13(1), 146–149 Search PubMed
.
- M. F. Khan, A. H. Ansari, M. Hameedullah, E. Ahmad, F. M. Husain, Q. Zia, U. Baig, M. R. Zaheer, M. M. Alam, A. M. Khan, Z. A. AlOthman, I. Ahmad, G. M. Ashraf and G. Aliev, Sci. Rep., 2016, 6, 27689 CrossRef CAS PubMed
.
- S. Zandi, P. Kameli, H. Salamati, H. Ahmadvand and M. Hakimi, Phys. B, 2011, 406, 3215–3218 CrossRef CAS
.
- D. L. Liu, J. J. Martin and N. N. Burnham, Optimal roughness for minimal adhesion, Appl. Phys. Lett., 2007, 91, 43107 CrossRef
.
- P. Schroer, P. Kriiger and J. Pollmann, Phys. Rev. B, 1993, 47, 6971–6980 CrossRef CAS
.
- J. P. Borah and K. C. Sarma, Acta Phys. Pol., A, 2008, 114, 713–719 CrossRef CAS
.
- S. T. Tan, B. J. Chen, X. W. Sun, W. J. Fan, H. S. Kwok, X. H. Zhang and S. J. Chua, J. Appl. Phys., 2005, 98, 013505 CrossRef
.
- S. T. Tan, B. J. Chen, X. W. Sun, X. Hu, X. H. Zhang and S. J. Chua, J. Cryst. Growth, 2005, 281, 571–576 CrossRef CAS
.
- Y. Tian, A. Merdasa, M. Peter, M. Abdellah, K. Zheng, C. S. Ponseca Jr, T. Pullerits, A. Yartsev, V. SundstrÃűm and I. G. Scheblykin, Nano Lett., 2015, 15, 1603–1608 CrossRef CAS PubMed
.
- K. Mahmood, S. B. Park and H. J. Sung, J. Mater. Chem. C, 2013, 1, 3138–3149 RSC
.
- S. Xu and Z. Wang, Nano Res., 2011, 4, 1013–1098 CrossRef CAS
.
- K. N. Abbas and N. Bidin, Morphological driven photocatalytic activity of ZnO nanostructures, Appl. Surf. Sci., 2017, 394, 498–508 CrossRef CAS
.
- E. Karber, T. Raadik, T. Dedova, J. Krustok, A. Mere, V. Mikli and M. Krunks, Nanoscale Res. Lett., 2011, 6, 359 CrossRef PubMed
.
- S. Kundu, S. Sain, B. Satpati, S. R. Bhattacharyya and S. K. Pradhan, RSC Adv., 2015, 5, 23101–23113 RSC
.
- P. Rejani, A. Radhakrishnan and B. Beena, Int. J. Nano Dimens., 2014, 5, 497–503 Search PubMed
.
- F. Oba, M. Choi, A. Togo and I. Tanaka, Science and Technology of Advanced Matererials, 2011, 12, 034302 CrossRef PubMed
.
- C. Drouilly, J. M. Krafft, F. Averseng, S. Casale, D. Bazer-Bachi, C. Chizallet, V. Lecocq, H. Vezin, H. Lauron-Pernot and G. Costentin, J. Phys. Chem. C, 2012, 116, 21297–21307 CAS
.
- T. J. Jacobsson and T. Edvinsson, Inorg. Chem., 2011, 50, 9578–9586 CrossRef CAS PubMed
.
- R. K. Nahar and V. K. Khanna, Int. J. Electron., 1982, 52, 557–567 CrossRef CAS
.
- S. Sikarwar and B. C. Yadav, Sens. Actuators, A, 2015, 233, 54–70 CrossRef CAS
.
- N. Bhargava, R. Jain, I. Joshi and K. S. Sharma, J. Environ. Nanotechnol., 2013, 2, 1–5 Search PubMed
.
- S. Thakur and P. Patil, Sens. Actuators, B, 2014, 1994, 260–268 CrossRef
.
- N. Lazarus and G. K. Fedder, J. Micromech. Microeng., 2011, 21, 065028 CrossRef
.
- S. Kumar, Solid State Physics: AIP Conference Proceedings, 2014, vol. 1591, pp. 555–557 Search PubMed
.
- J. Li, T. Fu, Y. Chen, B. Guan, M. Zhuo, T. Yang, Z. Xu, Q. Li and M. Zhang, CrystEngComm, 2014, 16, 2977 RSC
.
- H. Farahani, R. Wagiran and M. N. Hamidon, Sensors, 2014, 14, 7881–7939 CrossRef PubMed
.
- J. Fester, M. Garcia-Melchor, A. S. Walton, M. Bajdich, Z. Li, L. Lammich, A. Vojvodic and J. V. Lauritsen, Nat. Commun., 2017, 8, 14169 CrossRef CAS PubMed
.
- J. Mao, Y. Chen, J. Pei, D. Wang and Y. Li, Chem. Commun., 2016, 52, 5985–5988 RSC
.
| This journal is © The Royal Society of Chemistry 2018 |


![[thin space (1/6-em)]](https://www.rsc.org/images/entities/char_2009.gif) 641.0
641.0