 Open Access Article
Creative Commons Attribution 3.0 Unported Licence
Corrosion behaviour of micro-arc oxidation coatings on Mg–2Sr prepared in poly(ethylene glycol)-incorporated electrolytes
Dandan Gaoabcd,
Jinhe Douad,
Cheng Huad,
Huijun Yu *abc and
Chuanzhong Chen
 *ad
*ad
aShenzhen Research Institute of Shandong University, Shenzhen 518057, Guangdong, P. R. China. E-mail: yhj2001@sdu.edu.cn; czchen@sdu.edu.cn; Fax: +86 531 88395991; Tel: +86 531 88395991
bKey Laboratory of High-efficiency and Clean Mechanical Manufacture (Shandong University), Ministry of Education, School of Mechanical Engineering, Shandong University, Ji'nan 250061, Shandong, P. R. China. E-mail: yhj2001@sdu.edu.cn
cNational Demonstration Center for Experimental Mechanical Engineering Education (Shandong University), School of Mechanical Engineering, Shandong University, Ji'nan 250061, Shandong, P. R. China
dKey Laboratory for Liquid-Solid Structural Evolution and Processing of Materials, (Ministry of Education), School of Materials Science and Engineering, Shandong University, Ji'nan 250061, Shandong, P. R. China. E-mail: czchen@sdu.edu.cn
First published on 22nd January 2018
Abstract
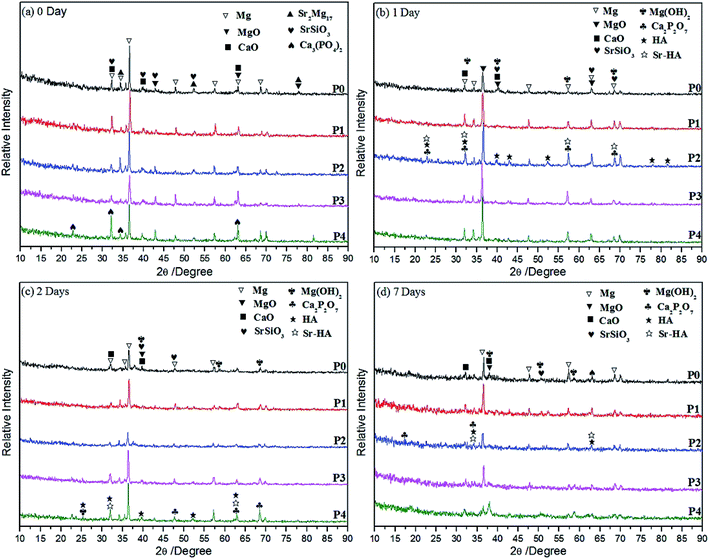
Microarc oxidized calcium phosphate (CaP) ceramic coatings were fabricated on Mg–2Sr alloy from silicate electrolytes with different concentration gradient poly(ethylene glycol) (PEG1000). The microstructure, phase and degradability of the ceramic coatings were evaluated by scanning electron microscopy (SEM), X-ray diffraction (XRD) and simulation body fluid (SBF) immersion tests respectively. An electrochemical workstation was used to investigate the electrochemical corrosion properties of the coatings. It is found that microstructure, thickness, adhesive strength and degradation rate are influenced by PEG1000 incorporation through adjusting the electrolyte activity and then altering the coating growth mechanism. Similar thicknesses (39.0–42.2 μm) are observed in PEG1000-containing coatings while their PEG1000-free counterparts possess the maximum value (51.5 μm). The weight gain in the first two days of SBF immersion suggests that a new layer containing CaP apatites is generated. Results show that ceramic coatings prepared in the electrolyte containing 8 g L−1 PEG1000 exhibits the highest corrosion resistance and lowest degradation rate.
1. Introduction
Magnesium (Mg) based alloys show exciting potentials in biocompatible, osteoconductive, degradable implants ascribed to their excellent mechanical properties, intriguing biocompatibility and spontaneous biodegradability.1–3 Concretely, the elastic modulus and compressive yield strength of Mg are closer to those of natural bone, which is beneficial to weaken stress shielding effects.4,5 Moreover, as the 4th most abundant cation in the human body, approximately half of the Mg is found in bone tissues for its essential role in human metabolism.6,7 Besides, corrosion products in vivo can be eliminated easily by the body without any adverse side effects.8 Belonging to group II in the periodic table, Sr is a promising plant growth stimulator similar to Ca in the same column.9,10 It is feasible to choose Sr-incorporated Mg based alloys to serve as bone implants. Hydroxyapatite (HA) bioactive cement incorporated with Sr (Ca10−xSrx(PO4)6(OH)2, Sr-HA) have been found to be favorable for bone repair.10–13 Sr also facilitates cell growth, proliferation and healing around the bone implants thus enhancing osteoblastic activity and bone formation in vivo.14,15 Additionally, 2% of alloying Sr brings Mg based alloys improved mechanical properties and reduced corrosion rates.16,17 Altogether, Mg–2Sr is an attractive candidate for biocompatible Mg based alloys implants.However, rapid corrosion leads to structural failure of implants before completing healing of host tissues.1,18–20 The aggregation of corrosion products such as hydrogen gas results in the formation of gas bubbles, which prolongs the healing process of bone tissues.21 The induced change of the physical environment disturbs implants' stability and mechanical integrity before the end of their service periods.
The reduced corrosion rate and local gas cavity may depend on the followings: purity, alloying and surface modification.2,22,23 Implants equipped with both sufficient mechanical properties and appropriate corrosion rates are expected via alloying firstly and coating subsequently. Hence, it is essential to seek an effective surface modification technology to provide a relatively uniform, dense, anti-corrosive and even bioactive coating on the selected Mg based alloy. Investigations24,25 have manifested that micro-arc oxidation (MAO) is a particularly prospective surface modification technology available for substrate strengthening and biocompatibility enhancing concerning electroplating,26 chemical conversion method,27 biomimetic approach,28 electrochemical deposition,29,30 anodizing31 etc. Particularly, MAO is well-known for its capacity of generating in situ grown porous and homogeneous oxide coatings metallurgically bond to the substrate with strong adhesion.32 MAO process can be controlled easily at room temperature and repeated on the substrate for multiple times.33 It requires less energy consumption at lower reaction temperature in alkalescent electrolytes, providing an environmental-friendly solution for surface treatment.34
The phases, microstructures, corrosion resistance, adhesion and degradation of MAO coatings are determined by substrate designing, electrical parameters and electrolyte recipe adjusting, respectively.22,35,36 During the process, electrolyte components could diffuse into the formed coating and then influence the coating growth mechanism.37 Given that the electrolyte recipe plays a vital role in determining the final performance of coatings. Additives incorporated into the electrolyte are beneficial to the MAO process by optimising microstructures of ceramic coatings to some extent. Micro-molecule additives including KF, NH4HF2, C3H8O3 and H2O2 have been studied on AZ91D and ZK60 alloys38,39 widely. However, macro-molecule additives such as poly(ethylene glycol) (PEG1000) are rarely investigated. PEG is water soluble and nontoxic, which is a potential green candidate for additives in electrolyte system. It has been applied widely in pharmaceutical, textile, cosmetic industry as lubricant, dispersant and softener. Besides, it is one of effective nonionic surfactants especially for reactions of the interface with functional –CH2–CH2–O– segments, which can accelerate or optimise reaction processes.40,41 In this study, PEG1000 additives are added into silicate electrolytes with gradient concentrations of 0 g L−1, 4 g L−1, 8 g L−1, 12 g L−1, 16 g L−1, which are referred as P0, P1, P2, P3 and P4, respectively in the following sections. The effects of PEG1000 on the performance of MAO coatings on Mg–2Sr surface are studied and the optimal concentration is also summarized.
2. Materials and methods
2.1. Substrate and coating preparation
Mg–2Sr was cast using commercial purity Mg (99.99%) and Mg–21Sr (99.99%) master alloy in an electronic resistance furnace under a protective atmosphere (SF6![[thin space (1/6-em)]](https://www.rsc.org/images/entities/char_2009.gif) :
:![[thin space (1/6-em)]](https://www.rsc.org/images/entities/char_2009.gif) CO2 = 1
CO2 = 1![[thin space (1/6-em)]](https://www.rsc.org/images/entities/char_2009.gif) :
:![[thin space (1/6-em)]](https://www.rsc.org/images/entities/char_2009.gif) 200). Raw materials and tools were preheated to 250 °C. Mg ingot was firstly melted at 700 °C. Mg–21Sr master alloys with the calculated quantity were then added at 710 °C along with a subsequent holding period of 20 min to ensure sufficient fusion. The dissolved melt was stirred uniformly before being poured into the preheated graphite mold. Lastly, Mg–2Sr alloy was cut into rectangular specimens with the size of 8 × 10 × 10 mm3 after homogenized at 400 °C for 16 h, which were mechanically polished with carborundum waterproof abrasive paper up to 1000 grit, degreased with acetone following by rinsing with distilled water and absolute ethyl alcohol, respectively before oxidation.
200). Raw materials and tools were preheated to 250 °C. Mg ingot was firstly melted at 700 °C. Mg–21Sr master alloys with the calculated quantity were then added at 710 °C along with a subsequent holding period of 20 min to ensure sufficient fusion. The dissolved melt was stirred uniformly before being poured into the preheated graphite mold. Lastly, Mg–2Sr alloy was cut into rectangular specimens with the size of 8 × 10 × 10 mm3 after homogenized at 400 °C for 16 h, which were mechanically polished with carborundum waterproof abrasive paper up to 1000 grit, degreased with acetone following by rinsing with distilled water and absolute ethyl alcohol, respectively before oxidation.
The electrolyte recipes containing calcium, phosphorus and silicon were prepared from the base electrolyte (15 g L−1 NaSiO3, 5 g L−1 KOH) and CaHPO4 (10 g L−1), NH4HF2 (7 g L−1), C3H8O3 (5 ml L−1), H2O2 (5 ml L−1) while PEG1000 of gradient concentrations aforementioned are incorporated in the end. All solutions were made from analytical grade reagents and distilled water. During the oxidation, the cleaned and dried specimens acted as an anode while the stainless steel container served as a cathode. The electrolyte temperature was controlled to be stable at 35 °C or lower by a modified cooling water circulating pump. MAO process was controlled to 15 min and electrical parameters are listed in detail (Table 1). Finally, MAO-coated samples were dried with a blower after rinsed in distilled water and absolute ethyl alcohol.
| Positive voltage (V) | Frequency (Hz) | Negative voltage (V) | Positive duty ratio (%) | Negative duty ratio (%) | Ratio of positive and negative pulse |
|---|---|---|---|---|---|
| 450 | 550 | 40 | 30 | 20 | 1![[thin space (1/6-em)]](https://www.rsc.org/images/entities/char_2009.gif) : :![[thin space (1/6-em)]](https://www.rsc.org/images/entities/char_2009.gif) 1 1 |
2.2. Coating characterization
Phase constitutions were studied by X-ray diffractometer (Dmax-2500, Rigaku) with Cu-Kα radiation at a scanning speed of 2° min−1 under the voltage of 40 kV and the current of 30 mA. Fourier transform infrared (FTIR) spectroscopy (Tensor-37, BRUKER, Germany) was used to analyze the functional groups with the resolution of 4 cm−1 and scanning period of 16 s. Scanning electron microscope (SEM, JSM-6380LA, Japan) and energy dispersive X-ray spectrometry (EDX, JED-2300, Japan) were performed to observe surface and cross-section morphologies as well as the compositions of coatings before and after degradation tests in SBF. MINITEST 600B FN2 microprocessor coating thickness gauge (Elektro-physik Koln, Germany) was utilized to measure the thicknesses of MAO coatings and the final values reported were the average of nine replicate measurements. Scratch test was carried out on a scratch tester (WS-2005, Lanzhou Institute of Chemical Physics, Chinese Academy of Sciences, Lanzhou, China). A maximum 20 N load was applied at a loading speed of 20 N min−1 at the speed of 3 mm min−1.2.3. Degradation and bioactivity assessment
MAO treated and untreated samples were immersed in SBF solution with ion concentrations almost equal to those in human blood plasma.42 The 1.0 SBF was prepared by dissolving the reagents of NaCl, NaHCO3, KCl, K2HPO4·3H2O, MgCl2·6H2O, 1.0 mol L−1 HCl, CaCl2 and Na2SO4 in distilled water at 36.5 ± 0.5 °C one by one according to the order above. Then pH was adjusted to 7.2–7.4 with trishydroxymethylaminomethane ((CH2OH)3CNH2) and hydrochloric acid at 36.5 °C.42 Each sample with 440 mm2 immersion area was soaked in a 60 ml plastic vial filled with 40 ml of SBF solution and placed in the thermostat water bath at 36.5 °C. The ratio of sample's surface area to SBF volume was 110 mm2![[thin space (1/6-em)]](https://www.rsc.org/images/entities/char_2009.gif) :
:![[thin space (1/6-em)]](https://www.rsc.org/images/entities/char_2009.gif) 10 ml and SBF solution was renewed every 2 days and kept colorless, stable without deposit during immersion for 1 day, 2 days, 7 days, 14 days, 21 days and 28 days. Samples were removed from the SBF and washed with distilled water after any immersion period.
10 ml and SBF solution was renewed every 2 days and kept colorless, stable without deposit during immersion for 1 day, 2 days, 7 days, 14 days, 21 days and 28 days. Samples were removed from the SBF and washed with distilled water after any immersion period.
2.4. Electrochemical corrosion behaviour
Potentiodynamic polarization tests were carried out on the substrate and MAO-coated samples by the electrochemical workstation (Princeton PARSTAT 2273, USA) in a 200 ml electrolyser with a typical three-electrode setup. Saturated calomel electrode (SCE) was used as the reference electrode while a platinum sheet acted as the counter electrode. The working electrode was wrapped with paraffin film leaving a 1.0 cm2 area in contact with corrosive SBF solution. The temperature was maintained at (36.5 ± 0.5) °C. The potential was scanned from −2500 mV to 0 V at a rate of 5 mV s−1 when the corrosion potential remained stable.3. Results
3.1. Phase analysis
3.2. Microstructure
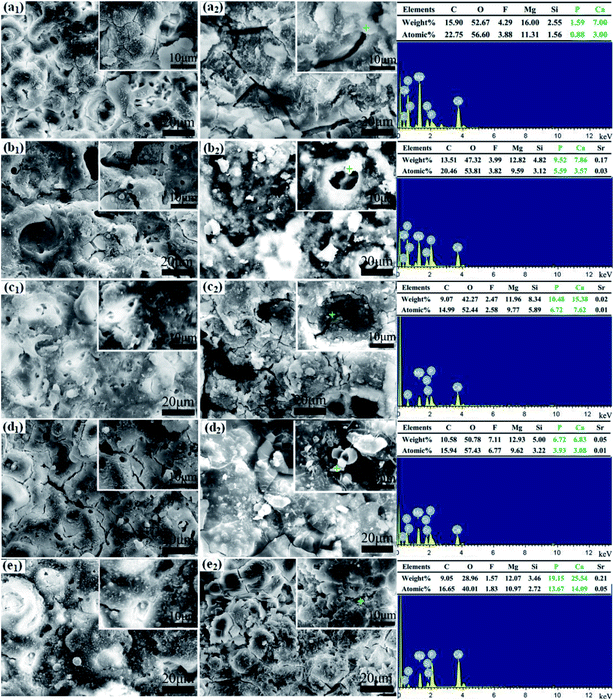
Chemical compositions of MAO coatings after SBF immersion for 7 days are given by EDS analysis. The results indicate that particles from corrosion products are consisted of C, Mg, F, O, Si, Ca and P. A trace of Sr can be detected except for the PEG1000-free coating. Interestingly, the contents of Ca and P in spherical and columned particles are higher than those in shell-like particles. In combination with XRD, FT-IR results, SEM morphologies and EDX, these Ca- and P-containing apatites are transformed from calcium phosphates after immersion. Calcium phosphate apatite is the only type of calcium phosphate crystal in calcified tissues such as bones, teeth, calcified cartilage, and cultured matrix produced by osteoblasts,52,53 which possesses good biocompatibility and osteoconductivity allowing the formation of bone on its surface.54,55 The excellent bioactivity of MAO coatings is proved by the formation of new bone-like apatites after 7 days' immersing.
3.3. Thickness, porosity and adhesion
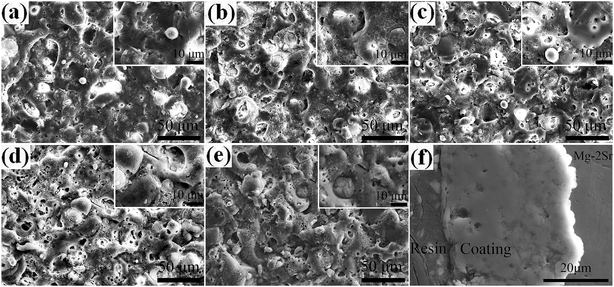
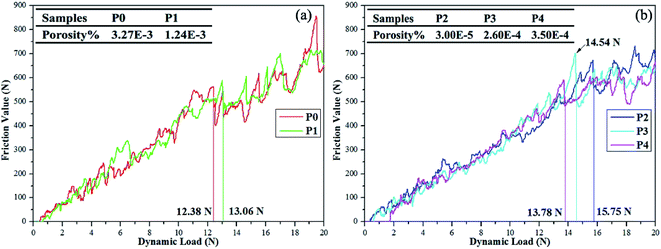
Measured thicknesses (X ± SD, SD refers to the standard deviation) of coatings P0 to P4 are 51.5 ± 2.2, 42.2 ± 2.4, 41.5 ± 2.2, 41.2 ± 1.8 and 39.0 ± 2.0 μm, respectively. Obviously, the thickness of coating P2 is consistent with that observed in the cross-section image in Fig. 3(f). Small differences are found among thicknesses except for the PEG1000-free coating with the largest value observed. The hydro soluble PEG1000 with certain viscosity may hinder the migration of ions in electrolytes and therefore reduce the ions exchange of the whole system, which can explain the results above reasonably. The coating adhesion can be defined as the dynamic load corresponding to the saltation of friction value. The dynamic loads of P0 to P4 are 12.38 N, 13.06 N, 15.75 N, 14.54 N and 13.78 N, respectively while the porosity is shown in the table embedded in Fig. 5. The dynamic load increases firstly then decreases while the porosity tends to be inverse according to increasing PEG1000 contents. Hereby, both the highest adhesion value and lowest porosity are achieved for the coating P2, which implies good adhesion and load-bearing capacity resulting from the metallurgical bonding between the substrate and coating. In a word, porosity is the leading point to dynamic adhesion compared to the thickness, which can be calculated from Stern–Geary equation56 and another equation proposed by Liu et al.57 via potentiodynamic polarization tests described in the follows:where, ba and bc are the anodic and cathodic Tafel slopes of the measured samples in the first formula while the F, Rpm, Rp, Ecorr and βa are the coating porosity, the polarization resistance of the substrate, the polarization resistance of the MAO coated samples, the difference of the corrosion potential between the coated and uncoated samples and the anodic Tafel slope of the uncoated sample, respectively.
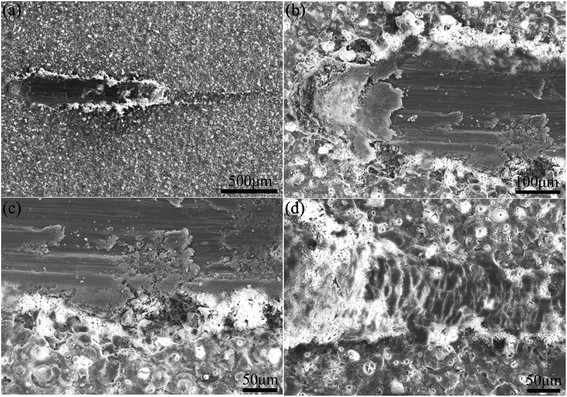
Fig. 6 demonstrates SEM images of scratched coatings prepared in the electrolyte containing 8 g L−1 PEG1000. According to Fig. 6(a), the external coating is clearly pressed to two sides by the indenter leaving a scratch track as expected. Additionally, Fig. 6(b) shows that the micro-pore structure is indeed apparent at the beginning and then disappears along with the extension of scratch. The coating is penetrated and the substrate is exposed to the air subsequently once saltation of friction value. Stratified spalling phenomenon is visible in the spalt area of the scratch from Fig. 6(c). The terminal of the scratch suggests a scaly structure without micro-pores owing to the movement of indenter as is shown in Fig. 6(d), where the substrate is protected by the coating from partly destruction.
3.4. Electrochemical corrosion behaviour and degradability
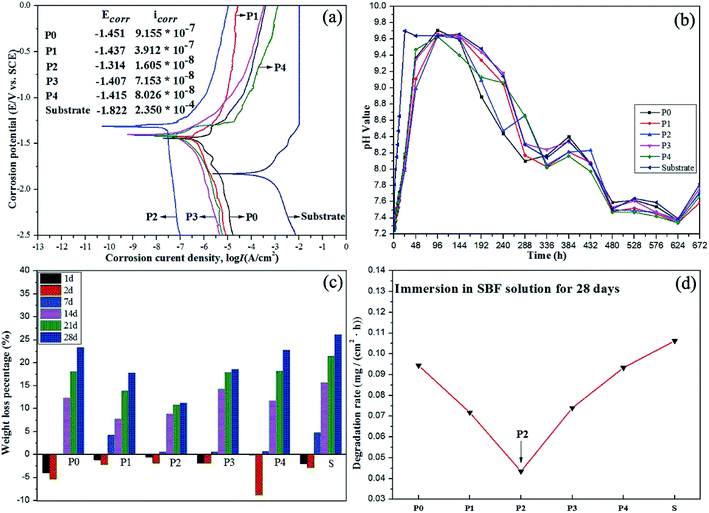
The corrosion resistance and degradability of the MAO coatings can be evaluated by electrochemical polarization curves, pH values, weight loss percentages and degradation rates, as shown in Fig. 7. In particular, corrosion resistance and apatite formation ability are susceptive factors for degradation rates of coatings since the dissolution of samples can be delayed or prevented by formation or growth of apatite-like layers.1,58 According to Fig. 7(a), the corrosion potential (Ecorr) of MAO coatings shifts positively by 0.37–0.41 V while the corrosion current density (Icorr) is three or four orders of magnitude lower than that of the substrate, which infers that the corrosion resistance of Mg–2Sr modified by the MAO with the introduction of PEG1000 is improved to a remarkable degree especially for the coating prepared in the 8 g L−1 PEG1000-incorporated electrolyte system. The corrosive components are able to invade the micro-pores or micro-cracks easily but fail to penetrate the inner compact layer, which reduces corrosion rates at the end. Fig. 7(b) draws a conclusion that the pH values increase with prolonged exposure to SBF in every 2 days. The line for coating P2 is smoother and reaches the maximum at the sixth day in SBF immersion while that of the substrate demonstrates an obvious fluctuation. After the same exposure time, the pH value of the SBF solution in which the substrate was immersed is relatively higher than those of the SBF solutions in which MAO-coated samples were immersed except for values of the twelfth day. Interestingly, the weight loss percentage of each sample is negative in the first two days and then increases gradually with further soaking as seen in Fig. 7(c), which means that a new layer was formed on the surfaces of samples and then dissolved into the corrosive SBF solution. For the MAO coatings, the expected phases of CaP apatites provides biocompatibility and bioactivity. From the substrate's point of view, weight increase percentages and lower loss percentages in the earlier stage support the implants' stability and mechanical integrity. The weight loss percentage of substrate is higher than those of MAO-coated samples in any exposure period. The highest weight loss percentage of the substrate reaches to 26.10% while coating P2 presents the lowest value of 11.22% after immersion for 28 days. The degradation rates of P0, P1, P2, P3, P4 and the substrate are calculated to 0.09443, 0.0718, 0.04349, 0.074, 0.09334 and 0.10626 mg (cm2 h)−1 respectively (Fig. 7(d)). MAO-coated samples exhibit much lower degradation rates and better electrochemical corrosion resistance, which implies that MAO coatings are favorable to enhance the corrosion resistance. The incorporation of 8 g L−1 PEG1000 into the electrolyte provides a further noticeable improvement.4. Discussion
Mg–2Sr alloys undergo a complex process relating to chemical, electrochemical, thermochemical and plasma reaction for MAO coating formation and growth. Mg–2Sr firstly dissolves in electrolyte system and then Mg2+, Sr2+ are released at the beginning of reaction when a thin layer of oxide film is formed.59 Oxygen bubbles on the surface of sample result from oxidation of OH− ions and H2O,60 which are absorbed on weak parts of the thin layer. Subsequently, the weak layer with the lowest resistance is broken down preferentially accompanied by spark discharge phenomenon. At this moment, coating thickness increases gradually mainly depending on the extensive migration of cations (Mg2+, Sr2+) and anions (O2−, SiO32−, PO42−) while modest breakdown occurs. Some bubbles are covered by the coatings, in which gases are pulled out because of the high pressure originating in discharge. Therefore, pores are left on the primary oxide coating surface and subsequently become discharge channels of microarc oxidation.61 At the end, the oxide film finishes growth process when setting voltage could not breakdown final coating along with sporadic spark appears in the local surface area.The microstructure, thickness, porosity and adhesive strength can be influenced by introducing nonionic surfactant PEG1000. It could adjust the electrolyte activity and then affect the ions exchange to alter the coating growth mechanism. Theoretically, –CH2–CH2–O– segments of the nonionic surfactant PEG1000 are absorbed on the surface of Mg–2Sr alloy with C atoms oriented toward the substrate surface and O atoms oriented toward the solution, which may promote arc discharge and optimise MAO process. With the help of C–C bond to accelerate electron transferring, stronger adhesion can be achieved in the interface between coating and substrate. MAO coating microstructure may also be smoother when modest PEG1000 is added in the electrolyte. Nevertheless, excessive –CH2–CH2–O– segments from hydro soluble PEG1000 with certain viscosity may hinder the migration of ions and reduce the electrical conductivity of the whole system to lead gradually reduced film thickness with increasing PEG1000 concentrations. Given that the outward migrated cations (Mg2+, Sr2+) are held back by intensive C atoms absorbed on the substrate and inward migrated anions (O2−, SiO32−, PO42−) fail to close to the cations for the hamper of –CH2–CH2–O– segments, resulting in loose coating textures with higher porosity and lower adhesion.
Electrochemical corrosion behaviour is influenced by thickness, porosity and cracks of MAO coating. The porous outer layer with micro-pores and micro-cracks cannot hold back the corrosive ions such as Cl−, but the dense inner layer is indeed hard to be invaded. Therefore, the electrochemical corrosion property is improved by MAO coatings to great extent because the substrate is free to be corroded by corrosive components, which can be verified by the remarkable low magnitude of corrosion current densities (Icorr) for MAO-coated samples compared to the substrate counterpart. It is necessary to adjust the thickness and microstructure of MAO coatings to enhance electrochemical corrosion resistance by incorporation of effective additives. Lower porosity not the thickness is the leading factor for excellent corrosion resistance for MAO-coated samples because continuously increasing thickness becomes invalid when the microstructure is relatively loose for increasing number of large pores and cracks. Furthermore, there is something associated between adhesion and corrosion resistance due to both of them are linked with porosity. Coatings with stronger adhesive strength tend to possess thicker inner layer and then be harder to be penetrated by corrosive ions, which indicates that improving adhesion is helpful to decrease corrosion current density. In conclusion, the coating P2 possesses the lowest electrochemical corrosion current (1.605 × 10⁻⁸ A cm−2) owing to its minimum porosity, maximum adhesive strength and relative dense successive microstructure.
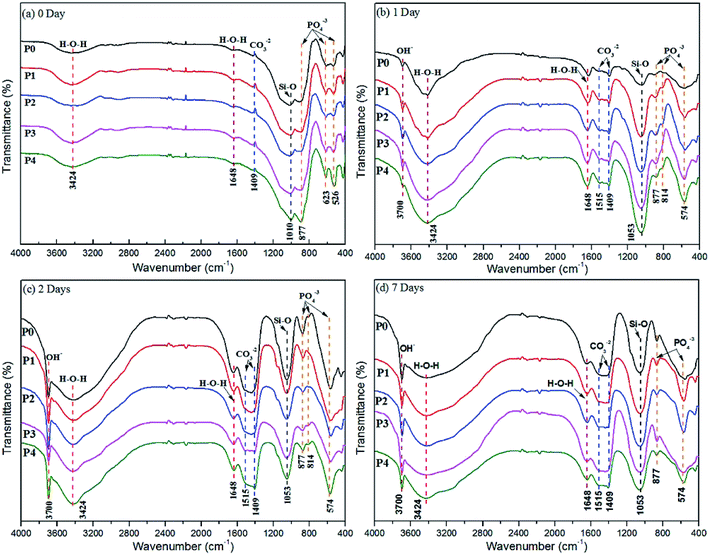
Degradation of coating is dependent on the period immersing in SBF solution for the balance movement between precipitation of calcium phosphates and dissolution of coating or even substrate. At the beginning stage, small part of dissolution occurs in the corrosive environment resulting from the dissolving of unstable phases such as water-soluble phase TCP. Also, SBF is a metastable calcium phosphate solution supersaturated with respect to bone-like apatites.62 Cl− ions in SBF accelerate hydrolysis of CaP phases (Ca3(PO4)2) and SrSiO3 to produce Ca2+, Sr2+, OH−, HPO42−, and PO43− ions and transformation of MgO and CaO into soluble Mg(Ca)Cl2 to increase ions concentration near the coating surface, which is beneficial to ions transferring and precipitation. In the next stage, the micro-pores, micro-cracks and dissolution areas at the beginning stage provide a large number of nucleation sites for HA, Sr-HA and Ca2P2O7. With further ions releasing and more nucleation sites valid, nucleation of HA, Sr-HA, Ca2P2O7 and other calcium phosphates is induced around the solution-coating interface, after which the nuclei spontaneously grow by quickly consuming Ca2+, Sr2+ and HPO42− from metastable supersaturated SBF solution. In the present work, the formation and growth of these calcium phosphates on samples' surface outweigh weight losses from coating dissolving especially for the immersion in the first two days. During the third stage, serious dissolution of coating damages the balance because the corrosive Cl− ions may penetrate the dissolved coating into the substrate. SBF solution can be directly contacted with Mg–2Sr alloy and then intensive corrosion begins, from which we can draw that the precipitating ability of calcium phosphates is limited to the corrosion resistance of the coating. As a result, weight lose percentages of coatings increase with longer immersion time.
5. Conclusion
Corrosion behaviours of MAO coatings prepared on Mg–2Sr alloy are influenced after inducing PEG1000 to electrolyte systems. The following conclusions can be drawn:(1) Biocompatible MAO coatings are formed successfully in five different electrolytes with similar thicknesses except for a thicker one formed in PEG1000-free electrolyte, which are mainly composed of Mg, MgO, CaO, SrSiO3, Sr2Mg17 and Ca3(PO4)2 regardless of the PEG1000 concentrations. Adhesive strength of the coatings is improved by the addition of PEG1000 to different degrees and the maximum value is obtained when 8 g L−1 PEG1000 is incorporated.
(2) Corrosion resistance behaviours and degradability are modified especially by PEG1000-incorporated MAO coatings due to its solubility and viscidity. The segments –CH2–CH2–O– of the nonionic surfactant PEG1000 are absorbed on the surface of Mg–2Sr alloy to promote arc discharge and ions exchange. The highest corrosion resistance and lowest degradation rate are also observed in the 8 g L−1 PEG1000-incorporated coatings.
(3) A new layer containing CaP apatites are formed on the surfaces of MAO coatings after soaking in the SBF solution, which is beneficial to improve the biocompatibility and bioactivity. Weight increase in the first two days and lower loss percentages support the implants' stability and mechanical integrity, which is essential to the healing and growth of the surrounding tissues. Altogether, the coating P2 exhibits lower porosity, higher adhesive strength, better apatite-inducing ability and slower degradation rate.
Conflicts of interest
There are no conflicts to declare.Acknowledgements
This work was financially supported by Shenzhen Strategic Emerging Industry Development Special Funds (Grant no. JCYJ20150626095244634).References
- J. Dou, G. Gu, C. Chen and Y. Pan, Characterization and biodegradation behavior of micro-arc oxidation coatings formed on Mg–Zn–Ca alloys in two different electrolytes, RSC Adv., 2016, 6, 104808–104818 RSC.
- M. P. Staiger, A. M. Pietak, J. Huadmai and G. Dias, Magnesium and its alloys as orthopedic biomaterials: a review, Biomaterials, 2006, 27, 1728–1734 CrossRef CAS PubMed.
- F. Witte, The history of biodegradable magnesium implants: a review, Acta Biomater., 2010, 6, 1680–1692 CrossRef CAS PubMed.
- T. V. Thamaraiselvi and S. Rajeswari, Biological evaluation of bioceramic materials: a Review, Trends Biomater Artif Organs., 2004, 18, 9–17 Search PubMed.
- J. Nagels, M. Stokdijk and P. M. Rozing, Stress shielding and bone resorption in shoulder arthroplasty, J Shoulder Elbow Surg., 2003, 12, 35–39 CrossRef PubMed.
- J. Vormann, Magnesium: nutrition and metabolism, Mol. Aspects Med., 2003, 24, 27–37 CrossRef CAS PubMed.
- H. Liu, Biodegradable metals and responsive biosensors for musculoskeletal applications, Nanotechnology Enabled In situ Sensors for Monitoring Health, Springer, New York, 2011, pp. 115–137 Search PubMed.
- M. Carboneras, M. C. García-Alonso and M. L. Escudero, Biodegradation kinetics of modified magnesium-based materials in cell culture medium, Corros. Sci., 2011, 53, 1433–1439 CrossRef CAS.
- P. J. Marie, Strontium as therapy for osteoporosis, Curr. Opin. Pharmacol., 2005, 5, 633–636 CrossRef CAS PubMed.
- M. Tian, F. Chen, W. Song, Y. Song, Y. Chen, C. Wan, X. Yu and X. Zhang, In vivo study of porous strontium-doped calcium polyphosphate scaffolds for bone substitute applications, J. Mater. Sci.: Mater. Med., 2009, 20, 1505–1512 CrossRef CAS PubMed.
- X. N. Gu, X. H. Xie, N. Li, Y. F. Zheng and L. Qin, In vitro and in vivo studies on a Mg–Sr binary alloy system developed as a new kind of biodegradable metal, Acta Biomater., 2012, 8, 2360–2374 CrossRef CAS PubMed.
- G. Dagang, X. Kewei and H. Yong, The influence of Sr doses on the in vitro biocompatibility and in vivo degradability of single-phase Sr-incorporated HAP cement, J. Biomed. Mater. Res., Part A, 2008, 86, 947–958 CrossRef PubMed.
- A. A. Gorustovich, T. Steimetz, R. L. Cabrini and J. M. Porto López, Osteoconductivity of strontium-doped bioactive glass particles: a histomorphometric study in rats, J. Biomed. Mater. Res., Part A, 2010, 92, 232–237 CrossRef PubMed.
- S. G. Dahl, P. Allain, P. J. Marie, Y. Mauras, G. Boivin, P. Ammann, Y. Tsouderos, P. D. Delmas and C. Christiansen, Incorporation and Distribution of Strontium in Bone, Bone, 2001, 28, 446–453 CrossRef CAS PubMed.
- P. J. Marie, P. Ammann, G. Boivin and C. Rey, Mechanisms of action and therapeutic potential of strontium in bone, Calcif. Tissue Int., 2001, 69, 121–129 CrossRef CAS PubMed.
- Y. Ding, C. Wen, P. Hodgson and Y. Li, Effects of alloying elements on the corrosion behavior and biocompatibility of biodegradable magnesium alloys: a review, J. Mater. Chem. B, 2014, 2, 1912–1933 RSC.
- Y. Fan, G. H. Wu and C. Q. Zhai, Effect of strontium on mechanical properties and corrosion resistance of AZ91D, Mater. Sci. Forum, 2007, 546–549, 567–570 CrossRef CAS.
- F. Witte, J. Fischer, J. Nellesen, C. Vogt, J. Vogt, T. Donath and F. Beckmann, In vivo corrosion and corrosion protection of magnesium alloy LAE442, Acta Biomater., 2010, 6, 1792–1799 CrossRef CAS PubMed.
- L. Choudhary and R. K. Singh Raman, Magnesium alloys as body implants: fracture mechanism under dynamic and static loadings in a physiological environment, Acta Biomater., 2012, 8, 916–923 CrossRef CAS PubMed.
- T. Kraus, S. F. Fischerauer, A. C. Hänzi, P. J. Uggowitzer, J. F. Löffler and A. M. Weinberg, Magnesium alloys for temporary implants in osteosynthesis: in vivo studies of their degradation and interaction with bone, Acta Biomater., 2012, 8, 1230–1238 CrossRef CAS PubMed.
- F. Witte, N. Hort, C. Vogt, S. Cohen, K. U. Kainer, R. Willumeit and F. Feyerabend, Degradable biomaterials based on magnesium corrosion, Curr. Opin. Solid State Mater. Sci., 2008, 12, 63–72 CrossRef CAS.
- Y. Ma, X. Nie, D. O. Northwood and H. Hu, Corrosion and erosion properties of silicate and phosphate coatings on magnesium, Thin Solid Films, 2004, 469–470, 472–477 CrossRef CAS.
- G. L. Song, Corrosion behavior and prevention strategies for magnesium (Mg) alloys, in Corrosion Prevention of Magnesium Alloys, Woodhead Publishing Limited Pastow, UK, 2013, pp. 3–65 Search PubMed.
- X. P. Zhang, Z. P. Zhao, F. M. Wu, Y. L. Wang and J. Wu, Corrosion and wear resistance of AZ91D magnesium alloy with and without micro-arc oxidation coating in Hank's solution, J. Mater. Sci., 2007, 42, 8523–8528 CrossRef CAS.
- H. Fukuda and Y. Matsumoto, Effects of Na2SiO3 on anodization of Mg–Al–Zn alloy in 3 M KOH solution, Corros. Sci., 2004, 46, 2135–2142 CrossRef CAS.
- H. Huo, Y. Li and F. Wang, Corrosion of AZ91D magnesium alloy with a chemical conversion coating and electroless nickel layer, Corros. Sci., 2004, 46, 1467–1477 CrossRef CAS.
- A. L. Rudd, B. B. Carmel and F. Mansfeld, The corrosion protection afforded by rare earth conversion coatings applied to magnesium, Corros. Sci., 2000, 42, 275–288 CrossRef CAS.
- X. Lu, Z. Zhao and Y. Leng, Biomimetic calcium phosphate coatings on nitric-acid-treated titanium surfaces, Mater. Sci. Eng. C., 2007, 27, 700–708 CrossRef CAS.
- Y. W. Song, D. Y. Shan and E. H. Han, Electrodeposition of hydroxyapatite coating on AZ91D magnesium alloy for biomaterial application, Mater. Lett., 2008, 62, 3276–3279 CrossRef CAS.
- C. Zhang, R. Zeng, R. Chen, C. Liu and J. Gao, Preparation of calcium phosphate coatings on Mg-1.0 Ca alloy, T. Nonferr. Metal Soc., 2010, 20(suppl. 2), s655–s659 CrossRef CAS.
- S. Mato, G. Alcala, P. Skeldon, G. E. Thompson, D. Masheder, H. Habazaki and K. Shimizu, High resistivity magnesium-rich layers and current instability in anodizing a Mg/Ta alloy, Corros. Sci., 2003, 45, 1779–1792 CrossRef CAS.
- J. Dou, Y. Chen, Y. Chi, H. Li, G. Gu and C. Chen, Preparation and characterizations of calcium-phosphate-silicon-containing coating on a Mg–Zn–Ca alloy by a two-step microarc oxidation, Phys. Chem. Chem. Phys., 2017, 19, 15110–15117 RSC.
- X. Li, G. Cheng, W. Xue, R. Zheng and Y. Cheng, Wear and corrosion resistant coatings formed by micro-arc oxidation on TiAl alloy, Mater. Chem. Phys., 2008, 107, 148–152 CrossRef CAS.
- S. Verdier, M. Boinet, S. Maximovitch and F. Dalard, Formation, structure and composition of anodic films on AM60 magnesium alloy obtained by DC plasma anodizing, Corros. Sci., 2005, 47, 1429–1444 CrossRef CAS.
- M. R. Bayati, A. Z. Moshfegh and F. Golestani-Fard, Effect of electrical parameters on morphology, chemical composition, and photoactivity of the nano-porous titania layers synthesized by pulse-micro-arc oxidation, Electrochim. Acta, 2010, 55, 2760–2766 CrossRef CAS.
- L. O. Snizhko, A. L. Yerokhin, A. Pilkington, N. L. Gurevina, D. O. Misnyankin, A. Leyland and A. Matthews, Anodic processes in plasma electrolytic oxidation of aluminium in alkaline solutions, Electrochim. Acta, 2004, 49, 2085–2095 CrossRef CAS.
- H. Luo, Q. Cai, B. Wei, B. Yu, D. Li, J. He and Z. Liu, Effect of (NaPO3)6 concentrations on corrosion resistance of plasma electrolytic oxidation coatings formed on AZ91D magnesium alloy, J. Alloys Compd., 2008, 464, 537–543 CrossRef CAS.
- Y. K. Pan, C. Z. Chen, D. G. Wang, X. Yu and Z. Q. Lin, Influence of additives on microstructure and property of micro-arc oxidized Mg–Si–O coatings, Ceram. Int., 2012, 38, 5527–5533 CrossRef CAS.
- D. Wu, X. Liu, K. Lu, Y. Zhang and H. Wang, Influence of C3H8O3 in the electrolyte on characteristics and corrosion resistance of the micro-arc oxidation coatings formed on AZ91D magnesium alloy surface, Appl. Surf. Sci., 2009, 255, 7115–7120 CrossRef CAS.
- Z. Y. He, B. Y. Chu, X. W. Wei, J. Li, E. Carl, X. R. Song, G. He, Y. M. Xie, Y. Q. Wei and Z. Y. Qi, Recent development of poly(ethylene glycol)-cholesterol conjugates as drug delivery systems, Int. J. Pharm., 2014, 469, 168–178 CrossRef CAS PubMed.
- K. Abe, K. Higashi, K. Watabe, A. Kobayashi, W. Limwikrant, K. Yamamoto and K. Moribe, Effects of the PEG molecular weight of a PEG-lipid and cholesterol on PEG chain flexibility on liposome surfaces, Colloids Surf., A, 2015, 474, 63–70 CrossRef CAS.
- T. Kokubo, Surface chemistry of bioactive glass-ceramics, J. Non-Cryst. Solids, 1990, 120, 138–151 CrossRef CAS.
- W. Cao and L. L. Hench, Bioactive materials, Ceram. Int., 1996, 22, 493–507 CrossRef CAS.
- L. L. Hench, Bioceramics: from concept to clinic, J. Am. Ceram. Soc., 1991, 74, 1487–1510 CrossRef CAS.
- M. Bornapour, N. Muja, D. Shum-Tim, M. Cerruti and M. Pekguleryuz, Biocompatibility and biodegradability of Mg–Sr alloys: the formation of Sr-substituted hydroxyapatite, Acta Biomater., 2013, 9, 5319–5330 CrossRef CAS PubMed.
- M. B. Kruger, Q. Williams and R. Jeanloz, Vibrational spectra of Mg(OH)2 and Ca(OH)2 under pressure, J. Chem. Phys., 1989, 91, 5910–5915 CrossRef CAS.
- D. Hennings and S. Schreinemacher, Characterization of hydrothermal barium titanate, J. Eur. Ceram. Soc., 1992, 9, 41–46 CrossRef CAS.
- M. J. Hernandez-Moreno, M. A. Ulibarri, J. L. Rendon and C. J. Serna, IR characteristics of hydrotalcite-like compounds, Phys. Chem. Miner., 1985, 12, 34–38 CAS.
- R. A. Nyquist and R. O. Kagel, Infrared Spectra of Inorganic Compounds, Handbook of infrared and Raman spectra of inorganic compounds and organic salts, Academic Press, 2012 Search PubMed.
- L. Müller and F. A. Müller, Preparation of SBF with different HCO3− content and its influence on the composition of biomimetic apatites, Acta Biomater., 2006, 2, 181–189 CrossRef PubMed.
- F. M. Labajos, V. Rives and M. A. Ulibarri, Effect of hydrothermal and thermal treatments on the physicochemical properties of Mg–Al hydrotalcite-like materials, J. Mater. Sci., 1992, 27, 1546–1552 CrossRef CAS.
- H. M. Kim, C. Rey and M. J. Glimcher, Isolation of calcium-phosphate crystals of bone by non-aqueous methods at low temperature, J. Bone Miner. Res., 1995, 10, 1589–1601 CrossRef CAS PubMed.
- M. Gregoire, I. Orly and J. Menanteau, The influence of calcium phosphate biomaterials on human bone cell activities. An in vitro approach, J. Biomed. Mater. Res., 1990, 24, 165–177 CrossRef CAS PubMed.
- H. S. Cheung and M. H. Haak, Growth of osteoblasts on porous calcium phosphate ceramic: an in vitro model for biocompatibility study, Biomaterials, 1989, 10, 63–67 CrossRef CAS PubMed.
- P. N. Galgut, I. M. Waite and S. Tinkler, Histological investigation of the tissue response to hydroxyapatite used as an implant material in periodontal treatment, Clin. Mater., 1990, 6, 105–121 CrossRef CAS PubMed.
- H. Duan, C. Yan and F. Wang, Effect of electrolyte additives on performance of plasma electrolytic oxidation films formed on magnesium alloy AZ91D, Electrochim. Acta, 2007, 52, 3785–3793 CrossRef CAS.
- C. Liu, Q. Bi, A. Leyland and A. Matthews, An electrochemical impedance spectroscopy study of the corrosion behaviour of PVD coated steels in 0.5 N NaCl aqueous solution: part II: EIS interpretation of corrosion behavior, Corros. Sci., 2003, 45, 1257–1273 CrossRef CAS.
- J. Ma, C. Z. Chen, D. G. Wang, Y. Jiao and J. Z. Shi, Effect of magnesia on the degradability and bioactivity of sol–gel derived SiO2–CaO–MgO–P2O5 system glasses, Colloids Surf., B, 2010, 81, 87–95 CrossRef CAS PubMed.
- Y. K. Pan, C. Z. Chen, D. G. Wang, X. Yu and Z. Q. Lin, Influence of additives on microstructure and property of microarc oxidized Mg–Si–O coatings, Ceram. Int., 2012, 38, 5527–5533 CrossRef CAS.
- H. F. Guo, M. Z. An, S. Xu and H. B. Huo, Formation of oxygen bubbles and its influence on current efficiency in micro-arc oxidation process of AZ91D magnesium alloy, Thin Solid Films, 2005, 485, 53–58 CrossRef CAS.
- Y. K. Pan, C. Z. Chen, D. G. Wang and T. G. Zhao, Improvement of corrosion and biological properties of microarc oxidized coatings on Mg–Zn–Zr alloy by optimizing negative power density parameters, Colloids Surf., B, 2014, 113, 421–428 CrossRef CAS PubMed.
- Y. K. Pan, C. Z. Chen, D. G. Wang and X. Yu, Microstructure and biological properties of micro-arc oxidation coatings on ZK60 magnesium alloy, J. Biomed. Mater. Res., Part B, 2012, 100B, 1574–1586 CrossRef CAS PubMed.
| This journal is © The Royal Society of Chemistry 2018 |

