 Open Access Article
Polarization behavior of Pb–Co powder-pressed alloy for electrowinning
Shuai Wang,
Xiang-Yang Zhou,
Chi-Yuan Ma,
Bo Long,
Hui Wang and
Juan Yang *
*
School of Metallurgy and Environment, Central South University, Lushan South Street 932, Yuelu District, Changsha, 410083, China. E-mail: j-yang@csu.edu.cn; Fax: +86-73188836329; Tel: +86-73188836329
First published on 16th April 2018
Abstract
In this study, Pb–Co powder-pressed alloy was fabricated and used as a suitable anode material to replace Pb–Ca–Sn alloy in electrowinning. The Pb–Co anodes and the traditional Pb–Ca–Sn alloy on the electrochemical properties are investigated in a 160 g L−1 H2SO4 solution at 35 °C using galvanostatic polarization, electrochemical impedance spectroscopy and Tafel test. Thereafter, the anodic oxide layer is observed by energy dispersive X-ray spectroscopy along with scanning electron microscopy and X-ray diffractometry. The results show that the potential and oxygen evolution over-potential of the anodes exhibit a declining trend with increasing the fraction of Co. The anode potential of the Pb-2 wt% Co is approximately 170 mV lower than that of Pb–Ca–Sn alloy and reaches a stable value of 1.291 V at 35 °C, which shows good electrocatalytic performance and commercial application prospect.
1. Introduction
Electrowinning (EW) is one of the oldest industrial processes, whose importance lies in the final reduction of metals such as zinc, copper and manganese.1 About 80% of the world zinc production and 20% copper are manufactured by this technique.2,3At present, the Pb–Ca–Sn (for copper) and Pb–Ag (for zinc) alloys have been widely used as insoluble anode for oxygen evolution in EW, but it also has some limitations such as high power consumption due to the high oxygen evolution over-potential (OEOP), high manufacturing cost, unsatisfied mechanical strength and corrosion resistance.4–7 In addition, for the Pb–Ag anodes, oxygen evolution reaction (OER) occurs preferentially on the Ag2O2 sites on the anode surface,8 causing the consumption of Ag. Meanwhile, various ternary alloys and quaternary alloys have been researched, but so far only Pb–Ag–Sn–Co alloy presents relatively good corrosion resistance and oxygen evolution activity.9–12 Unfortunately, the process control and complex manufacturing operation limit its application in the electrochemical industry.
There are some new discoveries in the modification of lead-based anode, including the preparation methods of Pb–Ag composite anode and the exploration of Pb–MnO2 composite materials. For instance, the creep resistance, OEOP and current efficiency of Pb–Ag anode, which prepared by powder rolling method, were investigated.13 The results show that the creep resistance and the mount of Pb impurity in the deposited zinc of the Pb–Ag power-rolled alloy have better performance than those of Pb–Ag cast-rolled alloy. In the latest studies, the electrochemical property and corrosion behavior of Pb–MnO2 anode fabricated by powder pressing were systematically studied in sulfuric acid electrolyte solutions.14,15 Compared with the traditional Pb–Ag alloy anode, the Pb–MnO2 composite anodes exhibit lower OEOR at lower content of MnO2 (1–7 wt%)16 and better corrosion resistance at higher content of MnO2(10–20 wt%),17 respectively.
Ti based dimensionally stable anodes (DSA), which have been broadly used in not only EW but also other industrial applications such as an active anode materials for Li-ion batteries, super capacitor,18 titanium skeleton and organs for medical supplies, and chloride-alkaline industry owing to its high conductivity, low OEOP and good environment stability.19–22 Various kinds of Ti based noble metallic oxide anodes, such as IrO2 + ZrO2, IrO2 + TiO2, RuO2 + Ta2O5, IrO2 + Ta2O5 and IrO2 + Nb2O5, have been reported to present long service life in acidic media and high electrocatalytic activity.23–26 It is well known in the industry that the OER proceeds not on the metal surface but on one already covered with a layer of metallic oxide. With increasing the electrolysis time, however, the insulating TiO2 layer between Ti substrate and noble metallic oxide layer becomes more and more thick.27 Thus, the anode potential and the resistance increase rapidly, resulting in anode deactivation. Overall, considering the cost and the availability of the noble metal, these anodes have not yet been applied as suitable alternative electrode material for lead-based anode used in EW.
Therefore, looking for low OEOP and high-performance alloy element to replace traditional anodes is still the focus of the researchers. Cobalt can effectively reduce the OEOP and the corrosion rate of lead-based anode.28 However, to our best knowledge, there is few report on Pb–Co alloy applied to the OER of electrocatalysis material, due to the fact that lead and cobalt can not form a binary alloy.29 Pb–Co composite anode, prepared by powder pressing method, performs good properties in aqueous sulfuric acid solution, and it can be served as an alternative insoluble anode for copper EW. Nonetheless, these studies are only focused on researching the corrosion resistance and potential of the anode,30,31 as well as lacking of systematic research in oxygen evolution mechanism. In the present research, the oxygen evolution kinetic and the faradaic impedance of Pb–Co anodes with different Co fractions were investigated and compared to those of the Pb–Ca–Sn anode using electrochemical techniques. The microstructure morphology and composition of anodes layer were characterized by scanning electron microscope (SEM) and X-ray diffraction (XRD), respectively.
2. Experimental
2.1 Sample preparation
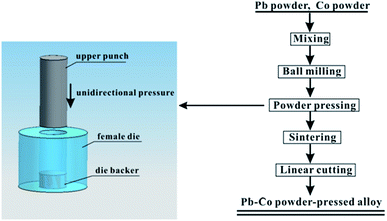
Pb powder was mixed with Co powder to a series of composition of 0.5 wt%, 1 wt% and 2 wt%, subsequently ball milled (mechanical alloying) for 10 h in a agate jar. The powder was then uniaxially die-compacted using a pressure of 300 MPa. The diagrammatic sketch of the mould and the flowchart of experimental process are shown in Fig. 1.The samples were in argon atmosphere, undergoing a heating process of (i) heating to 300 °C at 3 °C min−1, (ii) keeping at 300 °C for 3 h, (iii) natural cooling to room temperature. The obtained Pb–Co alloy was cut into cubic samples (10 mm × 10 mm × 5 mm) using a wire-cut machine. Finally, Pb-0.5 wt% Co, Pb-1 wt% Co, Pb-2 wt% Co and Pb-0.06 wt% Ca-0.49 wt% Sn cast-rolled alloy were connected to a plastic isolated copper wire and coated by denture base resins with a working area of 10 mm × 10 mm. Before being introduced into the electrolyte, the working surface of all the samples was polished by SiC abrasive paper.
2.2 Measurements
The testing was executed by PARSTAT 4000 electrochemical workstation, which ensured that the testing procedure for every sample was identical. The counter and reference electrodes were a platinum plate and a Hg, Hg2SO4/sat·K2SO4 electrode (MSE), respectively. All potentials are given with respect to the Hg/Hg2SO4 (0.64 V versus SHE) reference electrode. The distance between the working electrode and the counter electrode was fixed at 3 cm. All the experiments were repeated two times.Galvanostatic electrolysis at 50 mA cm−2 for 72 h was conducted in a 160 g L−1 H2SO4 solution to produce an oxide layer on the surface of the anodes. The electrochemical impedance spectroscopy (EIS) was performed by applying an AC amplitude of 10 mV root mean squared in the 100 kHz to 10 mHz frequency range, and the applied potential was 1.3 V. Anodic polarization curves (LSV) was obtained at a constant scan rate of 5 mV s−1, from 1.1 V to 1.7 V. Cyclic voltammetry (CV) test was performed over the −1.2 V to +1.9 V potential range at a scanning rate of 20 mV s−1.
After galvanostatic electrolysis, the anodes were taken out from electrolyte, washed with deionized water and dried for 72 h at room temperature. Then, the microscopic surface morphology, element distribution and phase composition of anodic layers were investigated by SEM equipped with energy dispersive X-ray spectroscopy (EDS, Quanta FEG250, American) and XRD (Rigaku-TTRIII, Japan), respectively.
3. Results and discussion
3.1 Galvanostatic polarisation investigations
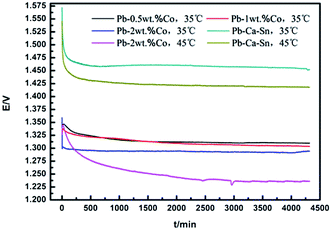
Galvanostatic polarization test is conducted to confirm the anodic potential as a function of the time. Fig. 2 shows the galvanostatic polarization curves of the Pb–Co anodes with different fractions and Pb–Ca–Sn anode in 160 g L−1 sulfuric acid solution.For Pb–Co anodes, the anode potential in general rapidly decreases, then slightly increases and decreases rapidly until leveled off. Moreover, the anodic potential of Pb–Co shows a peak at around 2000 s, which corresponds to oxidation of PbSO4 to PbO2 on the anode surface. But for the Pb–Ca–Sn anode, there is not the obvious oxidation reaction. With the electrolysis time increasing, PbSO4 is coverted into PbO2, the layer resistance of the anode decreases, and OEOP of the anode reduces. When the generation (Pb → PbSO4 and PbSO4 → PbO2) and the decomposition (the corrosion and the OER on the anode surface) of anode layer reach equilibrium, the content of oxide layer components and anodic potential become stable. In addition, when PbO2 translates into PbSO4, an increase of molar volume is expected, in turn, cracks appear on the anode surface.32
It can be seen from the figure that the anodic potential of Pb–Co is greatly lower than that of the Pb–Ca–Sn alloy throughout the entire 72 h galvanostatic polarisation experiment. This is due to the electrode reaction occurs not only on the anode surface but also in the pores for the Pb–Co. Besides, the anode potential of the Pb–Ca–Sn are about 155 mV and 190 mV higher than those of Pb-2 wt% Co at 35 °C and 45 °C, respectively, indicating that Co and increasing temperature facilitate the OER. This observation may be due to the electrocatalysis of Co, which is helpful in promoting anion adsorption and OER as well as enhancing the conductivity of the PbO2 layer.33,34 As everyone knows, low anodic potential is an important property, it will save a lot of energy and resources, if the anode can reach a steady low anodic potential state as soon as possible. Therefore, the Pb–Co composite anode is easier to reduce the energy consumption and cost than Pb–Ca–Sn alloy.
In general, the potential decreases slightly with the fraction of Co increasing in the whole electrolysis process. With the increase of electrolysis time, the anode potential of the Pb-0.5 wt% Co is higher than that of Pb-1 wt% Co, the anode potential of the Pb-2 wt% Co is approximately 25 mV lower than that of Pb-0.5 wt% Co and reach a stable value of 1.291 V at 35 °C. The different anodic potentials may be explained by the difference in specific surface area of the anodes, directly related to the effective current density in the electrolysis process. In other words, the various effective current density (below or equal to 50 mA cm−2) probably produce the difference in the anode potential.35 This claim can be proved by SEM. However, it is also possible that increasing Co content is similar to increasing Co2+ in electrolyte,33 thereby decreasing anode potential.
In this study, however, with the increase of Co content (above 2 wt%), crack and faultage appear on the anode surface and the longitudinal section, leading to the failure of the anode.
3.2 Morphology and phase composition of anodic oxide layer
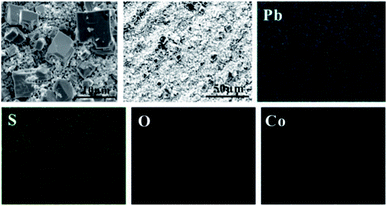
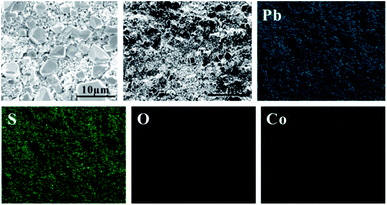
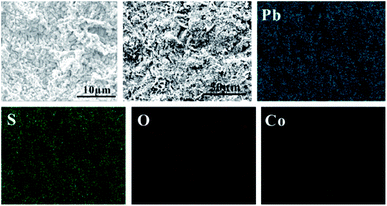
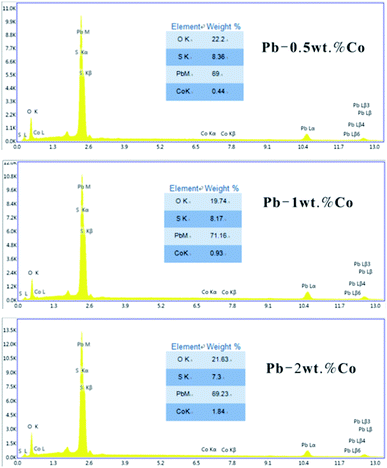
In order to study the corrosion behavior and film characteristics of the anodes, SEM and XRD are conducted to evaluate the microscopic surface morphology and phase composition of anodic oxide layer after galvanostatic polarization. Besides, the element distribution of anodic surface corrosion layer is performed by EDS mapping.EDS mapping, SEM and XRD of the anodic oxide layers are presented in Fig. 3–6. According to the EDS mapping results, O, S, Pb and Co evenly distribute on the Pb–Co oxide layers, while the content of Co is relatively low. It is clear that increasing the fraction of Co from 0.5 wt% to 2 wt% leads to a significant modification of the anodic layer structure. For the Pb-0.5 wt% Co, the oxide layer is mainly composed of square structure and presents the largest grain size. At the same time, from Fig. 3, irregular large-grained structure are shown on the surface of Pb-1 wt% Co oxide layer. As to the Pb-2 wt% Co, the morphology of the oxide layer changes significantly: it presents a large number of fine crystal grain and possesses the best regular structure among the three Pb–Co anodes. In fact, the average crystal grain size of Pb–Co decreases with increasing the fraction of Co, and the high content of Co is prone to form a compact surface film. This behavior inhibits the grain further growth, and then need more nucleation points for grain to nucleate, eventually forms a large sum of small fine grain.
As we know, EDS is used to determine the distribution of elements while XRD measurements confirm the specific phase composition.
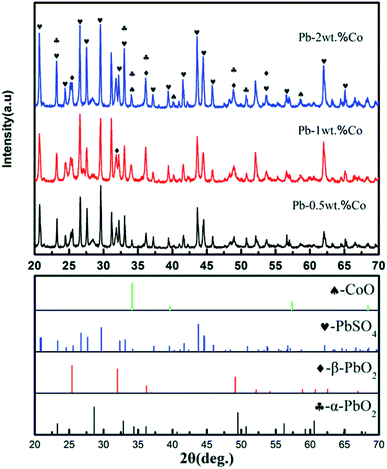
Based on XRD results, the Pb–Co anodic oxide layers are mainly composed of PbSO4, α-PbO2, β-PbO2 and CoO.36 However, the peak intensity of these phases varies with increasing the fraction of Co. As shown in Fig. 7, the peak intensity of PbSO4 and α-PbO2 decreases, then slightly increases when the fraction of Co increases from 0.5 wt% to 2 wt%. While, with the increase of Co content, the peak intensity of β-PbO2 and CoO presents a rising trend, which corresponding to the results of the Co of the EDS mapping. To sum up, Pb-2 wt% Co demonstrates the highest of the content of β-PbO2 and CoO. According to the corresponding references and experimental data,37,38 it is confirmed that α-PbO2, β-PbO2 as well as Co promote the activity of OER. Therefore, Pb-2 wt% Co presents the lowest the anode potential from the Fig. 2.
3.3 EIS characterizations
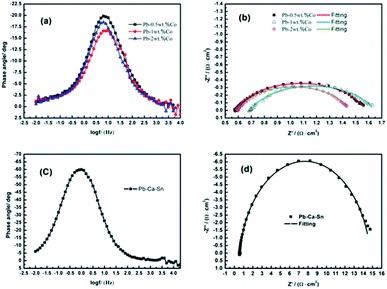
EIS is used to investigate the electrochemical reaction occurred on the anodic layer during the EW process.Fig. 8 depicts the alteration of the EIS of Pb–Co anodes with various Co fractions and Pb–Ca–Sn alloy at 1.3 V where the stable rate of O2 is occurring, corresponding to the galvanostatic polarization curves in Fig. 2. It is clear seen from the Fig. 8(a) and (c) that the phase plots of all the anodes exhibit one peak, which represents only one time constant in the EIS. Moreover, from the Fig. 8(b) and (d), only a single capacitance arc can be observed in the whole OER frequency domain, indicating that the electrode reaction mechanism does not change with different anodes.39 The impedances of the Pb–Co anodes are significantly smaller than that of Pb–Ca–Sn alloy, indicating that Co can promote the electrode reaction.
Because of the anodic polarization behavior and the result of EIS plots, the constant phase element (CPE) should be used as double layer capacitance (non-ideal capacitor) instead of the pure capacitance (C). Thus, the equivalent circuit (Fig. 9) can be simulate the electro-chemical process of the OER,40 and the values of the component parameters are shown in Table 1. Where Rs represents the solution resistance between the reference and working electrodes, and Rt is the charge transfer resistance of the anode reaction. The fitting-plots and parameters are displayed in Fig. 8 (the lines) and Table 1, respectively. Besides, the experimental (spots) and fitting (lines) data are in agreement with each other.
| Anodes | Rs (Ω cm2) | Rt (Ω cm2) | 102 Q (Ω−1 cm−2 sn) | n | Cdl (μF cm−2) |
|---|---|---|---|---|---|
| Pb-0.5 wt% Co | 0.576 | 1.005 | 7.973 | 0.785 | 30![[thin space (1/6-em)]](https://www.rsc.org/images/entities/char_2009.gif) 204.89 204.89 |
| Pb-1 wt% Co | 0.691 | 0.954 | 8.114 | 0.754 | 26![[thin space (1/6-em)]](https://www.rsc.org/images/entities/char_2009.gif) 604.41 604.41 |
| Pb-2 wt% Co | 0.595 | 0.857 | 8.949 | 0.800 | 37![[thin space (1/6-em)]](https://www.rsc.org/images/entities/char_2009.gif) 594.11 594.11 |
| Pb–Ca–Sn | 0.547 | 14.22 | 7.92 | 0.899 | 55![[thin space (1/6-em)]](https://www.rsc.org/images/entities/char_2009.gif) 424.77 424.77 |
Therefore, the double-layer capacitance, Cdl, can be calculated from the eqn (1), and n represents the deviation from the perfect capacitors. In Table 1, as a result of n is not close to 1, the Cdl can't replace the CPE in the equivalent circuit.41
| Q = (Cdl)n[(Rs)−1 + (Rt)−1](1−n) | (1) |
As demonstrated in Table 1, the Rt of Pb–Co is about 1 Ω cm2, while the value of Pb–Ca–Sn reaches 14.22 Ω cm2, which is much higher than that of Pb–Co. The difference can be explained that Co is prone to facilitate the charge transport in the electrolyte and thus result in a much lower Rt. While the Cdl of Pb–Ca–Sn alloy, possesses stable surface area, is higher than the value of Pb–Co, meaning that the higher Cdlof Pb–Ca–Sn alloy hinders the mass transport in the process of EW.
With increasing the fraction of Co, Rt decreases slightly, which causes the decrease of the anode potential on the galvanostatic polarization curves (Fig. 2). According to the expression of Schmachtel,14 charge transport could affect the electrochemical behavior of the anodes, which includes the kinetics and thermodynamics of OER. As to the OER (2H2O → O2 + 4H+ + 4e−), a low Rt benefits for the movement of H+, and then facilitates the evolution of oxygen. Thus, Co can enhance the charge transport and increases the number of active sites, then the activation energy and potential of the OER decrease. The results of Rt and Cdl are together consistent with the anodic potential of different anodes.
3.4 Tafel curves and kinetic parameters for oxygen evolution
EIS provides affluent information at low potential while the Tafel technique is widely used to research the mechanism of OER taking place on the anodes surface at high over-potential.On the basis of Yang's expression, the OEOP, η, is calculated by the following formula42:
| η = E + 0.64 − 1.229 − iRs | (2) |
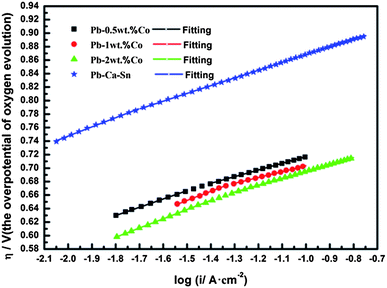
Based on the high anode potential applied in industry, the exchange current density (i0) of the Pb–Co and Pb–Ca–Sn are calculated when η = 0. Thus, the slopes b and i0 are shown in Table 2.
| Anode | b1 (mV dec−1) | b2 (mV dec−1) | η (i = 0.05 A cm−2)/V | i0/(A cm−2) |
|---|---|---|---|---|
| Pb-0.5 wt% Co | 122.7 | 98.8 | 0.687 | 5.487 × 10⁻⁹ |
| Pb-1 wt% Co | 135.2 | 86.7 | 0.677 | 7.738 × 10⁻¹⁰ |
| Pb-2 wt% Co | 136.7 | 102.3 | 0.664 | 1.6 × 10⁻⁸ |
| Pb–Ca–Sn | 136.6 | 115.0 | 0.834 | 2.808 × 10⁻⁹ |
Fig. 10 shows the Tafel curves of the OEOP of Pb–Co and Pb–Ca–Sn anodes in a 160 g L−1 H2SO4 solution at 35 °C after galvanostatic polarization. In Table 2, the exchange current density, i0, are extremely small and can be considered meaningless in evaluating the electrocatalytic activity of anode materials due to the high OEOP. As can be clearly seen, the OEOP of Pb–Co is much lower than that of Pb–Ca–Sn alloy, besides, this effect is more obvious with increasing the fraction of Co. In brief, the order of the OEOP of the anodes at the current density of 500 A m−2 is as follows: Pb–Ca–Sn alloy (0.834 V) > Pb-0.5 wt% Co (0.687 V) > Pb-1 wt% Co (0.677 V) > Pb-2 wt% Co (0.664 V). The results may be because Co is beneficial to enhance the depolarization of anodes and increases the OER rate.34 Like Ag promoting the generation of PbO2 layer, Co also can be served as a catalyst which affects the electrochemical characteristics of the PbSO4/PbO2.43,44
For the Pb–Co anodes, the mechanism of OER can be shown in the following equations 30:
Co2+ ![[left over right harpoons]](https://www.rsc.org/images/entities/char_21cb.gif) Co3+ + e Co3+ + e
| (3) |
Co3+ + OH− ![[left over right harpoons]](https://www.rsc.org/images/entities/char_21cb.gif) CoOH2+ CoOH2+
| (4) |
2CoOH2+ ![[left over right harpoons]](https://www.rsc.org/images/entities/char_21cb.gif) 2Co2+ + H2O + O 2Co2+ + H2O + O
| (5) |
O + O ![[left over right harpoons]](https://www.rsc.org/images/entities/char_21cb.gif) O2 O2
| (6) |
As can be seen from Fig. 10, all the anodes show double Tafel slopes in the whole potential region. Furthermore, from Table 2, the different anodes often lead to the different Tafel slope values. Generally speaking, the first slope is due to the oxidation reaction of PbSO4 → PbO2 and the low extent of OER, while the second slope is mainly attributed to the OER on the anodes surface as well as in the pores of anodes.45 To be precise, the Tafel slope of Pb–Co with different fraction of Co is similar, but lower than that of Pb–Ca–Sn alloy. This may be due to Co promotes the charge transfer and the OER rate. Since both PbO2 layer and Co active sites are electrocatalytic area on the surface of Pb–Co, thus, the incremental active sites is more helpful in enhancing the rate of OER. In other words, compared with the Pb–Ca–Sn which is widely used in hydrometallurgy, the Pb–Co save a lot of energy meaning that the product cost decrease in the actual production.
4. Conclusions
In this study, the Pb–Co powder-pressed alloy with different fraction of Co (0.5 wt%, 1 wt% and 2 wt%) are prepared and may be a promising insoluble anode having an excellent property for hydrometallurgy.After galvanostatic polarization electrolysis for 72 h at 35 °C, the anode potential of Pb-2 wt% Co are about 170 mV lower than that of Pb–Ca–Sn alloy. With increasing the fraction of Co, the crystal grain size and surface gradually become finer and coarser, respectively. The results are consistent with the values of oxygen evolution over-potential of the anodes. Furthermore, the peak intensity of α-PbO2, β-PbO2 and CoO presents a rising trend.
The charge transfer resistance and the oxygen evolution over-potential mainly present a declining trend with increasing the fraction of Co. It can be explained that Co is beneficial to enhance the depolarization effect of anodes and increases the OER rate.
Conflicts of interest
There are no conflicts to declare.Acknowledgements
This study was supported by the National Nature Science Foundation of China (Grant no. 51274240), Hunan natural science fund project (2017JJ2319), and Guangdong Jiana Energy Technology Co., Ltd-Central South University Joint Research Foundation of China (YNJJ2016012).References
- A. Biswal, B. Chandra Tripathy, K. Sanjay, T. Subbaiah and M. Minakshi, RSC Adv., 2015, 5, 58255–58283 RSC.
- P. E. Tsakiridis, P. Oustadakis, A. Katsiapi and S. Agatzini-Leonardou, J. Hazard. Mater., 2010, 179, 8–14 CrossRef CAS PubMed.
- M. Clancy, C. J. Bettles, A. Stuart and N. Birbilis, Hydrometallurgy, 2013, 131–132, 144–157 CrossRef CAS.
- Y. Q. Lai, Y. Li, L. X. Jiang, X. J. Lv, J. Li and Y. X. Liu, Hydrometallurgy, 2012, 115–116, 64–70 CrossRef CAS.
- A. M. Lafront, W. Zhang, E. Ghali and G. Houlachi, Electrochim. Acta, 2010, 55, 6665–6675 CrossRef CAS.
- P. Zhan, R.-d. Xu, L.-p. Huang, B.-m. Chen and J.-f. Zhou, Trans. Nonferrous Met. Soc. China, 2012, 22, 1693–1700 CrossRef CAS.
- W. Zhang and G. Houlachi, Hydrometallurgy, 2010, 104, 129–135 CrossRef CAS.
- J. J. McGinnity and M. J. Nicol, Hydrometallurgy, 2014, 144–145, 133–139 CrossRef CAS.
- A. Felder and R. D. Prengaman, JOM, 2006, 58, 28–31 CrossRef CAS.
- H.-T. Liu, J. Yang, H.-H. Liang, J.-H. Zhuang and W.-F. Zhou, J. Power Sources, 2001, 93, 230–233 CrossRef CAS.
- A. N. Nikoloski and M. J. Nicol, Miner. Process. Extr. Metall. Rev., 2009, 31, 30–57 CrossRef.
- Y. Lai, L. Jiang, J. Li, S. Zhong, X. Lü, H. Peng and Y. Liu, Hydrometallurgy, 2010, 102, 73–80 CrossRef CAS.
- M. Taguchi, H. Takahashi, M. Nagai, T. Aichi and R. Sato, Hydrometallurgy, 2013, 136, 78–84 CrossRef CAS.
- S. Schmachtel, M. Toiminen, K. Kontturi, O. Forsén and M. H. Barker, J. Appl. Electrochem., 2009, 39, 1835–1848 CrossRef CAS.
- S. Schmachtel, S. E. Pust, K. Kontturi, O. Forsén and G. Wittstock, J. Appl. Electrochem., 2009, 40, 581–592 CrossRef.
- R. Ma, S. Cheng, X. Zhang, S. Li, Z. Liu and X. Li, Hydrometallurgy, 2016, 159, 6–11 CrossRef CAS.
- M. Mohammadi and A. Alfantazi, Hydrometallurgy, 2016, 159, 28–39 CrossRef CAS.
- M. Manickam, P. Singh, T. B. Issa and S. Thurgate, J. Appl. Electrochem., 2006, 36, 599–602 CrossRef CAS.
- G.-N. Zhu, Y.-G. Wang and Y.-Y. Xia, Energy Environ. Sci., 2012, 5, 6652 CAS.
- N. Yu and L. Gao, Electrochem. Commun., 2009, 11, 220–222 CrossRef CAS.
- N. T. C. Oliveira, A. C. Guastaldi, S. Piazza and C. Sunseri, Electrochim. Acta, 2009, 54, 1395–1402 CrossRef CAS.
- W. Zhang, M. Robichaud, E. Ghali and G. Houlachi, Trans. Nonferrous Met. Soc. China, 2016, 26, 589–598 CrossRef CAS.
- L. Cifuentes, A. Montes and G. Crisóstomo, Corros. Eng., Sci. Technol., 2013, 46, 737–744 CrossRef.
- J. Ribeiro, M. S. Moats and A. R. De Andrade, J. Appl. Electrochem., 2008, 38, 767–775 CrossRef CAS.
- A. Di Blasi, C. D'Urso, V. Baglio, V. Antonucci, A. S. Arico’, R. Ornelas, F. Matteucci, G. Orozco, D. Beltran, Y. Meas and L. G. Arriaga, J. Appl. Electrochem., 2008, 39, 191–196 CrossRef.
- J. Hu, Int. J. Hydrogen Energy, 2004, 29, 791–797 CrossRef CAS.
- A. N. Nikoloski and M. J. Barmi, Hydrometallurgy, 2013, 137, 45–52 CrossRef CAS.
- S. Schmachtel, S. E. Pust, M. Toiminen, G. Wittstock, K. Kontturi, O. Forsén and M. H. Barker, J. South. Afr. Inst. Min. Metall., 2008, 108, 273–283 CAS.
- S. Rashkov, T. Dobrev, Z. Noncheva, Y. Stefanov, B. Rashkova and M. Petrova, Hydrometallurgy, 1999, 52, 223–230 CrossRef CAS.
- I. Ivanov, Y. Stefanov, Z. Noncheva, M. Petrova, T. Dobrev, L. Mirkova, R. Vermeersch and J. P. Demaerel, Hydrometallurgy, 2000, 57, 125–139 CrossRef CAS.
- I. Ivanov, Y. Stefanov, Z. Noncheva, M. Petrova, T. Dobrev, L. Mirkova, R. Vermeersch and J. P. Demaerel, Hydrometallurgy, 2000, 57, 109–124 CrossRef CAS.
- W. Zhang, C. Q. Tu, Y. F. Chen, W. Y. Li and G. Houlachi, J. Mater. Eng. Perform., 2012, 22, 1672–1679 CrossRef.
- T. Nguyen, N. Guresin, M. Nicol and A. Atrens, J. Appl. Electrochem., 2007, 38, 215–224 CrossRef.
- A. N. Nikoloski and M. J. Nicol, Miner. Process. Extr. Metall. Rev., 2007, 29, 143–172 CrossRef.
- L. Yanqing, J. Liangxing, L. Jie, Z. Shuiping, L. Xiaojun, P. Hongjian and L. Yexiang, Hydrometallurgy, 2010, 102, 81–86 CrossRef.
- E. K. Alamdari, D. Darvishi, M. Samadi Khoshkhoo, F. A. Javid and S. P. H. Marashi, Hydrometallurgy, 2012, 119–120, 77–86 CrossRef CAS.
- Y. Lai, Y. Li, L. Jiang, W. Xu, X. Lv, J. Li and Y. Liu, J. Electroanal. Chem., 2012, 671, 16–23 CrossRef CAS.
- T. Nguyen and A. Atrens, Hydrometallurgy, 2009, 96, 14–26 CrossRef CAS.
- J. C. K. Ho, G. T. Filho, R. Simpraga and B. E. Conway, J. Electroanal. Chem., 1994, 366, 147–162 CrossRef CAS.
- H. T. Yang, H. R. Liu, Z. C. Guo, B. M. Chen, Y. C. Zhang, H. Huang, X. L. Li, R. C. Fu and R. D. Xu, Hydrometallurgy, 2013, 140, 144–150 CrossRef CAS.
- H. Ma, S. Chen, B. Yin, S. Zhao and X. Liu, Corros. Sci., 2003, 45, 867–882 CrossRef CAS.
- R. D. Xu, L. P. Huang, J. F. Zhou, P. Zhan, Y. Y. Guan and Y. Kong, Hydrometallurgy, 2012, 125–126, 8–15 CrossRef CAS.
- N. Chahmana, L. Zerroual and M. Matrakova, J. Power Sources, 2009, 191, 144–148 CrossRef CAS.
- N. Chahmana, M. Matrakova, L. Zerroual and D. Pavlov, J. Power Sources, 2009, 191, 51–57 CrossRef CAS.
- M. Mohammadi, F. Mohammadi and A. Alfantazi, J. Electrochem. Soc., 2013, 160, E35–E43 CrossRef CAS.
| This journal is © The Royal Society of Chemistry 2018 |

