 Open Access Article
Performance evaluation of mercapto functional hybrid silica sol–gel coating and its synergistic effect with f-GNs for corrosion protection of copper surface
Shu Tianab,
Zhixiong Liu *a,
Luli Shena,
Jibin Pu*a,
Wenqing Liub,
Xiaofeng Sunc and
Zhanming Lic
aKey Laboratory of Marine Materials and Related Technologies, Zhejiang Key Laboratory of Marine Materials and Protective Technologies, Ningbo Institute of Materials Technology and Engineering, Chinese Academy of Sciences, Ningbo 315201, P. R. China. E-mail: liuzhixiong@nimte.ac.cn; Fax: +86-574-86685159; Tel: +86-574-86685035
bInstitute of Materials, Shanghai University, Shanghai 200072, P. R. China
cDepartment of Equipment Support and Remanufacturing, Academy of Army Armored Force, Beijing 100072, P. R. China
First published on 16th February 2018
Abstract
A nanocomposite coating comprising mercapto functional hybrid silica sol–gel coating and functionalized graphene nanoplates nanocomposite coatings with advanced anticorrosive properties was prepared by a sol–gel method. In this study, graphene oxide (GO) nanoplates were silanized using 3-aminopropyltriethoxysilane (APTES) to obtain functional graphene nanoplates (f-GNs). The f-GNs were characterized by FTIR, XRD, XPS, TEM, AFM and TGA techniques. The functionalized graphene nanoplates were chemically bonded to a sol–gel matrix and showed good dispersion in the sol. Then, silica hybrid sol–gel nanocomposites with raw GO and different amounts of f-GNs were applied on the copper surface. Uniform, defect-free and adherent sol–gel films were obtained. Various corresponding methods were used to investigate the nanocomposite coating's properties. The corrosion resistance of copper significantly improved after being coated with mercapto functional hybrid silica sol–gel. The addition of f-GNs to the mercapto functional silica sol–gel coatings further improved the corrosion resistance due to a synergistic effect. Moreover, with an increase in the amount of f-GNs in the nanocomposite coating, the nanocomposite showed improved corrosion resistance. The nanocomposite containing 0.1 wt% f-GNs can efficiently protect the copper substrate from corrosion. This improvement was primarily attributed to the homogeneous dispersion of the f-GNs in the silica gel matrix and their effective barrier against corrosive molecules and ions. However, adding raw GO or excess f-GNs to the silica hybrid sol–gel coating had a negative effect on the corrosion resistance.
1. Introduction
Copper is used in numerous fields such as electrical engineering, integrated circuit manufacturing, and construction materials due to its unique thermal, electric and mechanical properties.1,2 Unfortunately, when copper is exposed to air or other oxidizing environments, its corrosion is unavoidable, resulting in poor performance and also corrosion failure.3 Therefore protection of copper surfaces to prolong their service life is urgently required.4Hybrid silica sol–gel coatings are gaining increasing interest for corrosion protection of metals and alloys due to their high corrosion resistance and compatibility with organic top coatings.5–10 Good corrosion resistance is primarily attributed to the formation of stable Si–O–metal bonds between silanol groups and the surface of alloys. However, the protection performance of copper metal is not satisfactory because the formation of stable Si–O–Cu chemical bonds is very difficult.11–16 Moreover, silica sol–gel coating is prone to formation and propagation of cracks during the curing stage at high temperatures, which finally results in the electrolyte reaching the metallic surface, leading to the onset of corrosion. To solve this problem, a common method is introducing mercapto groups into the silica sol–gel coatings. It is reported that mercapto groups can form stable Cu–S–C chemical bonds with copper.15–18 Organomodified silane precursors with mercapto groups such as 3-mercaptopropyltrimethoxysilane (MATMS) have been used to develop functional silica-based sol–gel coatings for copper corrosion protection.18
Graphene nanosheets are promising nanostructures for obtaining high efficiency anticorrosive nanocomposite coatings because of their impermeability to corrosive species such as air, water and ions.19–21 However, the weak forces between the nanosheets cause agglomeration in the organic coatings. The poor dispersion of the raw graphene nanosheets finally has a negative effect on improvement of corrosion resistance.22,23 Graphene functionalized with special groups is prone to be well-dispersed into coatings. However, functional graphene as a nanofiller for the reinforcement of the corrosion resistance of sol–gel coatings has not been sufficiently studied.24–28 Ramezanzadeh et al. reported the first silica hybrid sol–gel layer containing silanized GO nanosheets on steel surface as a primer for epoxy coatings.26 Li et al. found that a silica hybrid sol–gel coating with 0.2 wt% graphene nanosheets on galvanized steel exhibits better corrosion mitigation performance than neat silica sol–gel coating.27 Seifzadeh et al. reported that the corrosion resistance of the sol–gel coating with rGO@APTES nanoplates on aluminum alloys was significantly improved.28 However, to the best of our knowledge, there have been few reports on silica sol–gel coatings with graphene nanosheets as nanofillers for copper protection.
Recently, our group reported that mercapto functional silica sol–gel coatings showed good protection performance for copper substrates.29,30 Following our continued pursuit of developing efficient functional silica sol–gel coatings for copper protection, herein, we report a nanocomposite coating comprising mercapto functional silica sol–gel coating and silanized graphene nanoplates, which shows good corrosion protection performance for copper due to a synergistic effect. The GO nanosheets were first silanized to produce f-GNs nanocomposite and then, the silanized nanoplates were chemically bonded to the mercapto functional sol–gel coating matrix. This nanocomposite coating was designed on the basis of the following considerations. First, the mercapto group can form stable Cu–S–C chemical bonds with copper elements and improve the adhesion between the coating and the copper surface. Second, the f-GNs nanoplates were chemically bonded into the mercapto functional silica sol–gel coating. In particular, the mercapto functional silica sol–gel coating and functional graphene nanosheets may synergistically improve the corrosion resistance of nanocomposite coatings.
2. Experimental
2.1. Silanization of the GO nanoplates
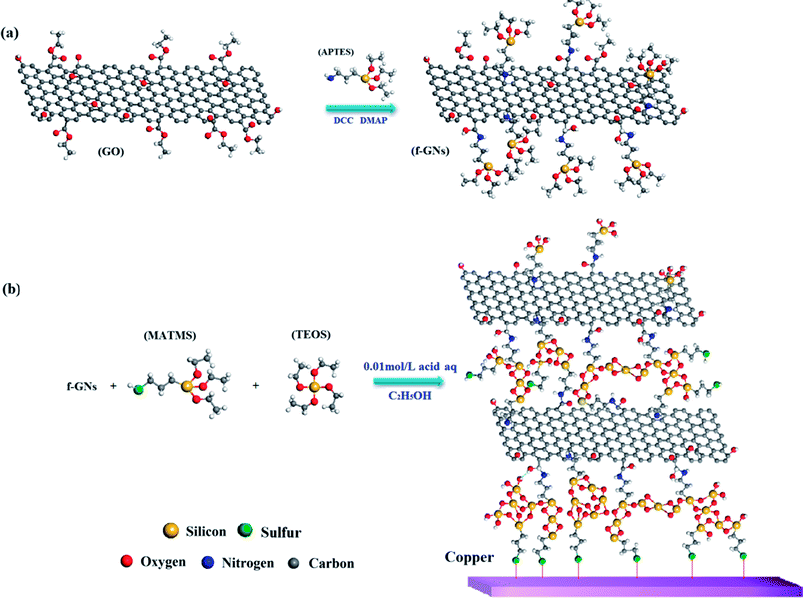
The synthetic route for the functional graphene nanoplates (f-GNs) is presented in Scheme 1a. Graphene oxide nanoplates (>99%) with 2–10 nanosheets were purchased from LEADERNANO Ltd. First, 1.0 g GO nanoplate, 0.5 g dicyclohexylcarbodiimide (DCC) and 0.5 g 4-dimethylaminopyridine (DMAP) were dispersed in 100 mL 3-aminopropyltriethoxysilane (APTES) by ultrasonication for 1 h at room temperature. The homogeneous mixture was magnetically stirred for 24 h at 70 °C to obtain functional graphene nanosheets (f-GNs). Subsequently, the f-GNs were centrifuged and washed with 30 mL ethyl alcohol for five times. Finally, the product was dried in a vacuum drying oven.2.2. Synthesis of f-GNs/mercapto functional hybrid silica sol–gel nanocomposite
The synthetic route for f-GNs/mercapto functional hybrid silica sol–gel nanocomposite is presented in Scheme 1b. First, 0.1 mol (23.8 g) 3-mercaptopropyltrimethoxysilane (MATMS) and 0.05 mol (10.4 g) tetraethylorthosilicate (TEOS) were stirred at room temperature for 30 min. Then, 0.1 wt% (52.3 mg) graphene oxide (GO) or 0.05 wt% (26.15 mg), 0.1 wt% (52.3 mg), 0.2 wt% (104.6 mg) f-GNs nanoplates were added and ultrasonically dispersed for 1 h. Next, 13.5 mL dilute solution of formic acid (0.01 mol L−1) was added. The above mixture was diluted with ethanol to a solid content of 30 wt%. Finally, the prepared solution was stirred at around 800 rpm for about 5 h at room temperature. A series of hybrid silica sol–gel nanocomposites with GO and f-GNs nanoplates were successfully obtained.2.3. Preparation of the sol–gel coating on copper alloy
H62 Cu alloy was purchased from Shengbai Metal Materials Co., Ltd. (Shenzhen, China). The size of the alloy samples was 5.5 × 2.5 × 0.1 cm. First, the Cu substrate was sanded using abrasive paper with different grits (180, 320, 800, and 1000). Subsequently, the alloy samples were washed with deionized water and ultrasonically degreased in acetone for 15 min. The copper samples were immersed into the prepared sol solution for 5 min and then dried at 100 °C for 1 h.2.4. Characterization
X-ray diffraction (XRD) analysis using D8 Advance (BRUKER, GER) with Cu Kα radiation (λ = 0.154 nm) was utilized to record the diffraction pattern of GO and f-GNs. The Fourier Transform Infrared (FTIR) spectrum of the GO and f-GNs nanoplates were recorded using a Nicolet 6700 spectrophotometer (Thermo, USA). The sample/KBr ratio in the FTIR studies was about 1/100. The chemical components of GO and f-GNs were studied by X-ray photo-electron spectroscopy (XPS) (Kratos, UK). The morphologies of the original raw GO and f-GNs nanoplates were investigated by Tecnai F20 Transmission Electron Microscopy (TEM) (FEI, USA). The alcohol suspensions of GO and f-GNs were spread on a 200-mesh copper grid for TEM imaging. The surface topography of the sol–gel coatings on the copper alloy was observed by an EVO18 Scanning Electron Microscope (SEM) (Zeiss, GER). Scanning Probe Microscope (SPM) (Vecco, USA) analysis was used to characterize the thickness of GO and f-GNs and the roughness of sol–gel coatings. Thermogravimetric analysis (TGA) was carried out using Diamond TG/DTA (PerkinElmer, USA). The temperature range was 30 °C to 1000 °C at a ramp rate of 10 °C min−1 under nitrogen atmosphere. The average diameter of the graphene distributed in sol was characterized by a S3500 wet and dry laser particle size analyzer (Microtrac, USA).2.5. Corrosion tests
The corrosion protection performance of sol–gel coatings on the copper alloy was tested by potentiodynamic polarization and electrochemical impedance spectroscopy (EIS) measurements. PGSTAT302 electrochemical workstation (Autolab) was used for electrochemical testing. The aggressive medium was a natural 3.5 wt% NaCl aqueous solution. A classical three electrodes system was used, which was composed of a saturated Ag–AgCl electrode as the reference electrode, a platinum filament as the counter electrode and a coated alloy sample (1 cm−1) as the working electrode. The scan rate of potentiodynamic polarization was 0.001 V s−1. The test frequency range for EIS was 105 to 10−2 Hz and the excitation amplitude was 10 mV.3. Results and discussions
3.1. Characterization of the f-GNs nanosheets
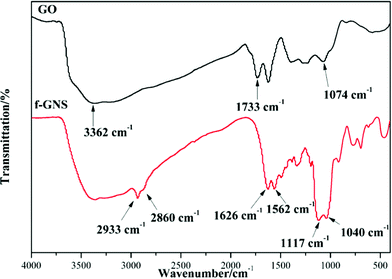
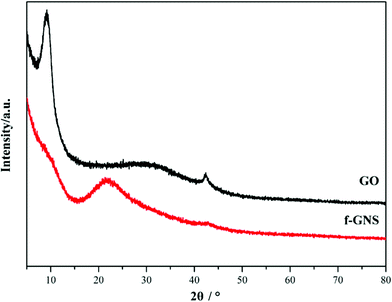
GO nanosheets were silanized according to the above-mentioned procedure. The FTIR spectra of the original GO and f-GNs nanosheets are presented in Fig. 1. The very broad absorption peak at around 3362 cm−1 is attributed to the hydroxyl groups. The absorption band of GO at 1733 cm−1 is related to the carboxylic groups. After reacting with the amine group of the APTES, new merged peaks at 2933 and 2860 cm−1 were assigned to the symmetric and asymmetric vibrations of the –CH2– groups of the alkyl chains of the APTES, respectively.31 The absorption band at around 1500–1650 cm−1 is ascribed to the C–N stretching and N–H bending of the amide functional group. The appearance of the new absorption peaks at around 1117 and 1040 cm−1 can be attributed to the Si–O–C groups, which provide evidence of successful chemical functionalization.32 In addition, the absorption peak at around 1074 cm−1, corresponding to the epoxide group, disappeared after silanization, further indicating the reaction between the epoxide groups of the GO and the amine group of the APTES.The XRD patterns of the GO and f-GNs nanosheets are presented in Fig. 2. The characteristic band of the raw GO nanosheets was observed at 2θ = 11.55°, corresponding to d-spacing = 0.804 nm. The original characteristic peak completely disappeared after silanization, providing evidence of the removal of the oxygen-containing groups of GO nanosheets. However, a new diffraction peak appeared at 2θ = 24.8° in the XRD pattern of the f-GNs nanosheets. The d-spacing of the functionalized GO nanoplates is close to 0.383 nm, which is much lower than that of the raw GO nanosheets, confirming the removal of the oxygen-containing groups. The decrease in the d-spacing in the silanized nanoplates clearly showed that the silanization process can effectively separate the GO nanosheets.
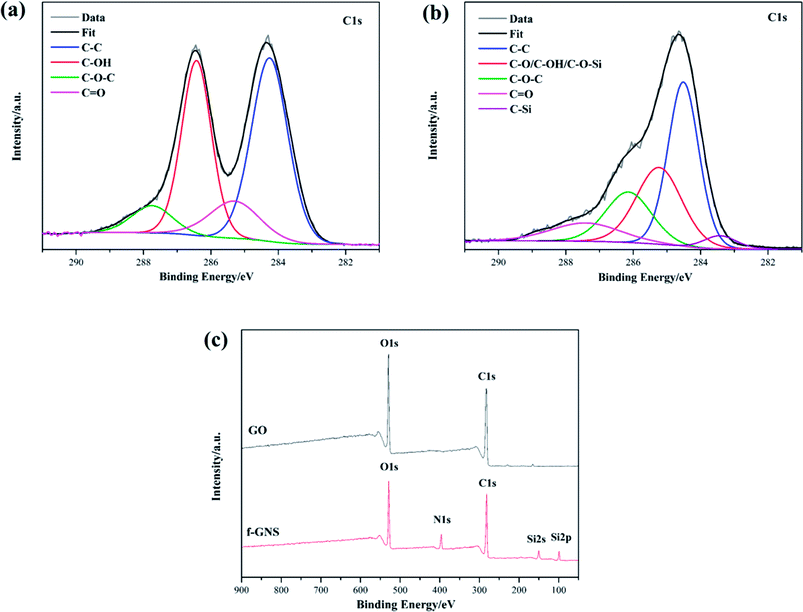
XPS was also employed to characterize the raw GO and the f-GNs nanosheets. The XPS survey spectra of the original GO and the f-GNs nanosheets are presented in Fig. 3. The analysis of the C1s region of the raw GO nanoplates revealed the presence of four resolved peaks appearing at 284.7, 285.6, 286.4 and 287.8 eV (Fig. 3a), assigned to the non-oxygenated C–C/C![[double bond, length as m-dash]](https://www.rsc.org/images/entities/char_e001.gif) C and oxygenated functional groups (C–OH, C–O–C, C
C and oxygenated functional groups (C–OH, C–O–C, C![[double bond, length as m-dash]](https://www.rsc.org/images/entities/char_e001.gif) O). The XPS spectra of f-GNs sheets showed similar types of carbon functional groups (Fig. 3b). A new peak at 283.6 eV corresponding to the C–Si bond appeared in the XPS spectra of f-GNs sheets, suggesting successful silanization of the GO materials. However, the absorbance peak intensity of oxygenated C in epoxy and carboxyl groups showed a sharp decrease after the silanization reaction. As shown in Fig. 3c, the significant increase in the N1S peak and appearance of the new Si2s and Si2s peaks further indicated the successful covalent functionalization of GO with APTES.
O). The XPS spectra of f-GNs sheets showed similar types of carbon functional groups (Fig. 3b). A new peak at 283.6 eV corresponding to the C–Si bond appeared in the XPS spectra of f-GNs sheets, suggesting successful silanization of the GO materials. However, the absorbance peak intensity of oxygenated C in epoxy and carboxyl groups showed a sharp decrease after the silanization reaction. As shown in Fig. 3c, the significant increase in the N1S peak and appearance of the new Si2s and Si2s peaks further indicated the successful covalent functionalization of GO with APTES.
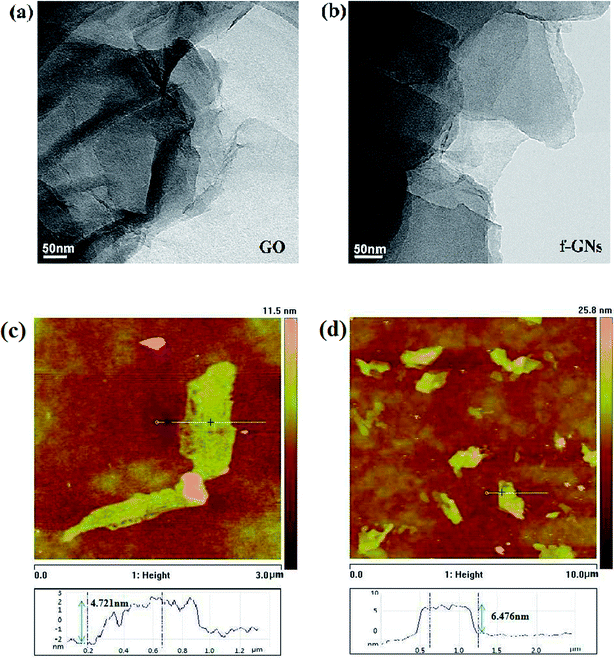
TEM and AFM measurements were used to measure the morphology and thickness of raw GO and f-GNs nanosheets. Compared with the wrinkled morphology of raw nanosheets, the GNs nanosheets displayed an even more flat morphology (Fig. 4a and b). As shown in Fig. 4c, the GO nanoplate has a height of around 4.721 nm. The exfoliated f-GNs nanosheets prepared in our study have an average thickness about 6.476 nm, which is more than that of the raw GO. The increasing thickness of f-GNs nanosheets is attributed to the presence of silane chains of the f-GNs nanosheets.
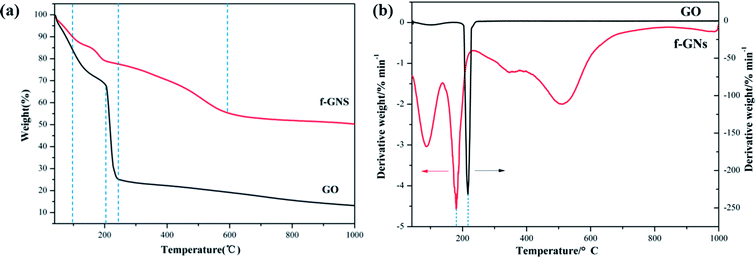
The thermal property of the nanocomposite was studied using a TGA instrument. The TGA curves of raw GO nanoplates and f-GNs nanosheets under nitrogen atmosphere are presented in Fig. 5. The raw GO is thermally unstable and begins to lose weight upon heating below 100 °C due to the easy release of water contained in the GO samples. The major weight loss (up to 75%) occurred below 250 °C and the reasonable explanation is that the oxygen-containing functional moieties such as hydroxyl and epoxy were decomposed gradually. However, the weight loss of f-GNs nanosheets below 250 °C was much lower (less than 20%), suggesting that the main oxygen containing groups were converted after reacting with APTES. The main weight loss of the f-GNs nanosheets occurred in the range of 300–600 °C, presumably assigned to the decomposition of the silane chains grafted to the graphene sheets.
As shown in Fig. 5a, the 5%-weight loss temperatures for f-GNs and GO were 66.73 °C and 55.46 °C, respectively. The residual weights left after recording the thermogravimetric trace up to 1000 °C were determined as the char yield of f-GNs and GO, which were 49.56% and 86.57%, respectively. In addition, the temperatures for the maximum rate of weight loss of f-GNs and GO were 180.86 °C and 216.77 °C, respectively (Fig. 5b). From these parameters, it can be inferred that the f-GNs showed better thermal stability than the raw GO nanosheets.
3.2. Characterization of the silica hybrid sol–gel nanocomposite
The visual images of the raw GO and f-GNs nanoplates (0.1 wt%) in the hybrid silica sol for different times are presented in Fig. 6a–c. From Fig. 6, it is clear that the f-GNs nanoplates were completely dispersed in the organosilane sol and a black homogeneous sol was obtained after ultrasound treatment. Even when the black homogeneous sol was left undisturbed at room temperature for more than 5 h, there was no visible change, indicating good dispersion in the silica hybrid sol. The reasonable explanation is that the f-GNs nanoplates were chemically bonded into the silica sol and thus effectively inhibited the nanosheets' agglomeration. A brown silica sol was obtained after ultrasonic agitation of the silane mixture with GO nanoplates. However, only after being left undisturbed for 90 min, the GO nanosheets started to agglomerate and gradually produced suspended visible structures at the bottom of the bottle. As time passed, a considerable amount of agglomerates was observed, suggesting that the raw GO nanosheets were not separated well from each other. | ||
| Fig. 6 Dispersion behavior of the GO and f-GNs nanoplates in the hybrid silane mixture after hydrolyzing for (a) 0 min, (b) 90 min, (c) 300 min. | ||
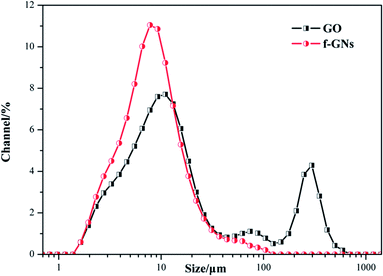
In order to study the dispersal properties of the raw GO and f-GNs nanoplates in the silane mixture, the particle sizes were further measured. As shown in Fig. 7, the diffraction particle size of GO nanoplates in the silica hybrid sol showed two peaks at about 11 and 296 μm, respectively, suggesting that a part of the raw GO agglomerated together. On the contrary, the diffraction particle size of f-GNs nanoplates in the silica hybrid sol showed a single peak at 7.8 μm, indicating that the functional GO nanosheets have a relatively uniform size distribution and good dispersivity.
The surface morphology of the nanocomposite coatings containing different amounts of the raw GO and functional GO nanosheets was studied. As shown in Fig. 8a, the silica hybrid sol–gel coatings in the absence of the nanofiller are uniform, defect-free and tightly attached to the copper surface. In addition, the surface morphology of the nanocomposite coatings showed no visible changes on addition of low concentrations of f-GNs nanoplates. However, some degree of morphological inhomogeneity was observed on the applied coatings on increasing the nanoplates concentration. For example, the nanosheets containing 0.2% f-GNs nanoplates began agglomerating and could not disperse well in the silica sol mixture. Compared with the functional GO nanosheets, the raw GO nanosheets are prone to agglomerate. As shown in Fig. 8e, the hybrid sol–gel coatings with only 0.1% raw GO nanoplates showed inhomogeneous structures. In addition, the surface topography of the nanocomposite coatings was further investigated using the AFM technology. As shown in Fig. 8f, the surface roughness of the blank silica sol–gel coating was 2.41 nm. With an increase in the amount of functional GO nanosheets, the surface roughness of the nanocomposite coatings increased. For example, the surface roughness of the coatings with 0.05%, 0.1%, and 0.2% f-GNs was 4.81, 6.72, and 14.4 nm, respectively (Fig. 8g–j). However, the surface roughness of the nanocomposite coatings with raw GO nanoplates was larger than that of the functional nanosheets.
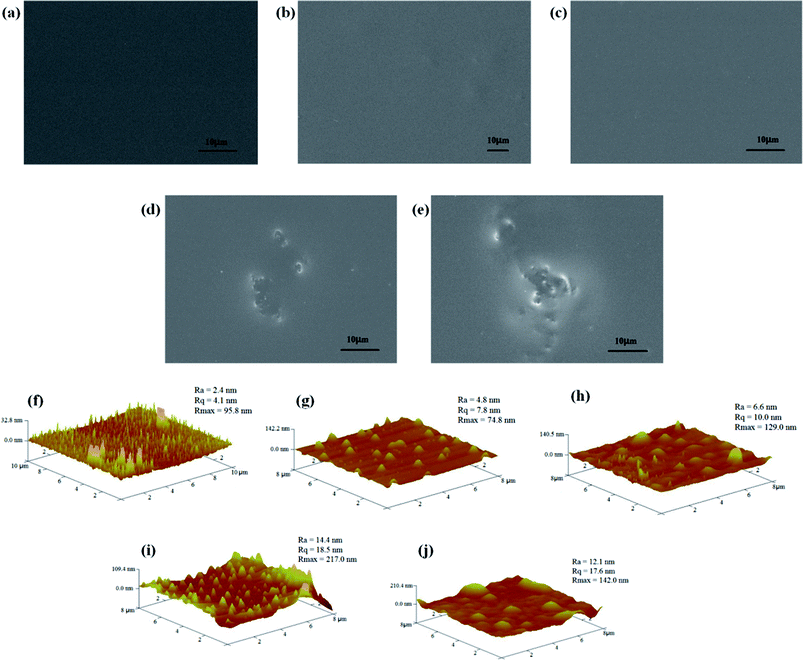 | ||
| Fig. 8 SEM and AFM images of the nanocomposite coatings containing (a and f) none, (b and g) 0.05% f-GNs, (c and h) 0.1% f-GNs, (d and i) 0.2% f-GNs, and (e and j) 0.1% GO. | ||
3.3. Corrosion resistance of coating
The corrosion protection of the prepared silica hybrid sol–gel coatings with various contents of the functionalized GO nanoplates and raw GO nanosheets was studied by potentiodynamic polarization measurement. The polarization curves of the silica coatings with different amounts of functional GO nanoplates and raw GO nanosheets are shown in Fig. 9. Parameters such as current density (Icorr) and corrosion potential (Ecorr) were determined and presented in Table 1. The protection efficiency (η) is calculated using the following equation:
 | (1) |
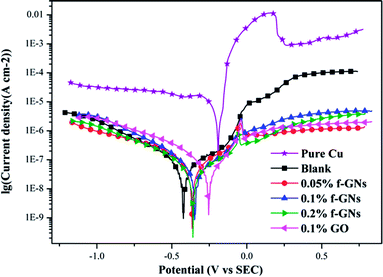 | ||
| Fig. 9 Potentiodynamic polarization curves of nanocomposite coatings with different amounts of the raw GO and functional GO nanosheets. | ||
| Sample | Ecorr (mV) vs. SCE | Icorr (A cm−2) | η (%) |
|---|---|---|---|
| Bare copper | −191 | 6.81 × 10⁻⁶ | — |
| Blank | −408 | 6.58 × 10⁻⁸ | 99.03 |
| 0.05% f-GNs | −258 | 6.15 × 10⁻⁸ | 99.09 |
| 0.1% f-GNs | −173 | 2.20 × 10⁻⁸ | 99.68 |
| 0.2% f-GNs | −314 | 1.64 × 10⁻⁸ | 99.76 |
| 0.1% GO | −244 | 7.75 × 10⁻⁸ | 99.86 |
The EIS curves obtained for the silica sol–gel coatings without/with raw and f-GNs nanoplates at the beginning immersion in 3.5% wt% NaCl solution are presented in Fig. 10. The value of the impedance modulus of the sample coated with the silica sol–gel coating at very low frequency (10 mHz) was up to 1.1 MΩ cm2, which is much larger than that of the bare copper (1 kΩ cm2).29,30 Based on the fact that the corrosion rate is inversely proportional to the value of impedance modulus at low frequency,33 it can be concluded that the silica coatings with thiol moieties could markedly enhance corrosion resistance of copper materials.29,30 When the f-GNs nanosheets were chemically bonded onto the crosslinking sol–gel coatings, the value of impedance modulus further increased to 1.9 MΩ cm2, which is almost twice as that of the pure silica film, indicating a better corrosion resistance ability due to a synergistic effect.
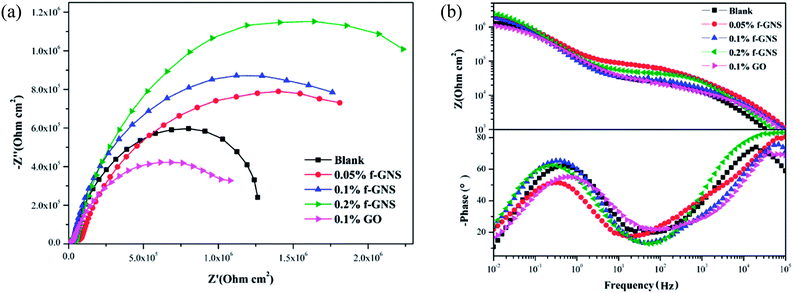 | ||
| Fig. 10 EIS curves for the silica sol–gel coatings without/with raw and f-GNs nanoplates at the beginning immersion in 3.5% wt% NaCl solution: (a) Nyquist plots and (b) Bode plots. | ||
The EIS plots of the samples coated with various nanocomposite coatings after different immersion times were investigated to further evaluate the corrosion resistance property (Fig. 11 and 12). Upon inspection of the Nyquist plots, it was found that two capacitive loops were observed at the impedance response of all the nanocomposite coatings. Two time constants existed in the phase angle plots. The |Z|0.01 values of the coated samples were close. After 6 h immersion, the |Z|0.01 value of the mercapto functional silica sol–gel coating without the nanofiller decreased from 1.29 MΩ cm2 (0 h) to 0.80 MΩ cm2 (6 h). Compared with that of the pure silica film, the |Z|0.01 value of the nanocomposite coating with 0.05% f-GNs nanosheets showed a relatively slow decrease. After 24 h immersion, the |Z|0.01 value of the functional coating was 0.83 MΩ cm2 (6 h), which is close to that of the pure sol–gel coating after 24 h. The |Z|0.01 value of the nanocomposite coating with 0.1% f-GNs nanosheets slowly decreased with immersion time. After 24 h of immersion, the value was 1.16 MΩ cm2, which is approximately close to that of the pure sol–gel at the beginning, indicating good corrosion protection of this coating. However, when the f-GNs nanosheets were close to 0.2%, the |Z|0.01 value decreased dramatically and approached 0.16 MΩ cm2 (48 h), which is even smaller than the pure silica sol–gel coating. The |Z|0.01 value of the silica sol–gel coating with raw graphene nanoplates (0.1%) was even smaller than that of the original silica sol–gel coating. The probable reason is that high concentrations of the f-GNs nanosheets or raw graphene sheets caused severe agglomeration of the nanoplates in the coating and finally had a negative influence on the corrosion resistance.
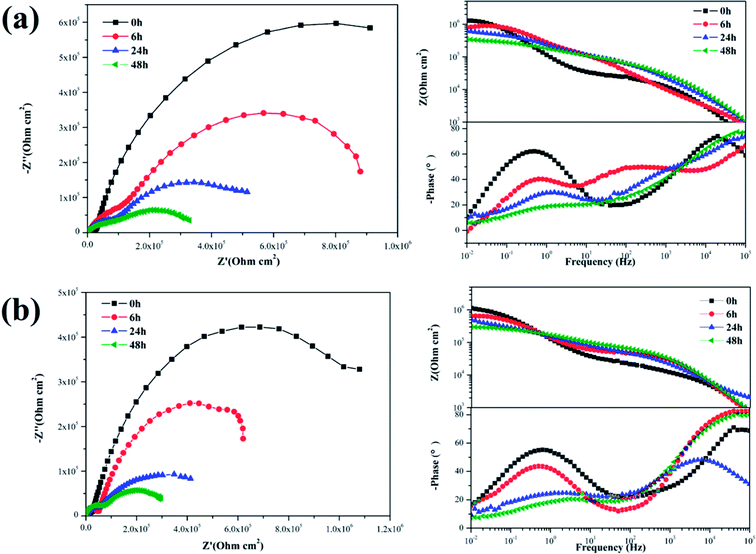 | ||
| Fig. 11 EIS of silica sol–gel coatings (a) without nanoplates and (b) with 0.1% GO after different immersion times in 3.5 wt% NaCl solution. | ||
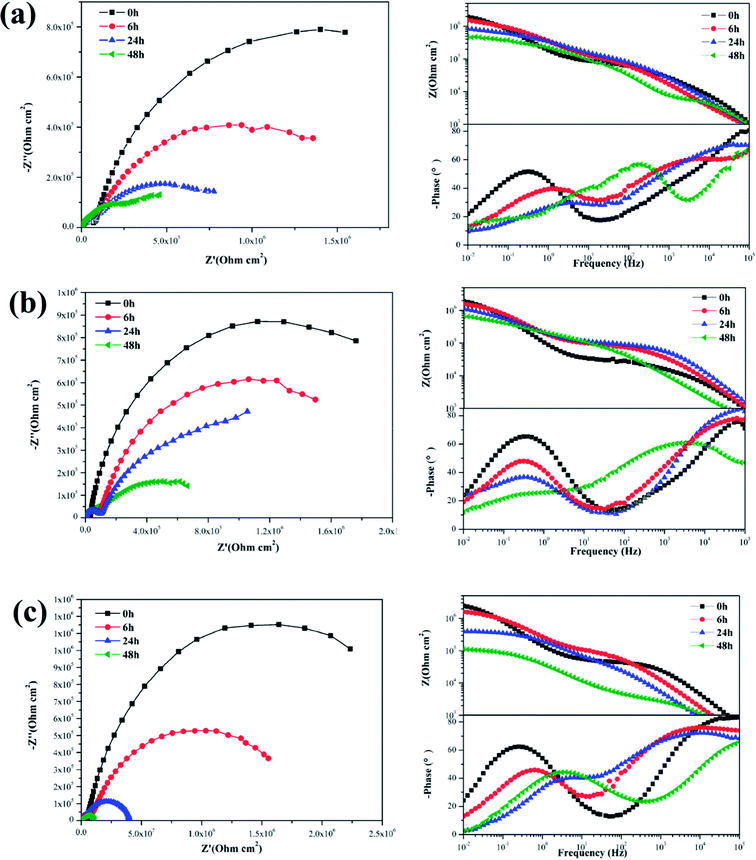 | ||
| Fig. 12 EIS of silica sol–gel coatings with (a) 0.05% f-GNs, (b) 0.1% f-GNs, (c) 0.2% f-GNs nanoplates different immersion times in 3.5 wt% NaCl solution. | ||
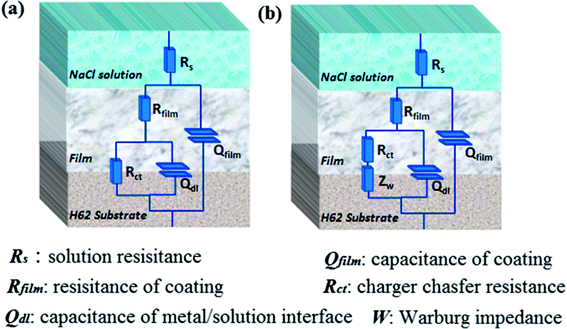
To further analyze the EIS results, impedance data were fitted graphically using the ZSimpWin software. The used equivalent circuits are presented in Fig. 13, and the fitting results are shown in Fig. 14. All EIS plots of the blank and nanocomposite coatings without/with f-GNs nanosheets were analyzed using the circuit R(Q(R(QR))). However, the coatings with raw graphene oxide represented two circuits: R(Q(R(QR))) in 0–24 h and R(Q(R(Q(RW)))) in 48 h. As shown in Fig. 14, the Rct values of the nanocomposite coatings with f-GNs nanosheets are larger than those of the pure silica sol–gel coatings at all the immersion times, indicating better corrosion resistance. Among all the coatings, the nanocomposite coatings with 0.1% f-GNs nanosheets showed a much improved corrosion resistance property. This result is more probably related to the effective dispersion and the good barrier effects of the f-GNs nanosheets. In addition, the addition of probable amounts of f-GNs nanosheets further improved the corrosion protection of the silica nanocomposite coatings by blocking the micro-defects and increasing the diffusion path length of the corrosive materials. However, the coatings with raw graphene oxide nanoplates displayed the poorest corrosion resistance property owing to the severe agglomeration.
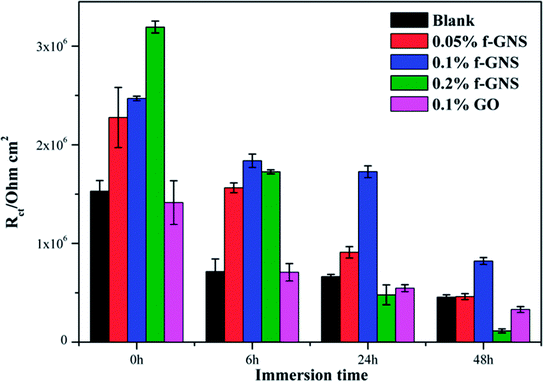 | ||
| Fig. 14 Electrochemical parameters Rct of different samples obtained from equivalent circuit by simulation using ZSimpWin software. | ||
4. Conclusion
A nanocomposite coating consisting of mercapto functional hybrid silica sol–gel coating and functionalized GO nanoplates (f-GNs) was prepared by a sol–gel method for copper corrosion protection. GO nanoplates were successfully grafted with APTES to obtain functional reduced graphene nanoplates through epoxy ring opening reaction and amidation reaction. The f-GNs nanoplates were characterized by FTIR, XRD, XPS, TEM, AFM and TGA techniques. The functionalized graphene nanoplates were chemically bonded into the silica sol by hydrolysis and condensation with organomodified silane precursors with mercapto groups, showing much better dispersion in the hybrid organosilane mixture. The corrosion resistance of copper significantly improved after being coated with the mercapto functional hybrid silica sol–gel coating. The addition of f-GNs nanoplates into the mercapto functional silica sol–gel coatings further improved the corrosion resistance property of the silica sol–gel coating due to a synergistic effect. Moreover, upon increasing the f-GNs nanoplates in the nanocomposite coating, the nanocomposite showed better corrosion resistance performance. The nanocomposite containing 0.1 wt% f-GNs can efficiently protect the copper substrate from corrosion. This improvement was primarily attributed to the homogeneous dispersion of the f-GNs nanoplates in the silica gel matrix and their good barrier against the corrosive molecules and ions. However, adding raw GO or more f-GNs nanoplates into the silica hybrid sol–gel coating could negatively influence the corrosion resistance of copper. The nanocomposite coating prepared in this study is a promising coating for copper protection.Conflicts of interest
There are no conflicts to declare.Acknowledgements
The authors gratefully acknowledged financial support provided by the Open Financial Great from Qingdao National Laboratory for Marine Science and Technology (QNLM2016ORP0409), the National Natural Science Foundation of China (51603217), National Key Basic Research Program of China (2014CB643305).References
- D. A. Jones, Principles and prevention of corrosion, Prentice Hall, Upper Saddle River, NJ, 2nd edn, 1996 Search PubMed.
- F. Caprioli, A. Martinelli, D. Gazzoli, V. Di Castro and F. Decker, J. Phys. Chem. C, 2012, 116, 4628–4636 CAS.
- G. Kear, B. D. Barker and F. C. Walsh, Corros. Sci., 2004, 46, 109–135 CrossRef CAS.
- P. A. Sorensen, S. Kiil, K. Dam-Johansen and C. E. Weinell, J. Coat. Technol. Res., 2009, 6, 135–176 CrossRef CAS.
- M. Guglielmi, J. Sol-Gel Sci. Technol., 1997, 8, 443–449 CAS.
- C. Sanchez, P. Belleville, M. Popall and L. Nicole, Chem. Soc. Rev., 2011, 40, 696–753 RSC.
- U. Schubert, N. Husing and A. Lorenz, Chem. Mater., 1995, 7, 2010–2027 CrossRef CAS.
- M. L. Zheludkevich, I. M. Salvado and M. G. S. Ferreira, J. Mater. Chem., 2005, 15, 5099–5111 RSC.
- A. Duran, Y. Castro, M. Aparicio, A. Conde and J. J. de Damborenea, Int. Mater. Rev., 2007, 52, 175–192 CrossRef CAS.
- S. X. Zheng and J. H. Li, J. Sol-Gel Sci. Technol., 2010, 54, 174–187 CrossRef CAS.
- M. Pilz and H. Romich, J. Sol-Gel Sci. Technol., 1997, 8, 1071–1075 CAS.
- W. Boysen, A. Frattini, N. Pellegri and O. de Sanctis, Surf. Coat. Technol., 1999, 122, 14–17 CrossRef CAS.
- E. Bescher and J. D. Mackenzie, J. Sol-Gel Sci. Technol., 2003, 26, 1223–1226 CrossRef CAS.
- S. Peng, Z. Zeng, W. Zhao, H. Li, Q. Xue and X. Wu, Surf. Coat. Technol., 2012, 213, 175–192 CrossRef CAS.
- F. Zucchi, V. Grassi, A. Frignani and G. Trabanelli, Corros. Sci., 2004, 46, 2853–2865 CrossRef CAS.
- F. Zucchi, A. Frignani, V. Grassi, G. Trabanelli and M. DalColle, Corros. Sci., 2007, 49, 1570–1583 CrossRef CAS.
- H. Q. Fan, S. Y. Li, Z. C. Zhao, H. Wang, Z. C. Shi and L. Zhang, Corros. Sci., 2011, 53, 4273–4281 CrossRef CAS.
- M. A. Chen, X. B. Lu, Z. H. Guo and R. Huang, Corros. Sci., 2011, 53, 2793–2802 CrossRef CAS.
- G. Christopher, M. A. Kulandainathan and G. Harichandran, Prog. Org. Coat., 2015, 89, 199–211 CrossRef CAS.
- P. A. Okafor, J. Singh-Beemat and J. O. Iroh, Prog. Org. Coat., 2015, 88, 237–244 CrossRef CAS.
- M. H. Sadhir, M. Saranya, M. Aravind, A. Srinivasan, A. Siddharthan and N. Rajendran, Appl. Surf. Sci., 2014, 320, 171–176 CrossRef CAS.
- B. Ramezanzadeh, Z. Haeri and M. Ramezanzadeh, Chem. Eng. J., 2016, 303, 511–528 CrossRef CAS.
- C. Y. Lee, J. H. Bae, T. Y. Kim, S. H. Chang and S. Y. Kim, Composites, Part A, 2015, 75, 11–17 CrossRef CAS.
- M. Mo, W. Zhao, Z. Chen, Q. Yu, Z. Zeng, X. Wu and Q. Xue, RSC Adv., 2015, 5, 56486–56497 RSC.
- X. Wang, W. Xing, L. Song, H. Yang, Y. Hu and G. H. Yeoh, Surf. Coat. Technol., 2012, 206, 4778–4784 CrossRef CAS.
- B. Ramezanzadeh, A. Ahmadi and M. Mahdavian, Corros. Sci., 2016, 109, 182–205 CrossRef CAS.
- J. Li, J. Cui, J. Yang, Y. Ma, H. X. Qiu and J. H. Yang, Prog. Org. Coat., 2016, 99, 443–451 CrossRef CAS.
- S. Nezamdoust and D. Seifzadeh, Prog. Org. Coat., 2017, 109, 97–109 CrossRef CAS.
- S. S. Peng, Z. X. Zeng, W. J. Zhao, J. M. Chen, J. Han and X. D. Wu, Surf. Coat. Technol., 2014, 251, 135–142 CrossRef CAS.
- S. S. Peng, Z. X. Zeng, W. J. Zhao, H. Li, J. M. Chen, J. Han and X. D. Wu, RSC Adv., 2014, 4, 15776–15781 RSC.
- H. N. Cao, J. He, L. Deng and X. Q. Gao, Appl. Surf. Sci., 2009, 255, 7974–7980 CrossRef CAS.
- N. Majoul, S. Aouida and B. Bessaïs, Appl. Surf. Sci., 2015, 331, 388–391 CrossRef CAS.
- E. Barsoukov and J. R. Macdonald, Impedance spectroscopy: theory, experiment, and applications, John Wiley & Sons, Inc., New Jersey, 2005.
| This journal is © The Royal Society of Chemistry 2018 |

