 Open Access Article
The study on continuous denitrification, desulfurization of pyrolusite/activated coke hybrid catalyst†
Lin Yang a,
Lu Yaoab,
Wenju Jiang*ab,
Xia Jiangab and
Jianjun Liab
aCollege of Architecture and Environment, Sichuan University, Chengdu 610065, P. R. China. E-mail: wenjujiang@scu.edu.cn; xjiang@scu.edu.cn
bNational Engineering Research Center for Flue Gas Desulfurization, Chengdu 610065, P. R. China
First published on 2nd January 2018
Abstract
In this study, the industrial application of pyrolusite/activated coke hybrid catalysts (ACP) for continuous SO2 and NO removal was simulated and studied systematically. The obtained results show that the denitrification process of ACP before SO2 removal had almost no influence on its desulfurization activity even though the surface functional groups showed variation. The denitrification property of ACP, however, significantly enhanced after desulfurization and regeneration. The NO removal efficiency of ACP increased from 74.2% to 100% and remained relatively stable, and the N2 selectivity was higher than 90.2%. The formed metal sulfate (MnSO4 and Fe2(SO4)3), showed the catalytic activity, which synergistically worked with surface functional groups to improve the selected catalytic reduction (SCR) of NO. However, large quantity of the formed metal sulphates restricted the mass transfer on the surface of ACP, which caused the reduction of desulfurization performance and the hypothesis of NO conversion of ACP-Rn.
1. Introduction
With the significant efforts contributed from the national and local government for air pollution control in recent years, the sulphur oxides (SOx) and nitric oxides (NOx) emission, which primarily caused the acid rain, photochemical smog and haze pollution,1–3 has been effectively controlled and the environmental quality greatly improved across China. However, a further control on the emission of such compounds is needed because of the implementation of new Ambient Air Quality Standards (GB 3095-2012), which reported a more strict emission limitation on almost all pollutants. Therefore, improvements in desulfurization and denitrification of the flue gas (FGD), the most common purification method of the sintering exhaust, are still an important challenge for air quality improvement.After years of survey and investigation, significant amount of funds and effort have been devoted to develop new technologies and materials in order to control the emission of SO2 and NOx. Activated coke (AC), a high efficiency and low cost porous carbon material, has obtained increasing attention in recent decades because it can be control the emission of SO2, NOx;4–6 as well as the heavy metal/toxic waste.7,8 However, the issue of deactivation of catalytic activity of AC due to formation of (NH4)2SO4/NH4HSO4 during the simultaneous removal of SO2 and NOx has not been dealt effectively;6 which limits its applicability significantly because of the decreased activity and increased operation cost.9 Therefore, the reactor designers usually divide the moving bed reactor into two parts (upper and bottom section) to ensure the high efficiency of purification. The bottom section is used to remove SO2, heavy metals and toxins, while the upper section is used for denitrification. The flue gas, primarily containing SO2, NOx, and other toxic gases, is introduced into the system from the bottom to first remove SO2, toxic gases and most of the steam, and then completely remove NOx by passing NH3 or CO in the upper section.10 The direction of AC flow is kept opposite to that of the flue gas; AC enters the top of reactor and first removes NO, and then descends to the bottom section to remove SO2, air toxins and steam. After NO and SO2 removal, the SO2/toxics-filled AC is discharged and sent to the regenerator, and then back to the purification plant for reuse of AC after regeneration. Unfortunately, almost all of the previous research were based on only the desulfurization and denitrification separately11 or simultaneously by AC,12,13 nobody had studied the continuous desulfurization and denitrification of AC, which is essential for industrial applications. Tsuji et al. had reported that the NO removal efficiency increased from 45.0 to 80.0% when AC was regenerated after NO and SO2 removal,14 but they only described the variation of NO removal activity, and there was no mention of why the NO removal efficiency improved and its mechanism. It was reported that the physicochemical properties of AC constantly change with continuous usage, it is important to point out what the reciprocities of these two process and how it works.
Moreover, researchers have also made quantity of efforts to improve activity and reduce preparation cost of AC in order to make it more suitable for industrial application.15 Among these technologies, surface modification by loading transition metals attracted great attention.6,16 Natural minerals, rich in transition metals, showed great prospect due to its relatively low cost and the simple preparation procedure when it used as precursor,17 and the catalytic activity and stability of some kinds of natural minerals for SO2 and NO removal also have been proved.18,19 However, it is noteworthy that the formation of metal sulphates during the desulfurization process on the surface of modified AC is unavoidable for almost all the transition metals, and they are difficult to be decomposed under commonly used regeneration temperatures (≤500 °C).20 In our previous research, we had discussed the effects of MnSO4 on SO2 removal over MnO2 modified AC by lending method (i.e. Mn4/AC).21 However, what the effects of the formed metal sulphates on NO removal of such hybrid carbon-based catalyst are still unknown. Therefore, it has as great theoretical significance and practical value (in terms of industrial applications) to study the continous application of AC for denitrification and desulfurization.
In this study, pyrolusite/activated coke catalyst (ACP) was prepared by the blending modification of fresh AC. The continuous denitrification and desulfurization property of prepared sample was investigated on a lab-scale to evaluate its potential for industrial applications. The structure properties and surface chemistry were characterized by BET, XPS, XRD and FTIR. The metal sulphate impregnated AC (AC-IM) and dilute sulphuric acid treated AC (AC-DSC) were prepared to investigate the functions of metal sulphate and surface functional groups formed on regenerated ACP after NO and SO2 removal, which are helpful to point out the reciprocities and the work mechanism between these two processes.
2. Materials and methods
2.1 Preparation of activated coke
In this study, two types of coal as raw carbon materials, coal tar as binder and pyrolusite as catalyst precursor were used to prepare the pyrolusite-doped AC (ACP); the approximate elemental analysis of the two types of coal and coal tar are listed in Table 1. Pyrolusite used in this study majorly consists of Mn (39.40%), Fe (6.27%), Si (4.10%), Ca (1.30%), Ni (0.07%), Cu (0.06%) and Co (0.06%). The ACP preparation is almost similar to our previous study;19 the difference is that the blending ratio of pyrolusite is 10.0 wt%. The metal sulphate impregnated AC (AC-IM) was prepared by equivalent-volume impregnation method. Initially, 3.0 wt% of MnSO4 (AR grade) and 0.6 wt% of Fe2(SO4)3 (AR grade) based on the weight ratio of AC sample were simultaneously dissolved in deionized water. AC was soaked in sulphate solution for 24 h to ensure uniformity of mixture. Following this, the mixture was first dried in a water bath at 60 °C for 2 h to release most of the water, and then placed in an oven at 105 °C overnight. The dilute sulphur acid treated AC (AC-DSC) was also prepared by equivalent volume impregnation method. Fresh AC was immersed in dilute sulphuric acid over 24 h to obtain 10% loading ratio of sulphur acid, and then dried in an oven at 105 °C overnight. Following this, the sulphur acid impregnated AC was calcined at 500 °C for 60 min in N2 atmosphere to simulate the regeneration of AC after SO2 removal.| Samples | Proximate analysis | Elemental analysis | ||||||
|---|---|---|---|---|---|---|---|---|
| Mad | Ad | Vd | FCd | Cad | Had | Nad | Sad | |
| Bituminous coal | 0.85 | 11.83 | 34.11 | 54.06 | 73.78 | 9.69 | 2.29 | 1.76 |
| 1/3 coking coal | 1.32 | 2.74 | 35.55 | 61.71 | 74.23 | 4.83 | 2.08 | 0.47 |
2.2 Characterization of activated coke
Nitrogen adsorption capacity of ACs was measured using ASAP 2460 analyser (Micromeritics, USA) at 77 K. The samples were degassed at 523 K for 8 h before analysis. The specific surface areas (SSA) were calculated using Brunauer–Emmett–Teller equation.22 The total pore volume was estimated with respect to the liquid volume of N2 adsorbed at a relative pressure of 0.995. The micropore (Vmic) volume and micropore surface area (MSA) were obtained by t-plot theory. The mesopore volume (Vmes) was determined by Barret–Joyner–Halenda (BJH, adsorption) model. X-ray photoelectron spectroscopy (XPS) characterization of the surface was carried out on a XSAM-800 spectrometer (KRATOS, UK) with Al-Kα radiation (1486.60 eV) under ultra-high vacuum; the source was operated at 12 kV and 15 mA. Energy calibration was carried out by recording the core level spectra of Au 4f7/2 (84.00 eV) and Ag 3d5/2 (368.30 eV). High-resolution scans (0.10 eV) were recorded over the range of 278.00–294.00 eV (C 1s), 630.00–665.00 eV (Mn 2p) and 700.00–738.00 eV (Fe 2p). The crystal structure of activated coke was determined by X-ray diffraction (XRD) using an X-Pert PRO MPD diffractometer (Panalytical, NL) employing CuKα radiation at 30 kV and 20 mA and step-scanning over 2θ range of 10.00–80.00°. The crystalline phases were identified by comparison with the reference data from the International Center for Diffraction Data (JCPD). The Fourier-Transform Infrared Spectroscopy (FTIR) characterizations were carried out in the 4000–400 cm−1 region with a spectrometer (FTIR 6700, Nicolet, USA) at a resolution of 2 cm−1.2.3 Desulfurization, denitrification and regeneration
The denitrification and desulfurization activity tests were carried out on a lab-scale fixed-bed reactor system (Fig. S1†). The conditions and operation of SO2 removal test were same as our previous study,19 the simulated flue gas contains 3000 ppm of SO2, 8.0% of O2, 10.0% of steam and N2 as balance gas. The NO removal test of the activated coke was carried out under 150 °C with the space velocity of 1000 h−1. The simulated flue gas flow contains 500 ppm (670 mg m−3) of NO, 550 ppm (417 mg m−3) of NH3, 5.0% of O2 and N2 as the balance gas. Before the catalytic reduction of NO with NH3, all samples were saturated with adsorbed NO at the same conditions of denitrification in order to eliminate the adsorption effect. The selective catalytic reduction (SCR)-based NO removal was initiated when the inlet and outlet concentrations of NO were equal. The inlet and outlet SO2 and NO were monitored online by Testo 350, and the 8 h NO removal efficiency was defined as the activity index. For N2 selectivity calculation, the inlet and outlet gas composition were analysed by FT-IR analysis (Antaris IGS-6700, Nicolet Thermo Fisher Scientific). The NO and SO2 removal were simulated by static experiments in order to get uniform samples. The regeneration of SO2 captured ACP was carried out at 500 °C for 60 min in N2 atmosphere (100 mL min−1), and the heating rate of regeneration was 5 °C min−1. The regenerated catalyst-sorbent was labelled as ACP-Rn, and its name was updated as ACP-Rn-NO after denitrification.3. Results and discussion
3.1 The continuous denitrification and desulfurization performance
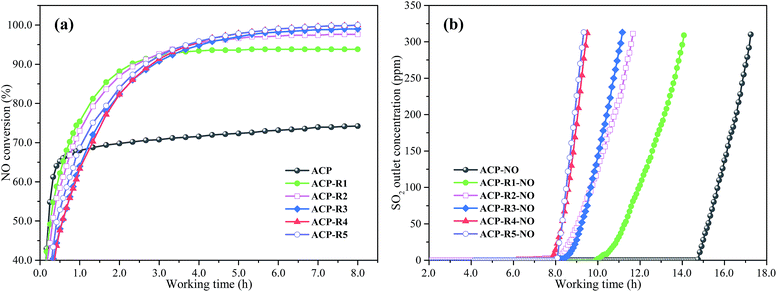
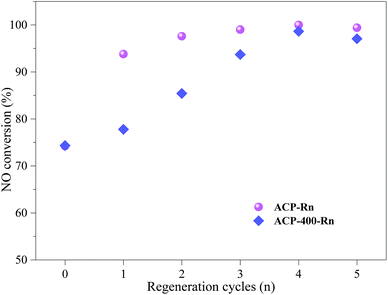
The NO removal efficiency of fresh and regenerated ACP (ACP and ACP-Rn) are shown in Fig. 1a. It can be observed that the NO conversion of the fresh ACP is 74.2%, which significantly improved after continuous NO and SO2 removal and regeneration, and the improvement showed a linear increase with the increase of regeneration cycles. The NO removal efficiency increased to 93.8% after one regeneration cycle (ACP-R1), which is 19.6% higher than that of ACP. After three times of regeneration (ACP-R3), the NO removal efficiency was higher than 99.5% and remained relatively stable with further reuse. This result is clearly consistent with the previous studies that the NO removal activity was enhanced when AC was regenerated after SO2 removal.14,23 The N2O concentration in the outlet gas remained stable in the range from 30 to 35 ppm (53–62 mg m−3), and the corresponding N2 selectivity was higher than 90.2%. It was reported that the coexistence of Mn and Fe can accelerate the electron transfer and promote NH3 activation, which is favourable for the reaction between the NO and NH3.24 However, it is interesting that the ACP-Rn needs a longer working time to reach a stable NO removal activity than that of fresh ACP, and showed a strong dependence on the number of regeneration cycles. This hysteresis of NO reduction in the previous stage of denitrification could be caused by the metal sulphate generated during the desulfurization process, but this is just our deduction. The real reason and mechanism of the hysteresis is still unclear.The desulfurization breakthrough curves of ACP and ACP-Rn after NO removal are shown in Fig. 1b. The breakthrough working time of ACP-Rn-NO linearly reduced after each regeneration cycle. The ACP-Rn, however, still had a relatively high activity for SO2 removal after five times of regeneration; the 100% SO2 removal time of ACP-R5 was still longer than 8 h. The sulphur capacity of ACP-R5 was 71 mg g−1; which is significantly higher than that for many non-regenerated AC samples reported earlier.25,26 The same variation was reported by Guo et al.; the group found that the desulfurization performance of the used catalyst-sorbent linearly decreased, while its NO removal efficiency clearly improved.27 The excellent NO removal activity and improved desulfurization performance illustrate that the used pyrolusite-modified AC (ACP) synthesized by the blending method is a good low temperature desulfurization and denitrification catalyst.
3.2 Physicochemical analysis of the regenerated ACP
| Samples | SSA (m2 g−1) | MSA (m2 g−1) | Vtot (cm3 g−1) | Vmic (cm3 g−1) | Vmes (cm3 g−1) | Rmean (nm) |
|---|---|---|---|---|---|---|
| a SSA is specific surface area, MSA is micropore surface area, Vtot is total pore volume, Vmic is micropore volume, Vmes is mesopore volume and Rmean is average pore diameter. | ||||||
| ACP | 479 | 385 | 0.277 | 0.186 | 0.091 | 2.31 |
| ACP-R1 | 454 | 362 | 0.257 | 0.179 | 0.079 | 2.37 |
| ACP-R2 | 452 | 377 | 0.275 | 0.186 | 0.088 | 2.48 |
| ACP-R3 | 470 | 393 | 0.287 | 0.194 | 0.093 | 2.49 |
| ACP-R4 | 477 | 397 | 0.289 | 0.196 | 0.093 | 2.38 |
| ACP-R5 | 506 | 415 | 0.294 | 0.205 | 0.089 | 2.37 |
| ACP-R5W | 590 | 490 | 0.327 | 0.234 | 0.093 | 2.25 |
| AC | 458 | 379 | 0.267 | 0.187 | 0.080 | 2.15 |
| AC-IM | 431 | 346 | 0.245 | 0.170 | 0.075 | 2.27 |
| AC-DSC | 502 | 413 | 0.279 | 0.205 | 0.074 | 2.11 |
Our previous study showed that the SSA of pyrolusite-doped AC recovered quickly and then continuously increased for more than 10 reusing cycles.19 The slower recovery rate in this study is attributed to the higher blending ratio of pyrolusite; the 10.0 wt% blending ratio of pyrolusite is 2.5 times higher than the sample used in our previous study (4.0 wt%). This indicates that there was higher metal sulphate formation when the ACP was used for SO2 removal. To confirm this deduction, ACP-R5 was washed using deionized water (labelled as ACP-R5W). The BET analysis shows that the SSA and Vtot of ACP-R5W (590 m2 g−1 and 0.327 cm3 g−1) were dramatically higher than that of ACP-R5 (506 m2 g−1 and 0.294 cm3 g−1). The Vmes of ACP-R5W (0.093 cm3 g−1) conformed with our previous result, indicating that the reaction between the sulphur acid and carbon at 500 °C only formed some content of micropore structure, and there was no clear pore diameter expansion during the regeneration. In addition, increased micropore volume caused the reduction of Rmean of ACP-R5W (2.25 nm).
Corroboration of the NO removal activity of regenerated ACP and their structure properties suggests that the SSA and pore structure were not the limiting factors for NO removal because the NO conversion of ACP-R1 and ACP-R2 were significantly higher than that of ACP although their structure properties are worse. The variation of the desulfurization and denitrification could be primarily controlled by their surface chemical properties, such as modification of the functional groups and metals, which would be discussed in the following section.
To evaluate the variation of surface oxygen-containing functional groups, the binding energy (BE) and relative content (RCs) of ACP and ACP-Rn corresponding to the C 1s spectra (Fig. S4†) are calculated. As summarized in Table 3, the RCs of C–C bond on the surface of catalyst-sorbent reduced gradually from 1st to 4th regeneration cycle, and then showed a slight increment with further reuse. However, the content of C![[double bond, length as m-dash]](https://www.rsc.org/images/entities/char_e001.gif) O and π–π* transition peak was higher than that of ACP even though ACP-R5 showed a reduction compared with ACP-R4. The RCs of the C–O group initially increased, and then reduced with the number of regeneration cycles; ACP-R3 had the highest content of C–O at 20.87%. In general, the RCs of oxygen-containing functional groups of ACP-Rn were higher than those of ACP, which is primarily attributed to the high temperature carbon acid reaction, i.e., C + H2SO4 → CO + CO2 + SO2 + H2O and the pyrolysis of oxygen containing macromolecules during the regeneration.29,30 On comparing ACP/ACP-Rn before and after NO removal, it was found that the RCs of C–C showed a certain reduction when the ACP/ACP-Rn was used for NO removal, while the RCs of C–O, C
O and π–π* transition peak was higher than that of ACP even though ACP-R5 showed a reduction compared with ACP-R4. The RCs of the C–O group initially increased, and then reduced with the number of regeneration cycles; ACP-R3 had the highest content of C–O at 20.87%. In general, the RCs of oxygen-containing functional groups of ACP-Rn were higher than those of ACP, which is primarily attributed to the high temperature carbon acid reaction, i.e., C + H2SO4 → CO + CO2 + SO2 + H2O and the pyrolysis of oxygen containing macromolecules during the regeneration.29,30 On comparing ACP/ACP-Rn before and after NO removal, it was found that the RCs of C–C showed a certain reduction when the ACP/ACP-Rn was used for NO removal, while the RCs of C–O, C![[double bond, length as m-dash]](https://www.rsc.org/images/entities/char_e001.gif) O and π–π* transition peak mildly increased alternatively. This could be attributed to the adsorbed oxygen, which transformed to radical oxygen and expressed as the increment of oxygen-functional groups. It was reported that the catalytic activity for NOx and SO2 removal of AC-based catalyst could be improved with the increase in the surface oxygen-containing functional groups,28,31 and it also proved to be the controlling factor for the SO2 removal of the pyrolusite-doped AC.19 The linearly reduced desulfurization performance of ACP-Rn was primarily due to its large content of metal sulphate dispersed on the surface, which limited the catalytic oxidation of SO2 on the surface of catalyst-sorbent.21
O and π–π* transition peak mildly increased alternatively. This could be attributed to the adsorbed oxygen, which transformed to radical oxygen and expressed as the increment of oxygen-functional groups. It was reported that the catalytic activity for NOx and SO2 removal of AC-based catalyst could be improved with the increase in the surface oxygen-containing functional groups,28,31 and it also proved to be the controlling factor for the SO2 removal of the pyrolusite-doped AC.19 The linearly reduced desulfurization performance of ACP-Rn was primarily due to its large content of metal sulphate dispersed on the surface, which limited the catalytic oxidation of SO2 on the surface of catalyst-sorbent.21
| Samples | C–C | C–O | C![[double bond, length as m-dash]](https://www.rsc.org/images/entities/char_e001.gif) O O |
π–π* | ||||
|---|---|---|---|---|---|---|---|---|
| BE (eV) | RC (%) | BE (eV) | RC (%) | BE (eV) | RC (%) | RC (%) | BE (eV) | |
| ACP | 284.63 | 70.34 | 285.90 | 19.09 | 287.61 | 6.18 | 289.97 | 4.39 |
| ACP-NO | 284.64 | 68.56 | 285.73 | 19.75 | 28.15 | 6.24 | 289.47 | 5.45 |
| ACP-R1 | 284.65 | 69.95 | 285.80 | 18.02 | 287.32 | 7.08 | 289.49 | 4.96 |
| ACP-R1-NO | 284.65 | 67.87 | 285.79 | 19.59 | 287.14 | 7.10 | 289.16 | 5.43 |
| ACP-R2 | 284.63 | 67.08 | 285.93 | 19.06 | 287.39 | 8.84 | 289.40 | 5.03 |
| ACP-R2-NO | 284.60 | 64.57 | 285.98 | 20.03 | 287.70 | 9.26 | 289.76 | 6.14 |
| ACP-R3 | 284.67 | 65.45 | 285.87 | 19.87 | 287.35 | 9.19 | 289.23 | 5.49 |
| ACP-R3-NO | 284.60 | 63.98 | 285.74 | 21.03 | 287.32 | 9.00 | 289.52 | 6.00 |
| ACP-R4 | 284.64 | 65.16 | 286.03 | 18.81 | 287.51 | 9.56 | 289.57 | 6.47 |
| ACP-R4-NO | 284.67 | 63.74 | 286.03 | 20.10 | 287.36 | 9.27 | 289.37 | 6.89 |
| ACP-R5 | 284.63 | 69.14 | 285.94 | 18.83 | 287.59 | 6.24 | 289.16 | 5.79 |
| ACP-R5-NO | 284.66 | 67.28 | 285.92 | 20.76 | 287.42 | 6.02 | 289.28 | 5.95 |
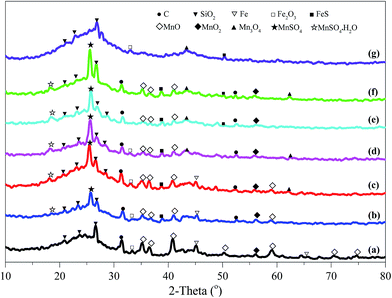 | ||
| Fig. 2 XRD patterns of cyclically regenerated activated coke. (a) ACP, (b) ACP-R1, (c) ACP-R2, (d) ACP-R3, (e) ACP-R4, (f) ACP-R5, (g) ACP-R5W. | ||
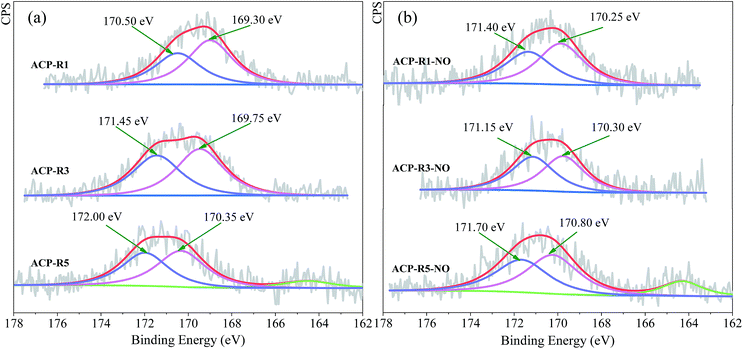
The chemical properties of Mn and Fe were further confirmed by XPS analysis, and high-resolution Mn 2p and Fe 2p spectra as depicted in Fig. S5.† The metal chemistry of ACP-Rn changed slightly with continuous application. The peaks of ACP-Rn at around 642.00–642.50 eV and 710.50–711.50 eV were consistent with those of Mn2+ of MnSO4 (ref. 20) and Fe2+ of FeSO4,33 respectively. The unclear binding energy shift of Mn 2p and Fe 2p of ACP-Rn is attributed to the presence of large quantity of metal sulphates, which covered the new exposed metal oxides after regeneration. Fig. 3 shows the high-resolution spectrum of sulphur in ACP-Rn to corroborate the metal chemistry. ACP-Rn showed doublet peaks in the BE range of 169.30–172.00 eV, which is normally associated with those of SO42−.34 The relative higher binding energy was due to the large amount of metal sulphate;35 the increase in binding energy with the increase in number of regeneration cycles, 170.50 of ACP-R1, 171.45 of ACP-R3 and 172.00 eV of ACP-R5 (Fig. 4a), is good evidence to affirm the above hypothesis.
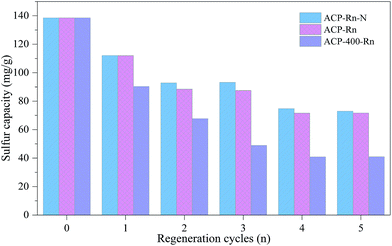 | ||
| Fig. 4 Sulphur removal capacity of ACP-400-Rn and ACP-Rn before and after denitrification, and before desulfurization. | ||
The comparison of ACP-Rn before and after denitrification suggests that the right B.E. peak shifted to a higher binding energy, while the that on the left reduced slightly after the denitrification except for ACP-R1-NO (Fig. 4b). This could be due to the NO, NH3 and O2 adsorption during the NO removal, but this is just a hypothesis and needs a further discussion. In addition, there was no XPS peak corresponding to S2− (Fig. 3), which could be due to its low content and uniform distribution; also the large content of sulphate covered the surface completely. However, a new peak for ACP-R5 and ACP-R5-NO at 164.55 and 164.30 eV, respectively, shows the presence of elemental sulphur.36 Klinzing et al. had reported that carbon could react with SO2 to form the elemental sulphur (C + SO2 → S2 + CO2).37 Therefore, whether the metals accelerate this reaction needs to be studied further.
3.3 The reciprocities between denitrification and desulfurization process
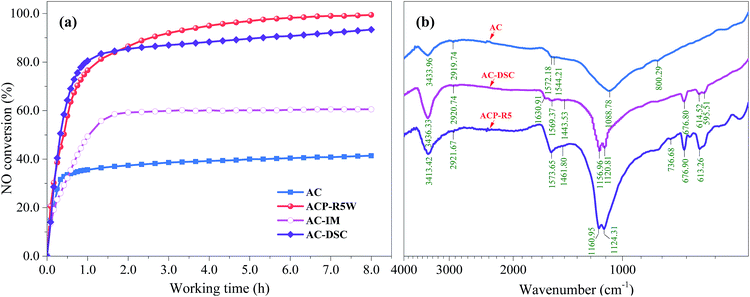
To further discuss the variation of NO removal activity of AC-Rn, ACP-R5W was also applied for NO removal. Fig. 5a shows that the NO removal efficiency of ACP-R5W was 99.4%, which was only slightly different compared with ACP-R5; also, the activity hysteresis inevitably weakened. Due to the trace metals on the surface of ACP-R5W (Fig. 2g), the dilute sulphuric acid treated AC (AC-DSC) was prepared to simulate the surface chemistry of regenerated AC. The NO removal efficiency of AC-DSC was 93.4% (Fig. 5a), which is 53.0% and 32.9% higher than that of fresh AC (40.4%) and AC-IM (60.5%), respectively. These results indicate that the improvement of NO removal activity of regenerated ACP was due to the synergistic effect of surface chemistry and metal sulphates, but the surface chemistry played a prominent role for NO reduction than that of metal salts.
It has been reported in literature that sulphur-containing species promote the NO conversion of AC effectively, which could reduce the energy barrier of the catalytic oxidation of SO2.39 Therefore, the FTIR characterization of AC, AC-DSC and AC-R5 were carried out and the resultant spectra are depicted in Fig. 5b. It could be observed that there were two new peaks of AC-DSC and ACP-R5 detected at the wavenumber range from 600.00 to 680.00 cm−1. The peaks at 614.52 and 613.26 cm−1 of AC-DSC and AC-R5 attributed to the symmetric and asymmetric stretching vibration of S–O or S![[double bond, length as m-dash]](https://www.rsc.org/images/entities/char_e001.gif) O in sulphate ion,40 while the peaks located at 676.80 cm−1 of AC-DSC and 676.90 cm−1 of ACP-R5 attributed to the O
O in sulphate ion,40 while the peaks located at 676.80 cm−1 of AC-DSC and 676.90 cm−1 of ACP-R5 attributed to the O![[double bond, length as m-dash]](https://www.rsc.org/images/entities/char_e001.gif) C
C![[double bond, length as m-dash]](https://www.rsc.org/images/entities/char_e001.gif) O bond.41 Furthermore, the peaks around 1570.00 cm−1 of the AC-DSC and ACP-R5, attributed to the asymmetric stretching vibration of C
O bond.41 Furthermore, the peaks around 1570.00 cm−1 of the AC-DSC and ACP-R5, attributed to the asymmetric stretching vibration of C![[double bond, length as m-dash]](https://www.rsc.org/images/entities/char_e001.gif) O, had higher intensity.28 Such variation of surface chemistry could partially explain the improvement of NO removal by regenerated ACP.
O, had higher intensity.28 Such variation of surface chemistry could partially explain the improvement of NO removal by regenerated ACP.
4. Conclusion
Continuous denitrification, desulfurization and regeneration of ACP showed that the NO removal application before desulfurization had almost no influence on the SO2 removal of sample even though the surface functional groups of ACP showed a variation after NO removal. The denitrification property of ACP, however, was significantly improved after the followed desulfurization and regeneration. The NO removal efficiency of ACP-Rn increased from 74.2% to almost 100% after three cycles of regeneration, and then remained relatively stable. The N2 selectivities were higher than 90.2% for all samples. Metal sulphates (MnSO4 and Fe2(SO4)3), showed catalytic activity for SCR NO removal. The synergistic effect of metal sulphates and surface functional groups improved the SCR NO removal of ACP even though the later one was proved to be more important. However, large quantity of metal sulphate restricted the migration of reactants molecular (i.e. NO, NH3, SO2 and O2), leading to the reduction in desulfurization activity and the hypothesis of NO conversion at beginning.Conflicts of interest
There are no conflicts to declare.Acknowledgements
This project is financially supported by the National Natural Science Foundation of China (Project No. 51378324).Notes and references
- I. Mochida, Y. Korai, M. Shirahama, S. Kawano, T. Hada, Y. Seo, M. Yoshikawa and A. Yasutake, Carbon, 2000, 38, 227–239 CrossRef CAS.
- M. Tao, L. Chen, L. Su and J. Tao, J. Geophys. Res.: Space Phys., 2012, 117, 48–50 Search PubMed.
- W. Li, S. Zhou, X. Wang, Z. Xu, C. Yuan, Y. Yu, Q. Zhang and W. Wang, J. Geophys. Res.: Space Phys., 2011, 116, D09301 Search PubMed.
- S. Ding, Y. Li, T. Zhu and Y. Guo, J. Environ. Sci., 2015, 34, 37–43 CrossRef PubMed.
- C. Lu and M. Wey, Fuel Process. Technol., 2007, 88, 557–567 CrossRef CAS.
- Y. Wang, Z. Huang, Z. Liu and Q. Liu, Carbon, 2004, 42, 445–448 CrossRef CAS.
- Y. Lee, H. Kim, J. Park, B. Choi, D. Choi and J. Park, Carbon, 2003, 41, 1881–1888 CrossRef CAS.
- P. Davini, Carbon, 2001, 39, 2173–2179 CrossRef CAS.
- Y. Zhao, R. Hao, T. Wang and C. Yang, Chem. Eng. J., 2015, 273, 55–65 CrossRef CAS.
- G. O. David, K. Tsuji and I. Shiraishi, Fuel Process. Technol., 2000, 65–66, 393–405 Search PubMed.
- X. Gao, S. Liu, Y. Zhang, Z. Luo and K. Cen, J. Hazard. Mater., 2011, 188, 58–66 CrossRef CAS PubMed.
- Y. Zhao, Y. Han and C. Chen, Ind. Eng. Chem. Res., 2012, 51, 480–486 CrossRef CAS.
- Y. Guo, Z. Liu, J. Wang, X. Xing and Z. Lei, J. Fuel Chem. Technol., 2008, 36, 36–41 CAS.
- K. Tsuji and I. Shiraishi, Fuel, 1997, 76, 549–553 CrossRef CAS.
- C.-M. Yang and K. Kaneko, J. Colloid Interface Sci., 2002, 255, 236–240 CrossRef CAS PubMed.
- L. Yang, T. Huang, X. Jiang, J. Li and W. Jiang, RSC Adv., 2016, 6, 55135–55143 RSC.
- L. Yang, X. Jiang, T. Huang and W. Jiang, Environ. Technol., 2015, 36, 2847–2854 CrossRef CAS PubMed.
- L. Yang, W. Jiang, L. Yao, X. Jiang and J. Li, J. Chem. Technol. Biotechnol., 2017 DOI:10.1002/jctb.5418.
- L. Yang, X. Jiang, W. Jiang, P. Wang and Y. Jin, Energy Fuels, 2017, 31, 4556–4564 CrossRef CAS.
- J. Guo, Y. Qu, S. Shu, X. Wang, H. Yin and Y. Chu, New J. Chem., 2015, 39, 5997–6015 RSC.
- L. Yang, X. Jiang, Z.-S. Yang and W.-J. Jiang, Ind. Eng. Chem. Res., 2015, 54, 1689–1696 CrossRef CAS.
- H. Guedidi, L. Reinert, J. Lévêque, Y. Soneda, N. Bellakhal and L. Duclaux, Carbon, 2013, 54, 432–443 CrossRef CAS.
- A. Boyano, M. E. Gálvez, R. Moliner and M. J. Lázaro, Fuel, 2008, 87, 2058–2068 CrossRef CAS.
- S. Yang, F. Qi, S. Xiong, H. Dang, Y. Liao, P. K. Wong and J. Li, Appl. Catal., B, 2016, 181, 570–580 CrossRef CAS.
- J. Li, N. Kobayashi and Y. Hu, J. Environ. Eng., 2007, 2, 740–751 CrossRef.
- K. Jastrząb, Fuel Process. Technol., 2012, 101, 16–22 CrossRef.
- Y. Guo, Z. Liu, Q. Liu and Z. Huang, Catal. Today, 2008, 131, 322–329 CrossRef CAS.
- K. Tsuji and I. Shiraishi, Fuel, 1997, 76, 555–560 CrossRef CAS.
- K. Jastrząb, Fuel Process. Technol., 2012, 104, 371–377 CrossRef.
- Z. Yan, L. Liu, Y. Zhang, J. Liang, J. Wang, Z. Zhang and X. Wang, Energy Fuels, 2013, 27, 3080–3089 CrossRef CAS.
- C. Moreno, F. J. Maldonado and C. A. F. Pérez, Langmuir, 2003, 19, 5650–5655 CrossRef.
- S. Mitsubishi, T. Seto, S. Mitsuoka and K. Inoue, European Pantent, EP0377483, 1990.
- M. Descostes, F. Mercier, N. Thromat, C. Beaucaire and M. Gautier-Soyer, Appl. Surf. Sci., 2000, 165, 288–302 CrossRef CAS.
- V. Hayez, A. Franquet, A. Hubin and H. Terryn, Surf. Interface Anal., 2004, 36, 876–879 CrossRef CAS.
- C. Sun, Phys. Rev. B: Condens. Matter Mater. Phys., 2004, 69, 1129–1133 Search PubMed.
- E. Morris, C. Jia and K. Morita, Ind. Eng. Chem. Res., 2010, 49, 12709–12717 CrossRef CAS.
- G. Klinzing and R. Walker, Fuel, 1984, 63, 1450–1454 CrossRef CAS.
- J. M. Rosas, R. Ruiz-Rosas, J. Rodríguez-Mirasol and T. Cordero, Chem. Eng. J., 2017, 307, 707–721 CrossRef CAS.
- Z. Zhu, Z. Liu, H. Niu and S. Liu, J. Catal., 1999, 187, 245–248 CrossRef CAS.
- K. Saravanan, B. Tyagi and H. C. Bajaj, Catal. Sci. Technol., 2012, 2, 2512–2520 CAS.
- P. Rowe, S. Neshyba and V. Walden, Opt. Express, 2011, 19, 5451–5463 CrossRef PubMed.
- Y. Guo, Z. Liu, Y. Li and Q. Liu, J. Fuel Chem. Technol., 2007, 35, 344–348 CrossRef CAS.
Footnote |
| † Electronic supplementary information (ESI) available: Fig. S1 the diagram of the denitrification and desulfurization system. Fig. S2 the N2 adsorption–desorption curves of the ACP and ACP-Rn. Fig. S3 the wide-scan XPS spectrums of the ACP-Rn. Fig. S4 the C 1s curves deconvolution of the ACP and ACP-Rn before and after NO removal. Fig. S5 the Mn 2p and Fe 2p curves deconvolution of the ACP and ACP-Rn before and after denitrification. Fig. S6 the NO removal curves of the ACP-400-Rn. See DOI: 10.1039/c7ra11720e |
| This journal is © The Royal Society of Chemistry 2018 |

