 Open Access Article
Insight into the synergism between MnO2 and acid sites over Mn–SiO2@TiO2 nano-cups for low-temperature selective catalytic reduction of NO with NH3†
Siyi Zhenga,
Lei Songa,
Siyang Tang a,
Changjun Liuab,
Hairong Yue
 *a and
Bin Liangab
aMulti-phases Mass Transfer and Reaction Engineering Laboratory, School of Chemical Engineering, Sichuan University, Chengdu 610065, China. E-mail: hryue@scu.edu.cn; Fax: +86 22 85997677; Tel: +86 22 85997677
bInstitute of New Energy and Low-Carbon Technology, Sichuan University, Chengdu 610207, China
First published on 9th January 2018
Abstract
The rational synthesis of low-temperature catalysts with high catalytic activity and stability is highly desirable for the selective catalytic reduction of NO with NH3. Here we synthesized a Mn–SiO2/TiO2 nano-cup catalyst via the coating of the mesoporous TiO2 layers on SiO2 spheres and subsequent inlay of MnO2 nanoparticles in the narrow annulus. This catalyst exhibited superior catalytic SCR activities and stability for low-temperature selective catalytic reduction of NO with NH3, with NO conversion of ∼100%, N2 selectivity above 90% at a temperature ∼140 °C. The characterization results, such as BET, XRD, H2-TPR, O2/NH3-TPD and XPS, indicated that this nano-cup structure catalyst possesses high concentration and dispersion of Mn4+ active species, strong chemisorbed O− or O22− species and highly stable MnOX active components over the annular structures of the TiO2 shell and SiO2 sphere, and thus enhanced the low-temperature SCR performance.
1. Introduction
The combustion of fossil fuels, i.e., coal, petroleum and natural gas in stationary and mobile sources generates massive NOX emissions in the world, which gives rise to serious environmental problems such as the formation of acid rain, haze, photochemical smog and the depletion of ozone.1–6 The selective catalytic reduction (SCR) of NOX with NH3 is a crucial methodology for the reduction of NOX emissions from stationary sources, such as coal-fired power plants, because of its low cost and high efficiency. The current technologies for the industrial SCR processes primarily employ commercial V-based catalysts and operate at temperatures of 300–400 °C.7–9 There are some key issues for the high-temperature SCR process, such as obligatory placement of the catalysts in the upstream of the electrostatic precipitator and desulfurizer, catalytic deactivation by SO2 or fly ash, and the generation of N2O at high temperature.10–13 In addition, the toxicity of V-based catalysts is detrimental to the environment and human-beings. Therefore, the rational design and development of excellent and green catalysts at low temperature is vital for the SCR of NOX with NH3.The transitional mental oxides, including FeOX, CeO2, NiO, CuO and MnOX have been extensively investigated for the SCR reaction at the temperature below 300 °C.8,14–16 The MnOX based catalysts possess excellent low-temperature activity and environmentally benign property, and were regarded as excellent candidates for the industrial application in SCR reaction.17–23 The strong redox property of Mn4+ as the dominant valence species and the low crystallinity of MnOX nanopartilces in MnO2 catalysts is crucial to promote the oxidation of NO to NO2 and lead to an excellent low-temperature NH3-SCR activity.24–27 Pena et al. found that the MnOX catalysts with different valence states and labile oxygen contributed to the excellent SCR performance in a low temperature of 120 °C. The presence of chemisorbed oxygen, which is more active than the lattice oxygen, could also facilitate the oxidation of NO for the formation of nitrates and result in a high NO conversion.28–31
In addition, the catalyst support with Brønsted and/or Lewis acid sites was verified to enhance the adsorption of NH3 through three hydrogen bonds, and thus facilitate the low-temperature NH3-SCR reaction. Recently, Boningari et al. reported the NH3-SCR reaction mechanism over Mn-based catalysts via the correlation of activity with the acidity, manganese oxide valence state and morphology.32 The results indicated that the high dispersion of MnOX and appropriate surface acidity play a synergistic effect on the SCR reaction. TiO2 is a widely used catalyst support for its stable chemical properties and environmental friendliness, especially the excellent resistance of SO2 for the SCR reaction in the industrial flue gas.12,16,33,34 The nature of TiO2, such as facet, shape and acid sites, also plays an essential role in the catalytic activities and long-term stability.35,36 Deng et al. reported that MnOX/TiO2 catalyst with a preferentially anatase TiO2 facet facilitated high NO conversion and low N2O selectivity at 80–280 °C.37 Zhang et al. reported that the fabrication of core–shell nanomaterials could stabilize the active species and enhance stability.38 Therefore, the rational synthesis of TiO2 supported Mn catalysts with unique morphologies and surface chemistry for the high efficiency and stability is vital for the catalytic SCR reaction.24,39–41
Herein, a novel Mn–SiO2@TiO2 nano-cup catalyst was synthesized via the coating of the mesoporous structured anatase TiO2 layers on the SiO2 spheres and subsequent inlay of MnO2 nanoparticles (NPs) in the narrow annulus. The chemical etching method was introduced to tune the structures of TiO2 layers and the size of SiO2 nano-spheres, aiming at the fabrication of highly dispersed MnO2 NPs and appropriate acid sites for SCR reaction. The catalysts were systematically investigated to understand surface chemistry as well as the evolution of structures and active sites. The synergic mechanism between MnO2 and acid sites over the TiO2@SiO2 support for low-temperature SCR reaction was also proposed on the basis of the experimental results.
2. Experimental section
2.1 Catalysis preparation
2.2 Characterizations
To observe the morphologies and the structures of the samples, the field emission scanning electron microscopy (SEM, JEM-7500F, Japan JEOL) was introduced to obtain the microstructure of the catalysts. The N2 adsorption isotherm of the catalysts was obtained on ASAP 2460 (Micromeritics, USA) at −197 °C. The specific surface area was calculated based on the standard Brunauer–Emmett–Teller (BET) theory, while the pore volume and pore-size distribution using the Barrett–Joyner–Halenda (BJH) method. The powder X-ray diffraction (XRD) pattern was recorded on a Bruker D8 Advance diffractometer with CuKα radiation to investigate the crystallographic phase of the samples with a 2θ range of 10–80° and a step size of 0.026°. Inductively coupled plasma (ICP) method was used to determine the chemical composition of catalysts on a Varian Vista Axial instrument. To obtain the chemical states of catalysts elements on their surface, X-ray photoelectron spectroscopy (XPS) measurement was applied on the Thermo Fisher Scientific K-Alpha instrument with monochromatic Al Kα radiation.The surface acidity of the catalysts was detected using the temperature-programmed desorption of ammonia (NH3-TPD) on a Quantachrome Autosorb-IQ-C chemisorption analyser. The sample powders were firstly pre-treated in pure He at 300 °C for 1 h and then cooled down to 80 °C. The catalysts were constantly saturated in anhydrous NH3 (10% in He) at a flow rate of 30 mL min−1 for 30 min and the physical adsorption of NH3 was removed by He for 30 min. Finally, the desorption was carried out by heating the samples from 80 to 650 °C at a heat rate of 10 °C min−1. The oxygen temperature-programmed desorption (O2-TPD) and H2 temperature-programmed reduction (H2-TPR) were also performed on the Quantachrome Autosorb-IQ-C chemisorption analyser. For the O2-TPD experiment, 0.1 g sample was firstly pre-treated in pure He at 250 °C for 30 min and then cooled down to 50 °C. Then the samples were treated under pure oxygen for 1 h and the oxygen desorption was carried out by heating the sample from 50 °C to 750 °C. For H2-TPR experiment, 0.05 g of catalyst sample was pre-treated at 200 °C in pure Ar for 1 h and then cooled down to room temperature. Then the tests were conducted under 10% H2/Ar at a heat rate of 10 °C min−1 from room temperature to 800 °C. The signal of H2, O2 and NH3 was recorded by the thermal conductivity detector (TCD).
2.3 Activity test
The catalytic activity was tested in a fixed-bed stainless steel flow reactor (i.d. = 8 mm) at atmospheric pressure. The reaction conditions were set as follows: 0.21 g of catalyst, 1000 ppm NH3, 1000 ppm NO, 5 vol% O2, N2 as the balance, and the total gas flow rate was 200 mL min−1, and the gas hourly space velocity (GHSV) was 30![[thin space (1/6-em)]](https://www.rsc.org/images/entities/char_2009.gif) 000 h−1. The concentrations of NO and NO2 were measured by a Laoying 3022 Flue Gas Analyser, and the N2O was monitored by a ThermoStar Mass Spectroscope Analyser.
000 h−1. The concentrations of NO and NO2 were measured by a Laoying 3022 Flue Gas Analyser, and the N2O was monitored by a ThermoStar Mass Spectroscope Analyser.
All activity data was recorded after 60 min when the reaction condition was steady. The NOX conversion and N2 selectivity were calculated by:42
 | (1) |
 | (2) |
3. Results and discussion
3.1 The formation and the morphologies of the catalysts
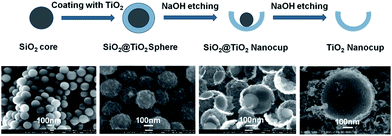
The formation of Mn–SiO2@TiO2 nano-cup catalysts involved the preparation of the TiO2 or SiO2@TiO2 nano-cups and subsequent inlay of MnO2 NPs in the narrow annulus using ultrasonic impregnation. As shown in Fig. 1, the spherical SiO2 template was first synthesized via the hydrolysis of TEOS, and the TiO2 shell on the SiO2 spheres was formed by the hydrolysis of tetrabutyl titanate. The amorphous TiO2 shell was transformed into the anatase phase in the calcination process at 500 °C. Then the SiO2@TiO2 nano-spheres were put into the NaOH solution for different time to partly remove the SiO2 core and TiO2 layer. The corresponding SEM images in Fig. 2 showed that the surface of SiO2 spheres is pretty smooth, while the surface of SiO2@TiO2 is rather rough, indicating the TiO2 was perfectly clad around the SiO2 spheres. After 1.5 h etching treatment with NaOH, the SiO2@TiO2 samples showed small opening holes on the TiO2 outer layer encapsulated with SiO2 spheres. The increase of etching time enlarged the opening holes and reduced the inside SiO2 core as nano-cup structures at 2.5 h. Further increase of the etching time will lead to disappear of inner SiO2 core at about 3 h. The formed well-defined nanocups are with uniform diameter size of about 300 ± 10 nm. The etched samples possess larger specific surfaces (93.16 m2 g−1 at 2.5 h) compared with the no etching SiO2@TiO2 samples (40.25 m2 g−1). The large pores and specific surface of the nano-cups could ensure the MnO2 active species loaded on the support with a high dispersion, and facilitate the adsorption of NH3 on the surface for the SCR reaction. Therefore, the MnO2 species were uniformly and well deposited on the surface of the SiO2@TiO2 and TiO2 nano-cups, and no obvious agglomerates was observed from the SEM images of the MnO2 loaded samples in Fig. 2.The physical properties of Mn-based catalysts were listed in Table 1. The results showed a much small surface area for the Mn/SiO2 (20.3 m2 g−1) and Mn–SiO2@TiO2 (35.9 m2 g−1) samples, and small pore volume of Mn/SiO2 catalyst (0.072 cm3 g−1). But the Mn–SiO2@TiO2 nano-cup catalysts possessed large BET surface areas, with the largest BET surface of 89.98 m2 g−1 and pore volume of 0.22 cm3 g−1 for the Mn–SiO2@TiO2-2.5 catalyst. The further extension of the etching time led to a decrease of specific surface area. The average pore diameter of all the catalysts is about 10–14 nm. It was suggested that larger surface area and appropriate pore diameter (e.g., >3 nm) were beneficial to the NH3 adsorption and the SCR performance.43
| Samples | SSAa (m2 g−1) | Pore volumea (cm3 g−1) | Pore diametera (nm) | Mnb (wt%) | Rate constantc |
|---|---|---|---|---|---|
| a Specific surface area (SSA) and pore volume by N2-adsorption method.b Mn content of the catalysts quantified by ICP-OES.c Pseudo-first order rate constant at 140 °C. | |||||
| Mn/SiO2 | 20.34 | 0.072 | 14.17 | 13.45% | 3.00 × 10² |
| Mn–SiO2@TiO2 | 35.91 | 0.118 | 13.18 | 12.67% | 9.83 × 10² |
| Mn–SiO2@TiO2-1.5 | 69.86 | 0.190 | 11.43 | 13.85% | 5.24 × 10² |
| Mn–SiO2@TiO2-2.5 | 89.98 | 0.223 | 10.18 | 14.76% | 1.90 × 10³ |
| Mn–SiO2@TiO2-3 | 77.05 | 0.214 | 11.22 | 14.22% | 1.48 × 10³ |
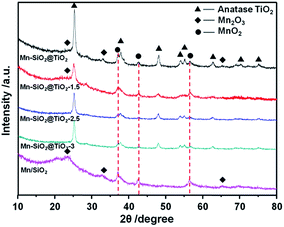
The XRD patterns of the catalysts were shown in Fig. 3. The diffraction peak of the anatase TiO2 was detected in all the samples. The increase of the etching time weaken the peaks of anatase TiO2, suggesting that the etching treatment could result in a lower crystallinity of TiO2 layer. In addition, the strong peaks of MnO2 and Mn2O3 were detected in the Mn–SiO2, Mn–SiO2@TiO2, Mn–SiO2@TiO2-1.5 catalysts. While in the Mn–SiO2@TiO2-2.5 and Mn–SiO2@TiO2-3 catalysts, the intensities of MnO2 were much lower, indicating the highly dispersed MnOX species as amorphous phase over the two catalysts. The high concentration and high dispersion of Mn active species with amorphous phase on the surface were also verified for a superior SCR activity.44–46
The surface chemical states of the catalysts were also examined and the results were listed in Table 2 and Fig. 4. The results showed that the surface concentrations of Mn species decreased with the increase of the chemical etching time. This could be attributed to the enhanced surface permeability of the support via chemical etching, which enabled more Mn species into the inside of the spherical structures.
| Samples | Mn (%) | O (%) | Mn4+ (%) | Si–O + Oβ/(Oα + Oβ) (%) | Mn4+ (%) |
|---|---|---|---|---|---|
| Mn/SiO2 | 5.03 | 66.77 | 39.96 | 87.32 | 2.00 |
| Mn–SiO2@TiO2 | 10.8 | 65.58 | 51.57 | 39.26 | 5.56 |
| Mn–SiO2@TiO2-1.5 | 6.85 | 66.88 | 26.22 | 54.97 | 1.80 |
| Mn–SiO2@TiO2-2.5 | 6.52 | 65.85 | 60.64 | 61.38 | 3.97 |
| Mn–SiO2@TiO2-3 | 5.46 | 66.91 | 50.90 | 51.43 | 2.78 |
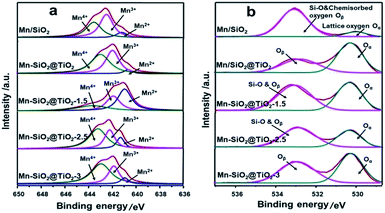
The XPS spectra of Mn 2p3/2 in Fig. 4(a) clearly showed the Mn 2p3/2 peaks at about 642.0 eV.25 The peak could be separated into three overlapped peaks of Mn2+, Mn3+ and Mn4+, respectively. The relative ratio of Mn4+ via deconvolution over the catalysts was summarized in Table 2. The Mn4+ content over Mn–SiO2@TiO2-2.5 catalyst is the highest among the other catalysts, which could be attributed to the high dispersion of Mn species on the catalyst. According to previous report, the redox process of Mn4+ species was of utter importance in low-temperature SCR with NH3.26 High Mn4+ content could promote the oxidation process of NO to NO2 and facilitate the “fast SCR” reaction, and thus enhance the low-temperature catalyst activity.47 The surface contents of Mn4+ species on Mn/SiO2 and Mn–SiO2@TiO2-1.5 catalyst are 39.96% and 26.22%, respectively, which is much lower than the other catalysts.
The O 1s XPS spectra of the catalysts were presented in Fig. 4(b), which could be separated into two peaks after a peak-fitting deconvolution. The peak at lower binding energy of 530.0 eV could be attributed to the lattice oxygen species Oα (Ti–O), while the peak at higher binding energy of 533–533.5 eV could be assigned to Si–O and chemisorbed oxygen Oβ (mainly O− or O22− belonging to defect-oxide or hydroxyl-like group).48–50 Because of the high mobility, it is evident that the chemisorbed oxygen species are more active than the lattice oxygen species, suggesting the high amount of chemisorbed oxygen species is in favour of the oxidation of NO to NO2 and the subsequent “fast SCR” reaction.51 However, Fig. 4(b) also showed the peak of Oβ overlapped with the peak of Si–O bond in Mn/SiO2, Mn–SiO2@TiO2-1.5 and Mn–SiO2@TiO2-2.5 samples. Although the trend of change in chemisorbed oxygen species could be observed in the XPS spectra, the XPS analysis results are still not adequate to determine the quantitative analysis of the chemisorbed oxygen species, further O2-TPD analysis was needed to confirm the concentration of Oβ over the catalysts.
3.2 O2-TPD of the catalysts
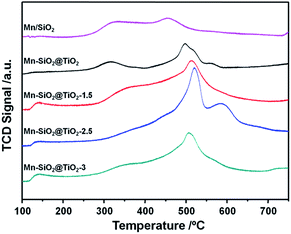
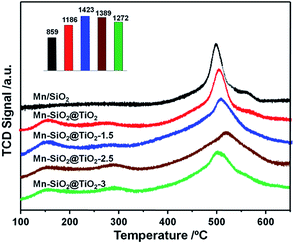
O2-TPD is an effective way to analyse the mobility and quantity of oxygen species, and the results of the oxygen desorption behaviour of the catalysts were shown in Fig. 5. At desorption temperature below 200 °C, the oxygen adsorption peaks could be observed on the Mn–SiO2@TiO2-1.5, Mn–SiO2@TiO2-2.5 and Mn–SiO2@TiO2-3 samples, while no significant desorption peaks on the Mn/SiO2 and Mn–SiO2@TiO2 catalysts. This low-temperature desorption peaks may correspond to the physically adsorbed oxygen or weakly chemically adsorbed oxygen species.52 With the increase of desorption temperature, all samples showed oxygen desorption. The strong peak centred at around 500 °C was observed on all the samples, which could be assigned to strongly chemically absorbed O22− or O− species. These oxygen species are derived from the interaction of MnOX and O2. For the Mn–SiO2@TiO2-2.5 sample, an extra strong peak at around 590 °C suggested the strong interaction between the Mn and Ti species. Moreover, the strongly chemically absorbed oxygen peak at 500 °C of the Mn–SiO2@TiO2-2.5 sample was much higher and sharp than other catalysts, indicating the excellent oxygen adsorption capacity, which may lead to a favourable catalytic SCR reaction.533.3 H2-TPR of the catalysts
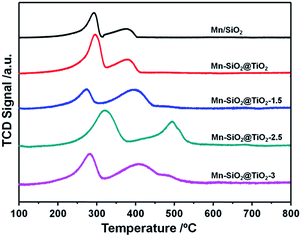
In order to analyse the redox behaviour of the catalysts, H2-TPR was conducted and the results were presented in Fig. 6. For the Mn/SiO2 and Mn–SiO2@TiO2 samples, the two strong reduction peaks at around 295 °C and 400 °C could be assigned to the reduction of MnO2/Mn2O3 to Mn3O4 and the reduction of Mn3O4 to MnO, respectively.1,37 Consequently, the results of TPR analysis agree well with that of XPS results. It is noticeable that the two reduction peaks in the profile of Mn–SiO2@TiO2-2.5 sample moved to a higher temperature. The decrease of reducibility over Mn–SiO2@TiO2-2.5 sample may be ascribed to a much strong interaction of Mn and Ti and good dispersion of surface active species over the catalyst, which will lead to a high stable SCR reaction. And the enhancing interaction of Mn and Ti over this sample could be explained by more Mn species entering into the bulk facet of Mn–SiO2@TiO2-2.5 rather than the surface facet of other catalysts. Moreover, the broader and lager reduction peak of Mn–SiO2@TiO2-2.5 sample than other samples suggested the higher oxygen storage ability and higher Mn4+ content. On the other hand, the Mn–SiO2@TiO2-1.5 sample showed lower reduction peak areas and therefore, only presented inferior SCR performance, especially in the lower temperature range. The H2-TPR results are well in consistent with the O2-TPD and activity results.3.4 NH3-TPD of the catalysts
The adsorption of NH3 species was regarded as a key step in NH3-SCR reaction, which greatly relys on the surface acidity of the catalysts.54 Therefore, the surface acidity of the catalysts were analysed via NH3-TPD, and the results were shown in Fig. 7. There were three main peaks over the Mn–SiO2@TiO2 catalysts except for the Mn/SiO2 sample. The first peak centred at around 150 °C could be assigned to desorption of physical adsorption NH3 and some NH4+ on the weak Brønsted acid sites. The second peak located at around 280 °C could be assigned to NH4+ on the strong Brønsted acid sites. And the third strong peak was a broad NH3 desorption peak from 350–650 °C, which represents the coordinated NH3 species strongly adsorbed onto the Lewis acid sites.55 The calculated areas of Lewis acid sites for Mn–SiO2@TiO2-1.5, Mn–SiO2@TiO2-2.5 and Mn–SiO2@TiO2-3 catalysts were 1423, 1389 and 1272, respectively, suggesting the surface acidity of the these three samples were much higher than that of the Mn/SiO2 and Mn–SiO2@TiO2 catalysts. The calculated areas of the peaks decreased gradually with the increase of the NaOH etching time, which makes sense since the alkaline NaOH would influence the surface acidity.3.5 The catalytic activities and stabilities
The catalyst performance of the NO conversion and the N2 selectivity as the function of reaction temperature were presented in Fig. 8. The catalytic activity of Mn–SiO2@TiO2-1.5 and Mn/SiO2 catalysts were very low in the temperature range of 80–180 °C compared with the other three catalysts, which also showed distinct declination of NOX conversion above 200 °C. Nevertheless, the Mn–SiO2@TiO2, Mn–SiO2@TiO2-2.5 and Mn–SiO2@TiO2-3 catalysts showed significant NO conversion (>80%) when the temperature at 140 °C and exhibited excellent activity in the temperature range of 140–240 °C. The Mn–SiO2@TiO2-2.5 sample achieved NO conversion of 45% at 80 °C and 100% in a wide operation temperature from 150 to 240 °C at the GHSV of 30![[thin space (1/6-em)]](https://www.rsc.org/images/entities/char_2009.gif) 000 h−1. However, the NO conversion of the Mn–SiO2@TiO2-3 catalyst showed much lower than that of Mn–SiO2@TiO2-2.5 catalyst in the low temperature (e.g., <160 °C).
000 h−1. However, the NO conversion of the Mn–SiO2@TiO2-3 catalyst showed much lower than that of Mn–SiO2@TiO2-2.5 catalyst in the low temperature (e.g., <160 °C).
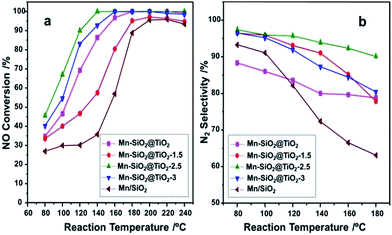 | ||
Fig. 8 The NOX conversion (a), and N2 selectivity (b) of the Mn-based nano-cup catalysts. Reaction conditions: [NO] = [NH3] = 1000 ppm, [O2] = 5%, balance N2, GHSV = 30![[thin space (1/6-em)]](https://www.rsc.org/images/entities/char_2009.gif) 000 h−1. 000 h−1. | ||
The N2 selectivities over the catalysts were illustrated in Fig. 8(b). It is obvious that the N2 selectivity over Mn/SiO2 catalyst dropped sharply during the whole temperature range due to the unselective catalytic oxidation of NH3 on Mn/SiO2 sample.56 The N2 selectivity of Mn–SiO2@TiO2, Mn–SiO2@TiO2-1.5 and Mn–SiO2@TiO2-3 samples dropped to around 80% at temperature of 180 °C. However, for the Mn–SiO2@TiO2-2.5 catalyst, the high N2 selectivity (above 90%) was obtained during the whole operation temperature range indicated that the product of SCR reaction is in favour of N2 and not N2O over the Mn–SiO2@TiO2-2.5 catalyst.
From the characterizations (such as XRD, XPS, O2/NH3-TPD and H2-TPR) above, the Mn–SiO2@TiO2 nano-cup catalyst was demonstrated with a large specific area, highly dispersed MnOX as amorphous phase and high content of surface acidity. These properties are crucial for the SCR reaction. In addition, the Mn–SiO2/TiO2 nano-cup catalyst possesses high concentration of Mn4+ species and oxygen vacancy, which facilitate the activation of NH3 and oxygen chemisorption of NO, and thus enhanced the low-temperature selective catalytic reduction of NO with NH3.
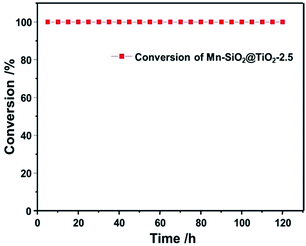
To testify the stability of Mn-based nano-cup catalysts, the long-term stability test of the SCR reaction were performed over Mn–SiO2@TiO2-2.5 catalyst and the results were illustrated in Fig. 9. When the NO conversion reached up to 100% after reaction for 3 h over the Mn–SiO2@TiO2-2.5 catalyst, it showed an excellent SCR stability with a NO conversion stable at a value of 100% during the next 120 h test. The high stability could be attributed to the high dispersion of the MnO2 active sites and the unique annulus structure between mesoporous TiO2 layers and SiO2 sphere for stabilizing the MnO2 nanoparticles. Moreover, we added the characterizations of the 120 h-stability-tested Mn–SiO2@TiO2-2.5 sample using XRD, BET and SEM techniques, respectively. The BET surface of the used catalyst is ca. 64 m2 g−1, which showed a slight decrease compared with the fresh sample. The XRD results (Fig. S1†) showed a low intensity of MnO2 in the used sample, indicating that MnOX species still maintained its high dispersity and stability during the reaction process. Moreover, the SEM image (Fig. S2†) showed that the used catalyst could maintain the morphologies after the long-time reaction. In addition, the impacts of H2O and SO2 on the SCR activity of Mn–SiO2@TiO2-2.5 sample have also been investigated and the results were summarized in Fig. S3.† The results showed that the NO conversion over the Mn–SiO2@TiO2-2.5 decreased from the initial 100% to 90% with the introduction of 5 vol% H2O. However the performance could be recovered after switching off H2O. With the addition of SO2 (200 ppm) for 4 h, the NO conversion declined to about 42% and could not be recovered after switching off SO2. Since the SO3 from the oxidation of SO2 reacts with NH3 to form NH4HSO4 and (NH4)2SO4, they could physically block the active sites and result in the drop of SCR activity. Therefore, the SO2 resistance of manganese-based catalyst at low temperature still needed the further improvement.
3.6 The role of MnO2 species and acidic sites of Mn–SiO2/TiO2 nano-cup catalyst for SCR reaction
On the basis of the characterizations and the catalytic performance of the Mn–SiO2@TiO2 catalysts, both the MnOX species and surface acid sites are playing an essential role in the low-temperature selective catalytic reduction of NO with NH3. Therefore, we proposed a synergism between MnO2 and acid sites over Mn–SiO2@TiO2 nano-cups for low-Temperature SCR reaction and the mechanism was illustrated in Fig. 10.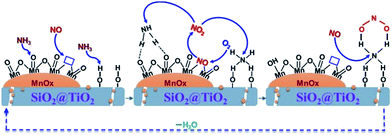 | ||
| Fig. 10 The proposed synergism between MnO2 and acid sites over Mn–SiO2@TiO2 nano-cups for low-Temperature SCR reaction. | ||
At first, the NH3 molecule was absorbed onto the Lewis acid center and the oxygen atoms of the MnO2 sites to form aminooxy groups, while the NO absorbs onto the surface oxygen vacancies as nitrosyls. Second, the absorbed NO would be oxidized to gas-phase NO2 in the presence of gas-phase oxygen and oxygen vacancies were recovered.57,58 The SCR reaction happened between aminooxy groups and gas-phase NO2 to produce N2 and H2O via the surface dehydroxylations and re-oxidation of oxygen vacancies. At the same time, NH3 molecule could be adsorbed onto the neighboring Brønsted acid sites on the SiO2@TiO2 support. The adsorbed NH3 would react with NO2 to form an active complex. This step may include NO oxidation to NO2 or diffusion of NO2 to adsorbed NH3 if significant gas-phase NH3 is present. The oxidation of NO to NO2 plays an important role in NH3-SCR reaction through “fast SCR” pathway: NO + NO2 + 2NH3 → 2N2 + 3H2O.59 The NO oxidation of Mn–SiO2@TiO2-2.5 was tested and demonstrated in Fig. S5† and NO-TPD analysis was also performed to investigate the adsorption behavior of NO over the five catalyst samples and the results are shown in Fig. S6.† The formed active complex will react rapidly with NO or NO2 to form N2/N2O and H2O. Then the catalyst surface was recovered and the SCR reaction process cycles. It is possible that the interactions with other NH3 molecules will enhance the decomposition process and facilitates the new SCR cycles. From the proposed synergetic mechanism, the superior NO conversion and N2 selectivity over the Mn–SiO2@TiO2-2.5 catalyst could be attributed to its higher concentration of Mn4+ and Lewis acid sites, as well as the higher oxygen storage ability. The inferior N2 selectivity of Mn/SiO2 sample might result from the subsequent formation of surface nitrate groups since the NO2 could react rapidly with the active complex to generate N2O.
4. Conclusions
A novel Mn–SiO2@TiO2 nano-cup catalyst was synthesized via the coating of the mesoporous TiO2 layers on SiO2 sphere and subsequent inlay of MnO2 nanoparticles in the narrow annulus. The Mn–SiO2@TiO2-2.5 catalyst exhibited superior activity and stability for low-temperature selective catalytic reduction of NO with NH3, with a NO conversion of ∼100%, N2 selectivity above 90% at the temperature ∼140 °C, and a stable performance during the 120 h stability test. The characterizations results indicated that this nano-cup structure of the Mn–SiO2@TiO2-2.5 catalyst possesses high concentration and dispersion of Mn4+ active species, strong chemisorbed O− or O22− species and highly stable MnOX active components over the annular structures of TiO2 shell and SiO2 sphere, and thus are favourable to the low-temperature selective catalytic reduction of NO with NH3.Conflicts of interest
There are no conflicts to declare.Acknowledgements
The authors are grateful for the support from the Natural Science Foundation of China (21236004, 21576169).Notes and references
- R. Guo, M. Li, P. Sun, S. Liu, S. Wang, W. Pan, S. Liu, J. Liu and X. Sun, RSC Adv., 2017, 7, 19912–19923 RSC.
- R. Guo, S. Wang, W. Pan, M. Li, P. Sun, S. Liu, X. Sun, S. Liu and J. Liu, J. Phys. Chem. C, 2017, 121, 7881–7891 Search PubMed.
- S. Andreoli, F. A. Deorsola, C. Galletti and R. Pirone, Chem. Eng. J., 2015, 278, 174–182 CrossRef CAS.
- R. Guo, W. Pan, X. Zhang, H. Xu, Q. Jin, C. Ding and S. Guo, Sep. Sci. Technol., 2013, 48, 2871–2875 CrossRef CAS.
- T. Zhang, J. Liu, D. Wang, Z. Zhao, Y. Wei, K. Cheng, G. Jiang and A. Duan, Appl. Catal., B, 2014, 148, 520–531 CrossRef.
- L. Zhu, Z. Zhong, H. Yang and C. Wang, Water, Air, Soil Pollut., 2016, 227, 476 CrossRef.
- J. Ding, J. Lin, J. Xiao, Y. Zhang, Q. Zhong, S. Zhang, L. Guo and M. Fan, J. Alloys Compd., 2016, 665, 411–417 CrossRef CAS.
- J. Liu, X. Li, Q. Zhao, J. Ke, H. Xiao, X. Lv, S. Liu, M. Tade and S. Wang, Appl. Catal., B, 2017, 200, 297–308 CrossRef CAS.
- R. Guo, Y. Zhou, W. Pan, J. Hong, W. Zhen, Q. Jin, C. Ding and S. Guo, J. Ind. Eng. Chem., 2013, 19, 2022–2025 CrossRef CAS.
- C. Liu, L. Chen, J. Li, L. Ma, H. Arandiyan, Y. Du, J. Xu and J. Hao, Environ. Sci. Technol., 2012, 46, 6182–6189 CrossRef CAS PubMed.
- L. Zhang, D. Zhang, J. Zhang, S. Cai, C. Fang, L. Huang, H. Li, R. Gao and L. Shi, Nanoscale, 2013, 5, 9821–9829 RSC.
- P. Wang, Q. Wang, X. Ma, R. Guo and W. Pan, Catal. Commun., 2015, 71, 84–87 CrossRef CAS.
- X. Xie, J. Lu, E. Hums, Q. Huang and Z. Lu, Energy Fuels, 2015, 29, 3890–3896 CrossRef CAS.
- J. Yu, F. Guo, Y. Wang, J. Zhu, Y. Liu, F. Su, S. Gao and G. Xu, Appl. Catal., B, 2010, 95, 160–168 CrossRef CAS.
- P. R. Ettireddy, N. Ettireddy, S. Mamedov, P. Boolchand and P. G. Smirniotis, Appl. Catal., B, 2007, 76, 123–134 CrossRef CAS.
- B. Thirupathi and P. G. Smirniotis, Appl. Catal., B, 2011, 110, 195–206 CrossRef CAS.
- S. Cai, J. Liu, K. Zha, H. Li, L. Shi and D. Zhang, Nanoscale, 2017, 9, 5648–5657 RSC.
- S. Xiong, Y. Liao, X. Xiao, H. Dang and S. Yang, Catal. Sci. Technol., 2015, 5, 2132–2140 CAS.
- L. Huang, X. Hu, S. Yuan, H. Li, T. Yan, L. Shi and D. Zhang, Appl. Catal., B, 2017, 203, 778–788 CrossRef CAS.
- Y. J. Kim, H. J. Kwon, I. S. Nam, J. W. Choung, J. K. Kil, H. J. Kim, M. S. Cha and G. K. Yeo, Catal. Today, 2010, 151, 244–250 CrossRef CAS.
- J. Chen, Y. Zheng, W. Cai, H. Zou, W. Zheng, Y. Zhang, X. Chen and B. Fu, Micro Nano Lett., 2017, 12, 6–10 Search PubMed.
- G. Qi and R. Yang, Appl. Catal., B, 2003, 44, 217–225 CrossRef CAS.
- H. Jiang, C. Wang, H. Wang and M. Zhang, Mater. Lett., 2016, 168, 17–19 CrossRef CAS.
- D. K. Pappas, T. Boningari, P. Boolchand and P. G. Smirniotis, J. Catal., 2016, 334, 1–13 CrossRef CAS.
- M. Kang, E. D. Park, J. M. Kim and J. E. Yie, Appl. Catal., A, 2007, 327, 261–269 CrossRef CAS.
- C. Fang, D. Zhang, S. Cai, L. Zhang, L. Huang, H. Li, P. Maitarad, L. Shi, R. Gao and J. Zhang, Nanoscale, 2013, 5, 9199–9207 RSC.
- D. A. Pena, B. S. Uphade and P. G. Smirniotis, J. Catal., 2004, 221, 421–431 CrossRef CAS.
- Y. Chen, J. Wang, Z. Yan, L. Liu, Z. Zhang and X. Wang, Catal. Sci. Technol., 2015, 5, 2251–2259 CAS.
- S. Cai, H. Hu, H. Li, L. Shi and D. Zhang, Nanoscale, 2016, 8, 3588–3598 RSC.
- H. Hu, S. Cai, H. Li, L. Huang, L. Shi and D. Zhang, ACS Catal., 2015, 5, 6069–6077 CrossRef CAS.
- L. Zhang, L. Shi, L. Huang, J. Zhang, R. Gao and D. Zhang, ACS Catal., 2014, 4, 1753–1763 CrossRef CAS.
- T. Boningari and P. G. Smirniotis, Curr. Opin. Chem. Eng., 2016, 13, 133–141 CrossRef.
- N. Yang, R. Guo, Q. Wang, W. Pan, Q. Chen, C. Lu and S. Wang, RSC Adv., 2016, 6, 11226–11232 RSC.
- P. R. Ettireddy, N. Ettireddy, T. Boningari, R. Pardemann and P. G. Smirniotis, J. Catal., 2012, 292, 53–63 CrossRef CAS.
- K. Lv, Q. Xiang and J. Yu, Appl. Catal., B, 2011, 104, 275–281 CrossRef CAS.
- J. Yu, S. Liu and H. Yu, J. Catal., 2007, 249, 59–66 CrossRef CAS.
- S. Deng, T. Meng, B. Xu, F. Gao, Y. Ding, L. Yu and Y. Fan, ACS Catal., 2016, 6, 5807–5815 CrossRef CAS.
- M. Fu, C. Li, P. Lu, L. Qu, M. Zhang, Y. Zhou, M. Yu and Y. Fang, Catal. Sci. Technol., 2014, 4, 14–25 CAS.
- G. Li, J. Liu, J. Lan, G. Li, Q. Chen and G. Jiang, CrystEngComm, 2014, 16, 10547–10552 RSC.
- Y. Yang, G. Wang, Q. Deng, H. Wang, Y. Zhang, D. H. L. Ng and H. Zhao, RSC Adv., 2014, 4, 34577–34583 RSC.
- C. Hu, X. Zhang, W. Li, Y. Yan, G. Xi, H. Yang, J. Li and H. Bai, J. Mater. Chem. A, 2014, 2, 2040–2043 CAS.
- S. Yang, J. Li, C. Wang, J. Chen, L. Ma, H. Chang, L. Chen, Y. Peng and N. Yan, Appl. Catal., B, 2012, 117, 73–80 CrossRef.
- S. Ali, L. Chen, F. Yuan, R. Li, T. Zhang, S. u. H. Bakhtiar, X. Leng, X. Niu and Y. Zhu, Appl. Catal., B, 2017, 210, 223–234 CrossRef CAS.
- G. S. Qi and R. T. Yang, J. Catal., 2003, 217, 434–441 CrossRef CAS.
- W. S. Kijlstra, D. S. Brands, E. K. Poels and A. Bliek, J. Catal., 1997, 171, 208–218 CrossRef CAS.
- H. Y. Huang and R. T. Yang, Langmuir, 2001, 17, 4997–5003 CrossRef CAS.
- A. Grossale, I. Nova, E. Tronconi, D. Chatterjee and M. Weibel, J. Catal., 2008, 256, 312–322 CrossRef CAS.
- J. C. Dupin, D. Gonbeau, P. Vinatier and A. Levasseur, Phys. Chem. Chem. Phys., 2000, 2, 1319–1324 RSC.
- P. Yang, Z. Quan, Z. Hou, C. Li, X. Kang, Z. Cheng and J. Lin, Biomaterials, 2009, 30, 4786–4795 CrossRef CAS PubMed.
- L. Ma, J. Li, R. Ke and L. Fu, J. Phys. Chem. C, 2011, 115, 7603–7612 CAS.
- Z. Wu, R. Jin, Y. Liu and H. Wang, Catal. Commun., 2008, 9, 2217–2220 CrossRef CAS.
- G. Qi and W. Li, Catal. Today, 2015, 258, 205–213 CrossRef CAS.
- P. Li, C. He, J. Cheng, C. Y. Ma, B. J. Dou and Z. P. Hao, Appl. Catal., B, 2011, 101, 570–579 CrossRef CAS.
- N. Y. Topsoe, Science, 1994, 265, 1217–1219 CAS.
- N. Yang, R. Guo, W. Pan, Q. Chen, Q. Wang and C. Lu, Fuel, 2016, 169, 87–92 CrossRef CAS.
- J. Liu, J. Liu, Z. Zhao, Y. Wei, W. Song, J. Li and X. Zhang, Ind. Eng. Chem. Res., 2017, 56, 5833–5842 CrossRef CAS.
- W. Tian, H. Yang, X. Fan and X. Zhang, J. Hazard. Mater., 2011, 188, 105–109 CrossRef CAS PubMed.
- X. Fan, F. Qiu, H. Yang, W. Tian, T. Hou and X. Zhang, Catal. Commun., 2011, 12, 1298–1301 CrossRef CAS.
- Q. Li, H. S. Yang, F. M. Qiu and X. B. Zhang, J. Hazard. Mater., 2011, 192, 915–921 CrossRef CAS PubMed.
Footnote |
| † Electronic supplementary information (ESI) available. See DOI: 10.1039/c7ra11868f |
| This journal is © The Royal Society of Chemistry 2018 |

