 Open Access Article
Creative Commons Attribution 3.0 Unported Licence
Enhancement of CO2 capture performance of aqueous MEA by mixing with [NH2e-mim][BF4]
Mei Wang *,
Mingming Wang,
Na Rao,
Jiale Li and
Jianfen Li*
School of Chemical and Environmental Engineering, Wuhan Polytechnic University, Wuhan, Hubei 430023, PR China. E-mail: wangmei0223@hotmail.com; lijfen@163.com; Tel: +86 27 83963954
First published on 10th January 2018
Abstract
Alcohol amine solutions have a high absorption capacity and rate for CO2 capture, however, there are some shortcomings such as high energy-consumption and low stability. To enhance CO2 capture performance of aqueous MEA, a functional ionic liquid ([NH2e-mim][BF4]) was introduced based on the advantages for CO2 capture. Absorbents were prepared with the molar concentration ratio of [NH2e-mim][BF4] to the 30 vol% aqueous MEA of 0![[thin space (1/6-em)]](https://www.rsc.org/images/entities/char_2009.gif) :
:![[thin space (1/6-em)]](https://www.rsc.org/images/entities/char_2009.gif) 10, 1
10, 1![[thin space (1/6-em)]](https://www.rsc.org/images/entities/char_2009.gif) :
:![[thin space (1/6-em)]](https://www.rsc.org/images/entities/char_2009.gif) 9, 2
9, 2![[thin space (1/6-em)]](https://www.rsc.org/images/entities/char_2009.gif) :
:![[thin space (1/6-em)]](https://www.rsc.org/images/entities/char_2009.gif) 8, 3
8, 3![[thin space (1/6-em)]](https://www.rsc.org/images/entities/char_2009.gif) :
:![[thin space (1/6-em)]](https://www.rsc.org/images/entities/char_2009.gif) 7, 4
7, 4![[thin space (1/6-em)]](https://www.rsc.org/images/entities/char_2009.gif) :
:![[thin space (1/6-em)]](https://www.rsc.org/images/entities/char_2009.gif) 6 and 6
6 and 6![[thin space (1/6-em)]](https://www.rsc.org/images/entities/char_2009.gif) :
:![[thin space (1/6-em)]](https://www.rsc.org/images/entities/char_2009.gif) 4. The density and the viscosity of the investigated absorbents were measured and the effects of the molar fraction of [NH2e-mim][BF4] (nI) and temperature on CO2 absorption performance were investigated. CO2 desorption performance of the solvent at different temperatures was discussed. The stability performance of the absorbent with nI of 2
4. The density and the viscosity of the investigated absorbents were measured and the effects of the molar fraction of [NH2e-mim][BF4] (nI) and temperature on CO2 absorption performance were investigated. CO2 desorption performance of the solvent at different temperatures was discussed. The stability performance of the absorbent with nI of 2![[thin space (1/6-em)]](https://www.rsc.org/images/entities/char_2009.gif) :
:![[thin space (1/6-em)]](https://www.rsc.org/images/entities/char_2009.gif) 8 (I/M2:8) was examined by five consecutive cyclic tests. The results showed that for pure CO2, the I/M2:8 displayed the highest absorption performance at 303 K under 1 bar: a comparable CO2 absorption capacity of the 30 vol% aqueous MEA and a higher CO2 absorption rate at the later absorption stage. Moreover, with the increase of temperature, CO2 absorption capacity and rate decreased, while CO2 desorption efficiency and rate increased. 393 K was chosen as the optimum desorption temperature with the desorption efficiency of 99.31%. The introducing of IL contributed to CO2 desorption performance of the absorbents significantly. The properties (CO2 absorption capacity, mass loss, density and viscosity) of the I/M2:8 during the cycles suggested that the IL-MEA mixture had an excellent stability performance.
8 (I/M2:8) was examined by five consecutive cyclic tests. The results showed that for pure CO2, the I/M2:8 displayed the highest absorption performance at 303 K under 1 bar: a comparable CO2 absorption capacity of the 30 vol% aqueous MEA and a higher CO2 absorption rate at the later absorption stage. Moreover, with the increase of temperature, CO2 absorption capacity and rate decreased, while CO2 desorption efficiency and rate increased. 393 K was chosen as the optimum desorption temperature with the desorption efficiency of 99.31%. The introducing of IL contributed to CO2 desorption performance of the absorbents significantly. The properties (CO2 absorption capacity, mass loss, density and viscosity) of the I/M2:8 during the cycles suggested that the IL-MEA mixture had an excellent stability performance.
1. Introduction
Global warming, caused by excessive emission of carbon dioxide (CO2), has become one of the world's major environmental issues.1–4 The reduction of CO2 emissions by the capture of CO2 from flue gases is considered as an effective method to mitigate the greenhouse effect.5–7 Currently, the leading technology involves chemical absorption with aqueous amine solutions (typically 30 vol% amine by volume).8,9 However, the commercially available aqueous amine solutions, represented by monoethanolamine (MEA), present many disadvantages including high regenerative energy and degradation in the presence of oxygen.10–12 Moreover, the volatilization of amines causes environmental pollution and corrosion, as well as raises the cost of operation and amortized installation.13,14In recent years, considerable research efforts have been made to study the capture performance of the solvents that could overcome the aforementioned disadvantages. Ionic liquids (ILs), which are salts with a melting point below 100 °C and very low volatility, have great promise in the near future considering their high CO2 capture performance and reutilization.15–19 Among these, functionalized ILs, which could simultaneously improve absorption rate and selectivity of CO2 capture through the reversible reactions between reactive group of the ILs and CO2, have been intensively investigated in the past several decades.1,20–22 Bates et al. synthesized the IL (1-(1-aminopropyl)-3-butylimidazole fluoroborate, [NH2p-bim][BF4]) with amine moieties as the functional groups.23 The IL shows a high adsorption capacity of 0.5 mol CO2 per mol IL. In addition, some other studies also found that the amine-functionalized ILs have high CO2 capture performance.24–27 However, the high viscosity of this amine-functionalized ILs influenced the mass transfer between the liquids and the gas seriously, resulting in a low CO2 absorption capacity.28–32
In this paper, a new kind of solvent was developed by mixing an amine-functionalized IL (1-(1-aminoethyl)-3-methylimidazole fluoroborate [NH2e-mim][BF4]), with 30 vol% aqueous MEA solutions to investigate whether there was a synergetic effect on CO2 capture performance. The effects of the molar concentration ratio of [NH2e-mim][BF4] to MEA in the mixture and the temperature on CO2 absorption performance of the solvents were explored. Further, the desorption performance of the solvents at different temperature were discussed. Moreover, the cyclic stability of the absorbents were evaluated by five consecutive CO2 absorption–desorption tests.
2. Experimental
Materials
CO2 (purity ≥ 99.99%) was purchased from Wuhan Minghui gas Co., Ltd., China. Ethanolamine (MEA, AR) and sodium borate (NaBF4, CP) were purchased from Sinopharm Chemical Reagent Co., Ltd., China. 2-Bromine ethylamine hydrobromide (C2H7Br2N, 98%) and 1-methylimidazole (C4H6N2, 99%) were provided by Aladdin Reagent Co., Ltd., China.Characterization and measurement
An appropriate amount of material was taken in a closed flask according to the molar concentration ratio of the [NH2e-mim][BF4] to the 30 vol% aqueous MEA of 0![[thin space (1/6-em)]](https://www.rsc.org/images/entities/char_2009.gif) :
:![[thin space (1/6-em)]](https://www.rsc.org/images/entities/char_2009.gif) 10, 1
10, 1![[thin space (1/6-em)]](https://www.rsc.org/images/entities/char_2009.gif) :
:![[thin space (1/6-em)]](https://www.rsc.org/images/entities/char_2009.gif) 9, 2
9, 2![[thin space (1/6-em)]](https://www.rsc.org/images/entities/char_2009.gif) :
:![[thin space (1/6-em)]](https://www.rsc.org/images/entities/char_2009.gif) 8, 3
8, 3![[thin space (1/6-em)]](https://www.rsc.org/images/entities/char_2009.gif) :
:![[thin space (1/6-em)]](https://www.rsc.org/images/entities/char_2009.gif) 7, 4
7, 4![[thin space (1/6-em)]](https://www.rsc.org/images/entities/char_2009.gif) :
:![[thin space (1/6-em)]](https://www.rsc.org/images/entities/char_2009.gif) 6 and 6
6 and 6![[thin space (1/6-em)]](https://www.rsc.org/images/entities/char_2009.gif) :
:![[thin space (1/6-em)]](https://www.rsc.org/images/entities/char_2009.gif) 4. The corresponding molar fraction of [NH2e-mim][BF4] (nI) was 0, 0.1, 0.2, 0.3, 0.4, 0.6. It was mixed evenly by ultrasonic vibration.
4. The corresponding molar fraction of [NH2e-mim][BF4] (nI) was 0, 0.1, 0.2, 0.3, 0.4, 0.6. It was mixed evenly by ultrasonic vibration.
The viscosity was measured using a viscometer (DV-II+ Pro, Brookfield of USA). The “ULA” spindle and jacketed sample cell were used for these relatively low viscosity absorbents. The accuracy of viscometer was ±1% of the reading for torque measurement with a repeatability of ±0.2% of the reading. The temperature of the jacketed sample chamber was controlled via a circulating bath (TC-602P, Brookfield of USA) with a temperature stability of ±0.01 K.
The mass of the solution was measured by a precision electronic balance (AR2140, Mettler Toledo of Switzerland). The accuracy of the mass measurements was ±0.00001 g.
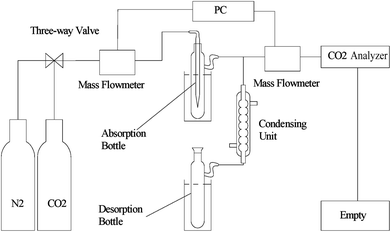
For CO2 absorption experiment, CO2 intake speed was controlled at approximately 60 mL min−1 under 1 bar. CO2 intake and outlet flow was determined by mass flow meters (50L type, SIERRA Flow Measurement and Control Technology Company of USA) with measurement error range of ±1%, which was recorded by a computer every 30 s. CO2 intake flow was recorded as Vi and V′i for CO2 outlet flow at time “i”. The volume of CO2 solubility in the investigated solvents (ΔVi, mL) could be obtained by eqn (1). CO2 absorption volume at time “t” (Qa, mL) and the molar fraction of CO2 (XCO2, unit: mol CO2 per mol mixture, expressed as mol per mol) in the solvents was calculated from eqn (2) and (3).
| ΔVi = Vi − V′i | (1) |
 | (2) |
 | (3) |
During CO2 desorption, temperature was regulated to range from 383 K to 398 K. CO2 liberation volume was measured by a mass flowmeter and recorded in a computer. CO2 desorption capacity (Qd, mL) was also calculated by eqn (2). And CO2 desorption efficiency (η, %) was defined as the percentage of CO2 desorption capacity to corresponding CO2 absorption capacity, which could be calculated by eqn (4).
 | (4) |
The investigated solvents were subjected to the steps previously mentioned to carry out CO2 absorption–desorption cycle experiments.
3. Results and discussion
Physical properties of the investigated solvents
Density and viscosity of the investigated solvents at 303 K under 1 bar were shown in Fig. 2.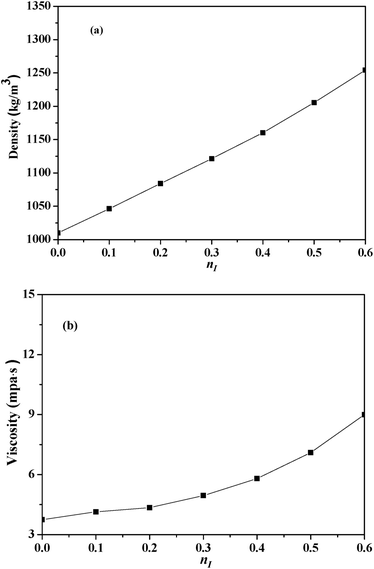 | ||
| Fig. 2 Physical properties of the absorbents with different nI at 303 K: (a) density; (b) viscosity. | ||
The density value of the mixed absorbents was between the density value of 30 vol% solution (1007.2 kg m−3) and the [NH2e-mim][BF4] (1472.2 kg m−3) which were measured at the same condition. And the viscosity of the mixed absorbents also showed the same law. The viscosity of [NH2e-mim][BF4] was 3589.2 mPa s determined by our group,22,34 while the viscosity of the absorbents was below 10 mPa s with nI of 0–0.6, which showed that the addition of 30 vol% solution reduced the viscosity of absorbents significantly. According to Fig. 2, both the density and the viscosity of the investigated absorbents increased with the increase of nI. The density was basically linear related to nI and the slope of viscosity kept increasing with the increase of nI when nI exceed 0.2.
Effects of the nI on the absorption performance
Fig. 3 illustrated the effects of nI on CO2 absorption performance at 303 K under 1 bar.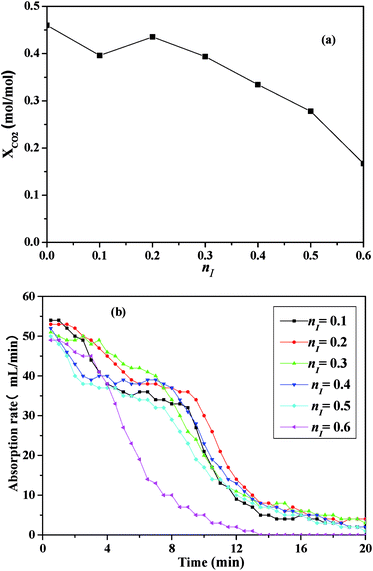 | ||
| Fig. 3 CO2 absorption performance of the absorbents with different nI at 303 K: (a) the absorption capacity; (b) the absorption rate. | ||
As shown in Fig. 3(a), with the increase of nI, CO2 absorption capacity increased initially, and reached a maximum of 0.4554 mol per mol (contrasting with a value of 0.4601 mol CO2 per mol MEA measured at the same condition) when nI was 0.2, then decreased, which suggested there was an optimum nI in the absorbent for CO2 absorption. In Fig. 3(b), as time went on, the absorption rate of all absorbents decreased rapidly within 12 minutes, and then decreased gently. With the increasing of nI, CO2 absorption rate increased firstly and then decreased, which suggested that an optimal nI also existed.
CO2 absorption performance was influenced by the viscosity of the absorbents, the imidazole ring content and the amine group content in the absorbents.35,36 CO2 absorption capacity was defined as the amount of CO2 absorption per mol amine in this work, thus the variation of CO2 absorption performance was mainly caused by the viscosity and the imidazole ring content of the absorbents. On the one hand, [NH2e-mim][BF4] concentration increased as nI increased and consequently increased the viscosity of the absorbents just as Fig. 2(b) shown, which militated against the contact of CO2 and the absorbents. On the other hand, the increase of nI should cause the increase of the imidazole ring content in the absorbent, which benefits CO2 absorption.36 The comprehensive effects of the factors caused that CO2 absorption performance increased and then decreased with the increase of nI.
As illustrated in Fig. 3, the absorbent prepared with nI of 0.2 (I/M2:8) showed the best absorption performance. Thus, a comparison between the absorption rate of the I/M2:8 and the MEA solution at 303 K under 1 bar had been made in Fig. 4. At the early stage (0–10 minutes), the aqueous MEA solution showed higher absorption rate than the mixture of [NH2e-mim][BF4] and MEA. After ten minutes, the mixture absorbent showed a higher absorption rate, which suggested that an moderate amount of [NH2e-mim][BF4] would contribute to increasing CO2 absorption rate at the later stage mainly.
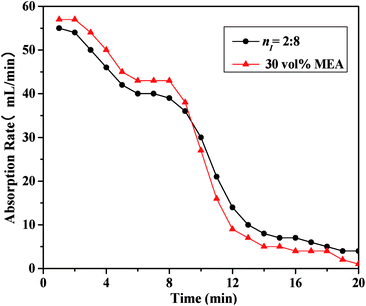 | ||
| Fig. 4 Comparison of CO2 absorption rate between the absorbent with nI of 0.2 and the 30 vol% MEA solution at 303 K. | ||
Considering that the mixed absorbent with the I/M2:8 showed the best absorption performance, the mixed absorbent mentioned below was prepared with this ratio.
Effects of the temperature on the absorption performance
Fig. 5 showed the effects of the temperature on CO2 absorption capacity and rate of the 30 vol% MEA solution and the I/M2:8. According to Fig. 5(a), the CO2 absorption capacity decreased as the temperature increased. The comparison between the CO2 absorption capacity of the mixed absorbent and the MEA solution illustrated that CO2 absorption capacity of the latter was comparable to the former. From Fig. 5(b), the CO2 absorption rate decreased with the temperature ranged from 303 K to 323 K. Absorption equilibrium could be reached a little bit earlier at a higher temperature of 323 K, which might due to a lower CO2 absorption capacity.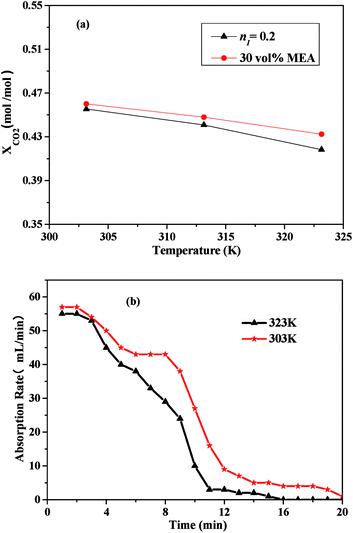 | ||
| Fig. 5 CO2 absorption performance of the I/M2:8 absorbent: (a) CO2 absorption capacity vs. temperature; (b) CO2 absorption rate vs. time at 303 K and 323 K. | ||
Therefore, both CO2 absorption capacity and CO2 absorption rate of the absorbents decreased with increasing of temperature. Similar result could be found in the previous studies.37–39
Effects of the temperature on the desorption performance
Fig. 6 presented the desorption performance of the I/M2:8 at different temperature and the desorption performance of 30 vol% MEA at 383 K under 1 bar. As shown in Fig. 6(a), all the desorption efficiency increased significantly at the beginning (0–40 minutes) and then increased gently until desorption equilibrated. With the increasing of temperature, the desorption efficiency increased. The desorption efficiency of the I/M2:8 was much higher than that of the aqueous MEA at the same temperature and it exceeded 50% in 30 minutes. By contrast, the MEA solution needed an hour to reach the desorption efficiency of 50%. The desorption rate decreased intensively first and then decreased slightly until desorption balanced, as shown in Fig. 6(b). With increasing temperature, the desorption rate increased, which followed the same trend as the desorption efficiency. As it could be seen in Fig. 6, the desorption efficiency and the desorption rate at 393 K were close to the values at 398 K. Considering the energy-consumption, 393 K was chosen as the optimum desorption temperature of the mixture with CO2 desorption efficiency of 99.31%, which was lower than that of the 30 vol% MEA solution (398 K).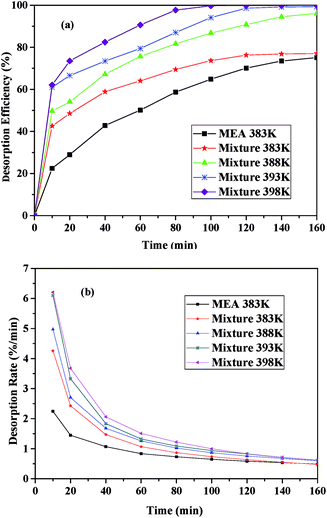 | ||
| Fig. 6 CO2 desorption performance the I/M2:8 absorbent at different temperature: (a) the desorption efficiency vs. time; (b) the desorption rate vs. time. | ||
According to Fig. 6, CO2 desorption efficiency and rate of the I/M2:8 were higher than that of the aqueous MEA at the same conditions, which suggested that the mixture absorbents had a lower energy consumption for regenerations compared with the aqueous alcohol. The energy-consumption of CO2 desorption involved three parts: the energy for the increase of the mixture temperature, which was the product of the mole quantity, molar heat capacity and the differential of the temperature; the energy for the escape of CO2, which was equal to the absorption heat of CO2; and the energy for the vaporization of the absorbent.1 The regeneration temperature of the functional ILs was from 263 K to 343 K,40 which was lower than that of the alcohol amine. Thus, the ILs needed less energy for the increase of the temperature. The absorption heat depended on the heat of the reaction between the absorbents and CO2, which were nearly the same for these two absorbents. Therefore, the energy for the escape of CO2 from the two absorbents showed little change. The regeneration temperature of the MEA solution was higher than ILs, accordingly, the vaporization of water and MEA needed more energy. Consequently, CO2 desorption of ILs system required less energy than the MEA system, which suggested that the ILs was an economical solution for CO2 capture.
Stability performance of the absorbent
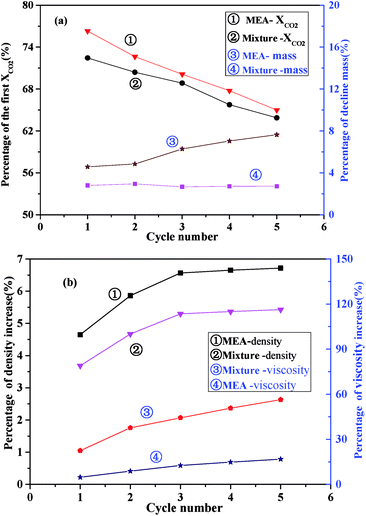
To examine the stability performance of the absorbents, properties including CO2 adsorption capacity, mass loss, density and viscosity of the MEA solution and the I/M2:8 were circularly tested for 5 times. The absorption temperature was 303 K, and the time of duration was 30 min. The desorption temperature of MEA solution was 398 K, while the desorption temperature of I/M2:8 was 393 K, and the time of duration was 120 min. Fig. 7 showed the properties of the absorbents in each cycle.As shown in Fig. 7(a), the values of CO2 absorption capacity of the MEA solution and the I/M2:8 decreased gradually in five absorption–desorption cycles. And the decrease percentage of CO2 absorption capacity of the I/M2:8 were slightly less than those of MEA. However, the mass weight loss of the two absorbents in the 5 cycles showed different trends. The weight loss percentage of the I/M2:8 was 3% relative to the first circle after one cycle, and then the weight was a small loss during the next four cycles. By contrast, the mass of MEA system decreased more obviously, and the percent of the decline values increased as the number of the circles went up. The difference of the two absorbents might be caused by the water and MEA which was more volatile at a higher temperature of 393 K. To verify the reason of the phenomenon, the density and the viscosity of the absorbents were measured respectively in each circle. The results were shown in Fig. 7(b).
As illustrated in Fig. 7(b), as the number of absorption–desorption cycles went up, the density of the absorbents increased gently and then became invariant after the third cycle. In the second cycle, the density of the I/M2:8 increased about 3.5% relative to the first circle, while the increase amount of the MEA solution was about 4.5%. The viscosity of the absorbents also increased as the number of absorption–desorption cycles went up. The viscosity of the MEA solution increased in a range of 2–5% with the increase of the cyclic times. And for the I/M2:8, it increased about 12% relative to the first circle, and the growth rate slowed down after the second circle with the increase amount of about 5%. The viscosity value of the mixture was in a range of 4–10 mPa s at 303 K, which was still a moderate viscosity for CO2 adsorption. From the above results, it suggested that the mixture of ILs and MEA showed a better stability of density and a larger change of viscosity, which mitigated the loss of volatile MEA and water in the absorbents.
According to Fig. 7, it was concluded that the mixture of IL and MEA had a better stability in CO2 adsorption capacity, mass loss and density and had a better thermodynamic stability than the MEA solution.
4. Conclusions
In this work, absorbents with excellent CO2 capture performance were developed by mixing 30 vol% MEA solution with an ionic liquid [NH2e-mim][BF4]. The density and the viscosity of the absorbents increased with the increase of nI. The addition of MEA solution reduced the viscosity of absorbents to no more than 10 mPa s.The absorbent exhibited a rather excellent CO2 capture performance when nI was 0.2: (1) a moderate [NH2e-mim][BF4] could contribute to increasing CO2 absorption rate at the later stage; (2) CO2 absorption capacity of the I/M2:8 could comparable with the 30 vol% MEA solution. It contributed to advance the CO2 absorption process to increase temperature, however, CO2 absorption capacity and rate decreased.
Both CO2 desorption efficiency and CO2 desorption rate increased with increasing temperature. And CO2 desorption efficiency and rate was higher than the 30 vol% solution at the same conditions. Considering the energy-consumption, 393 K was chosen as the optimum desorption temperature, which was 5 K lower than the MEA solution.
Compared with MEA solution, the absorbent of I/M2:8 showed a better cyclic stability. The reason was that the addition of [NH2e-mim][BF4] into the MEA could improve the thermodynamic stability of the absorbent.
Conflicts of interest
There are no conflicts to declare.Acknowledgements
The authors are grateful for Hubei Province Excellent Science and Technology Innovation Team Project (T201407).References
- C. Wang, X. Luo, X. Zhu, G. Cui, D. Jiang, D. Deng, H. Li and S. Dai, RSC Adv., 2013, 3, 15518–15527 RSC.
- Indian People Organizing for Change, Environmental Policy Collection, 2014, vol. 27, p. 408 Search PubMed.
- D. S. Jenkinson, D. E. Adams and A. Wild, Nature, 1991, 351, 304–306 CrossRef CAS.
- M. Zhao, A. I. Minett and A. T. Harris, Energy Environ. Sci., 2012, 6, 25–40 Search PubMed.
- A. E. Creamer and B. Gao, Environ. Sci. Technol., 2016, 50, 7276 CrossRef CAS PubMed.
- F. Johnsson, Greenhouse Gases: Sci. Technol., 2011, 1, 119–133 CrossRef CAS.
- K. S. Lackner, Science, 2015, 300, 1677–1678 CrossRef PubMed.
- L. J. Hyun, K. Jun-Han, L. I. Young, J. K. Ryoung and S. Jae-Goo, J. Chem. Eng. Jpn., 2010, 43, 720–726 CrossRef.
- S. Kenarsari, D. Yang, G. Jiang, S. Zhang, J. Wang, A. Russell, Q. Wei and M. Fan, RSC Adv., 2013, 3, 22739–22773 RSC.
- N. Harun and P. L. Douglas, Int. J. Greenhouse Gas Control, 2012, 10, 295–309 CrossRef CAS.
- P. Mores, N. Scenna and S. Mussati, Energy, 2012, 45, 1042–1058 CrossRef CAS.
- L. Faramarzi, G. M. Kontogeorgis, M. L. Michelsen, K. Thomsen and E. H. Stenby, Ind. Eng. Chem. Res., 2010, 49, 3751–3759 CrossRef CAS.
- M. Gupta, E. F. D. Silva, A. Hartono and H. F. Svendsen, J. Phys. Chem. B, 2013, 117, 9457–9468 CrossRef CAS PubMed.
- X. Zhang, X. Zhang, H. Dong, Z. Zhao, S. Zhang and Y. Huang, Energy Environ. Sci., 2012, 5, 6668–6681 CAS.
- G. Wang, W. Hou, X. Feng, G. Jiao, Y. Wu and Z. Zhang, J. Chem. Eng. Data, 2011, 56, 1125–1133 CrossRef CAS.
- X. M. Zhang, K. Huang, S. Xia, Y. L. Chen, Y. T. Wu and X. B. Hu, Chem. Eng. J., 2015, 274, 30–38 CrossRef CAS.
- J. Q. Wang, W. G. Cheng, J. Sun, T. Y. Shi, X. P. Zhang and S. J. Zhang, RSC Adv., 2013, 4, 2360–2367 RSC.
- Z. Z. Yang, Y. N. Zhao and L. N. He, RSC Adv., 2011, 1, 545–567 RSC.
- T. Y. Shi, J. Q. Wang, J. Sun, M. H. Wang, W. G. Cheng and S. J. Zhang, RSC Adv., 2013, 3, 3726–3732 RSC.
- L. M. G. Sánchez, G. W. Meindersma and A. B. D. Haan, Chem. Eng. J., 2011, 166, 1104–1115 CrossRef.
- M. Gonzalezmiquel, J. Bedia, C. Abrusci, J. Palomar and F. Rodriguez, J. Phys. Chem. B, 2013, 117, 3398–3406 CrossRef CAS PubMed.
- M. Wang, L. Zhang, L. Gao, K. Pi, J. Zhang and C. Zheng, Energy Fuels, 2013, 27, 461–466 CrossRef CAS.
- E. D. Bates, R. D. Mayton, A. Ioanna Ntai and J. H. Davis Jr, J. Am. Chem. Soc., 2002, 124, 926 CrossRef CAS PubMed.
- R. Vijayraghavan, S. J. Pas, E. I. Izgorodina and D. R. Macfarlane, Phys. Chem. Chem. Phys., 2013, 15, 19994 RSC.
- B. F. Goodrich, D. L. F. Jc, B. E. Gurkan, Z. K. Lopez, E. A. Price, Y. Huang and J. F. Brennecke, J. Phys. Chem. B, 2011, 115, 9140–9150 CrossRef CAS PubMed.
- Y. S. Sistla and A. Khanna, J. Ind. Eng. Chem., 2014, 20, 2497–2509 CrossRef CAS.
- Z. Zhou, X. Zhou, G. Jing and B. Lv, Energy Fuels, 2016, 30, 7489–7495 CrossRef CAS.
- M. S. Shannon and J. E. Bara, Sep. Sci. Technol., 2012, 47, 178–188 CrossRef CAS.
- Y. Shim and H. J. Kim, J. Phys. Chem. B, 2010, 114, 10160–10170 CrossRef CAS PubMed.
- S. Zeng, J. Wang, L. Bai, B. Wang, H. Gao, D. Shang, X. Zhang and S. Zhang, Energy Fuels, 2015, 29, 6039–6048 CrossRef CAS.
- J. J. Chen, W. W. Li, X. L. Li and H. Q. Yu, Phys. Chem. Chem. Phys., 2012, 14, 4589–4596 RSC.
- S. A. Prikhod'Ko, A. Y. Shabalin, V. V. Bardin, I. V. Eltsov, I. K. Shundrina, V. N. Parmon and N. Y. Adonin, RSC Adv., 2017, 7, 17497–17504 RSC.
- M. Wang, L. Q. Zhang, H. Liu, J. Y. Zhang and C. G. Zheng, J. Fuel Chem. Technol., 2012, 40, 1264–1268 CrossRef CAS.
- M. Wang, L. Q. Zhang, M. Yang and W. Y. Hu, J. Wuhan Polytech. Univ., 2014, 41–45 Search PubMed.
- X. Lei, Y. Xu, L. Zhu and X. Wang, RSC Adv., 2014, 4, 7052–7057 RSC.
- A. H. Jalili, A. Mehdizadeh, M. Shokouhi, H. Sakhaeinia and V. Taghikhani, Fluid Phase Equilib., 2010, 42, 787–791 CAS.
- M. P. Gimeno, M. C. Mayoral and J. M. Andrés, Energy Fuels, 2013, 27, 3928–3935 CrossRef CAS.
- S. Ren, Y. Hou, W. Wu, S. Tian and W. Liu, RSC Adv., 2012, 2, 2504–2507 RSC.
- Y. Yasaka and Y. Kimura, J. Chem. Eng. Data, 2016, 61, 837–845 CrossRef CAS.
- B. F. Goodrich, J. C. D. L. Fuente, B. E. Gurkan, D. J. Zadigian, E. A. Price, Y. Huang and J. F. Brennecke, Ind. Eng. Chem. Res., 2011, 50, 111–118 CrossRef CAS.
| This journal is © The Royal Society of Chemistry 2018 |

