 Open Access Article
Retracted Article: Long non-coding RNA PVT1 facilitates cell proliferation by epigenetically regulating FOXF1 in breast cancer
Guangcheng Guo,
Fang Wang,
Mingli Han,
Yuanting Gu,
Xin Duan and
Lin Li *
*
Department of Breast Surgery, The First Affiliated Hospital of Zhengzhou University, No. 1 Jian She East Road, Zhengzhou, 450052, China. E-mail: lilinlin126@sohu.com; Tel: +86-0371-67967172
First published on 12th January 2018
Abstract
Background: plasmacytoma variant translocation 1 (PVT1) has been identified as an oncogenic long non-coding RNA (lncRNA) in multiple cancers including breast cancer. However, its molecular basis has not been exhaustively elucidated. Methods: RT-qPCR assay was used to detect PVT1 expression in tissues and cells. The effect of PVT1 and FOXF1 on breast cancer cell proliferation was assessed by MTT, colony formation and cell cycle assays. Cell apoptotic rate was measured by flow cytometry via double-staining of Annexin V-FITC and PI. The protein expression patterns of forkhead box f1 (FOXF1) and enhancer of zeste homolog 2 (EZH2) were detected using western blot assays. The subcellular location of PVT1 was analyzed using subcellular fractionation assays. The interaction between PVT1 and EZH2 were demonstrated by RNA-protein pull down and RIP assays. ChIP assay was used to explore whether PVT1 affected FOXF1 expression by recruiting EZH2. In vivo assays were performed to further investigate the roles of PVT1 in breast cancer tumorigenesis. Results: PVT1 expression was elevated in breast cancer tissues and cells. Moreover, higher PVT1 level was positively associated with aggressive pathological status and poor prognosis of breast cancer. PVT1 knockdown suppressed proliferation and induced apoptosis in breast cancer cells. PVT1 silenced FOXF1 expression by recruiting EZH2 to the promoter region of FOXF1, resulting in the increase of H3K27me3 level. EZH2 inhibitor EPZ005687 counteracted PVT1-mediated enrichment effect on H3K27me3 and EZH2 to FOXF1 promoter region. FOXF1 overexpression hampered proliferation and facilitated apoptosis in breast cancer cells. Furthermore, down-regulation of FOXF1 partly abrogated PVT1-knockdown-mediated anti-proliferation and pro-apoptosis effect in breast cancer cells. Finally, PVT1 deficiency suppressed tumor growth by promoting FOXF1 expression in vivo. Conclusion: PVT1 promoted cell proliferation and suppressed apoptosis by epigenetically silencing FOXF1 expression through EZH2 in breast cancer.
1. Introduction
Breast cancer is one of the most commonly diagnosed malignancies among women in the United States, accounting for approximately 29% in all new diagnosed cancers, and breast cancer is the second major cause of cancer-induced death among women of the United States with an estimated 40![[thin space (1/6-em)]](https://www.rsc.org/images/entities/char_2009.gif) 890 deaths in 2016.1 Although much progress has been made in the diagnosis and therapy of breast cancer, it is still a serious threat and barrier in regard to health and life quality of women.2 Hence, it is imperative to better understand the molecular basis of breast cancer to identify more effective targets.
890 deaths in 2016.1 Although much progress has been made in the diagnosis and therapy of breast cancer, it is still a serious threat and barrier in regard to health and life quality of women.2 Hence, it is imperative to better understand the molecular basis of breast cancer to identify more effective targets.
Long noncoding RNAs (lncRNAs), a class of transcripts longer than 200 nucleotides, have been identified as vital regulators in the development of cancers.3,4 LncRNA plasmacytoma variant translocation 1 (PVT1), located on chromosome 8q24, has been demonstrated to be an oncogenic lncRNA in multiple cancers,5 such as colorectal cancers,6 gastric cancer,7 and non-small cell lung cancer.8 Guan et al. also showed that PVT1 amplification contributed to the pathophysiology of breast cancer and PVT1 knockdown suppressed proliferation and induced apoptosis in breast cancer cells.9 Moreover, Wang et al. indicated that PVT1 was highly expressed in breast cancer tissues and cells, and down-regulation of PVT1 inhibited growth and invasion of breast cancer cells via blocking epithelial–mesenchymal transition (EMT).10 Although these data have manifested the vital roles of PVT1, the underlying molecular mechanisms of PVT1 in the development and progression of breast cancer have not been fully elucidated till now.
Enhancer of zeste homolog 2 (EZH2), a vital catalytic subunit of polycomb repressive complex 2 (PRC2), regulated gene expression by promoting histone H3 lysine 27 trimethylation (H3K27me3).11,12 The high expression of EZH2 was closely associated with aggressive disease status and poor prognosis in various cancers, such as prostate cancer,13 breast cancer,14 and gastric cancer.15 Moreover, a large amount of data indicated that EZH2 could interact with non-coding RNAs including miRNAs and lncRNAs to regulate cancer progression.16 For example, lncRNA MALAT1 facilitated renal cell cancer progression by interaction with EZH2.17 PVT1 contributed to the proliferation of non-small cell lung cancer cells by recruiting EZH2 to the promoter region of large tumor suppressor kinase 2 (LATS2).18 Kong et al. also demonstrated that PVT1 facilitated proliferation of gastric cancer by epigenetically silencing the expression of p15 and p16 via recruiting EZH2.7 A previous study pointed out that forkhead box f1 (FOXF1), a tumor suppressor, was aberrantly silenced due to hypermethylation of promoter region in breast cancer, and the hypermethylation status of FOXF1 promoter was positively associated with tumor grade of breast cancer.19 Hence, in the present study, we aimed to further explore the function and regulatory mechanism of PVT1 in breast cancer progression.
2. Materials and methods
2.1. Clinical specimens and cell culture
A total of 40 breast cancer tissues and adjacent normal tissues were acquired from breast cancer patients suffering from surgical resection at our hospital. The tissues were snap frozen in liquid nitrogen, followed by the storage at −80 °C refrigerator. Our study was approved by the Ethic Committee of the First Affiliated Hospital of Zhengzhou University in accordance with the Declaration of Helsinki Principles. Informed consents were obtained from all participants. The clinical stages were differentiated following the standard of the American Joint Committee on Cancer (AJCC). Overall survival time presented the period from tumor excision to patients death. All cell lines were obtained from American Tissue Culture Collection (ATCC, Manassas, VA, USA). Human mammary epithelial cell line (MCF-10A) were cultured in Clonetics MEGM™ mammary epithelial cells growth medium (Lonza Walkersville, Inc. Walkersville, MD, USA) supplemented with 5% horse serum (Sigma-aldrich, St. louris, MO, USA), hEGF (Sigma-aldrich, 20 ng ml−1), hydrocortisone (Sigma-aldrich, 0.5 μg ml−1), cholera toxin (Sigma-aldrich, 1 ng ml−1) and insulin (Sigma-aldrich, 10 μg ml−1). Human breast cancer cell lines (MCF-7, MDA-MB-231, MDA-MB-453, T47D and BT-474) were grown in RPMI-1640 meidum (Invitrogen, Carlsbad, CA, USA) containing 10% fetal bovine serum (FBS, Invitrogen).2.2. Reagents and cell transfection
The full length fragments of FOXF1 coding sequences and PVT1 gene sequences were amplified by PCR and constructed into pcDNA3.1 vector (Invitrogen) to generate pcDNA-FOXF1 and pcDNA-PVT1 (PVT1) plasmid. Small interference RNAs (siRNAs) of PVT1 (si-PVT1#1, si-PVT1#2, si-PVT1#3), FOXF1 (si-FOXF1) and EZH2 (si-EZH2) along with the scramble control (si-con) were synthesized by GenePharma Co., Ltd (Shanghai, China). All these siRNAs or plasmids were transfected into breast cancer cells using lipofectamine 2000 reagent (Invitrogen) following the manufacturer's protocol. EZH2 inhibitor EPZ005687 was purchased from Apexbio Co. ltd (Boston, MA, USA) and dissolved in dimethyl sulfoxide (DMSO, Sigma-aldrich).2.3. RT-qPCR assays
Total RNA was extracted from tissues and cells using TRIzol reagent (Invitrogen), followed by the determination of RNA concentration and purity with Nanodrop 2000 (Thermo Fisher Scientific, Rockford, IL, USA). Then 1 μg RNA was reversely transcribed into cDNA by M-MLV reverse transcriptase (Promega, Madison, WI, USA) and random primers. The quantitative analysis of PVT1, GAPDH and U6 was performed using SYBR Premix Ex Taq reagent (TaKaRa Biotechnology, Dalian, China) and gene-specific primers. The primer sequences were listed as follows: PVT1, 5′-ATAGATCCTGCCCTGTTTGC-3′ (forward) and 5′-CATTTCCTGCTGCCGTTTTC-3′ (reverse); GAPDH, 5′-CCACCCATGGCAAATTCCATGGCA-3′ (forward) and 5′-TCTAGACGGCAGGTCAGGTCCACC-3′ (reverse); U6, 5′-CTCGCTTCGGCAGCACA-3′ (forward) and 5′-AACGCTTCACGAATTTGCGT-3′ (reverse).2.4. Western blot assays
Whole protein was extracted from cells and tissues using RIPA buffer (Thermo Scientific) containing cocktail (Roche, Basel, Switzerland) and quantified using Pierce BCA protein assay kit (Thermo Scientific). Then 50 μg protein samples were separated by SDS-PAGE gel and then transferred onto nitrocellulose (NC) membranes (Millipore, Bedford, MA, USA). After blocked with 5% skimmed milk for 1 h at room temperature, NC membranes were incubated with primary antibodies for the detection of FOXF1, EZH2 or β-actin overnight at 4 °C, followed by probed with horseradish peroxidase (HRP)-labeled second antibody for 1 h at room temperature. Finally, enhanced chemiluminescence (ECL) reagent (Thermo Scientific) was used to detect specific protein bands. All antibodies were obtained from Abcam Inc. (San Francisco, CA, USA).2.5. MTT assays
Cells (104/100 μl) were plated in 96-well plates overnight and then transfected with siRNAs or overexpression plasmids. At the indicated time points (0, 24, 48, 72 h) after transfection, 10 μl MTT solution (5 mg ml−1, Sigma-aldrich) were added into each well and the cells were incubated for another 4 h at 37 °C incubator. Then MTT solvent solution was added into each well and mixed to completely dissolve the MTT formazan crystals. At last, cell absorbance was determined at a wavelength of 570 nm.2.6. Flow cytometry analysis for cell cycle and apoptosis
Breast cancer cells were collected for cell cycle and apoptosis measurements at 48 h after transfection. For cell cycle analysis, collected cells were fixed overnight using 70% ethanol at 4 °C, followed by the treatment with 50 μg ml−1 propidium iodide (PI, Sigma-aldrich), 100 μg ml−1 RNaseA (Sigma-aldrich) and 0.2% Triton X-100 (Sigma-aldrich) at 37 °C for 30 min in the dark. Then cell cycle analysis was performed using a flow cytometry (FACScan; BD Biosciences, San Jose, CA, USA). Cell apoptosis analysis was performed using Annexin V-FITC cell apoptosis detection kit (Beyotime, Shanghai, China) according to the manufacturer's instructions. Briefly, collected cells were re-suspended with 195 μl Annexin V-FITC binding solution, followed by the addition of 5 μl Annexin V-FITC staining solution and 10 μl PI staining solution. After incubation for 20 min at room temperature in the dark, cells were subjected to flow cytometry (BD Biosciences) to analyze the apoptotic rate.2.7. Colony formation assays
Transfected cells were plated into 60 mm culture dishes and maintained in RPMI-1640 medium containing 10% FBS for about 2 weeks. Then cells were fixed using methanol and stained with 0.1% crystal violet (Sigma-Aldrich). Finally, the number of colonies with more than 50 cells was determined using a microscope.2.8. Subcellular fraction assays
The separation of nuclear and cytoplasmic RNA was performed using Cytoplasmic and Nuclear RNA Purification Kit (Norgenbiotek, Thorold, Canada) according to manufacturer's protocols. Then the expression levels of GAPDH, U6 and PVT1 in nuclear and cytoplasmic fractions were measured using RT-qPCR assays with GAPDH as a cytoplasmic control and U6 as a nuclear control.2.9. RNA immunoprecipitation (RIP) assays
RIP experiments were performed to explore the potential binding between PVT1 and EZH2 using EZH2 antibody (Abcam) or IgG antibody (Millipore, as a negative control) and Magna RIP™ RNA-Binding Protein Immunoprecipitation Kit (Millipore) following the manufacturer's instructions. Then retrieved RNAs was subjected to RT-qPCR assays to evaluate the enrichment degree of PVT1.2.10. RNA-protein pull-down assays
Firstly, TranscriptAid T7 High Yield Transcription Kit (Thermo Fisher Scientific) was used to generate the full length fragments of PVT1 and anti-sense-PVT1. Then PVT1 and anti-sense-PVT1 were labeled with Thermo Scientific Pierce RNA 3′ Desthiobiotinylation Kit (Thermo Fisher Scientific). RNA-protein pull-down assays were carried out using Pierce Magnetic RNA-Protein Pull down Kit (Thermo Fisher Scientific) following the manufacturer's instructions. Briefly, labeled RNA bound with Streptavidin Magnetic Beads, followed by the binding between RNA and RNA-binding proteins from MCF-7 cells lysate. Then the RNA-protein complexes were eluted for the further western blot analysis.2.11. Chromatin immunoprecipitation (ChIP) assays
ChIP assays were carried out using the Magna ChIP™ A/G Chromatin Immunoprecipitation Kit (Millipore) following the protocols of manufacturer. Briefly, MCF-7 cells were fixed with 1% formaldehyde and collected using a sterile cell scraper. Then collected cells were lyzed with lysis buffer, followed by the sonication treatment to obtain DNA fragments ranging from 200 to 1000 bp. Next, immunoprecipitation (IP) experiments were performed with protein A/G magnetic beads and antibodies against EZH2 (Abcam), H3K27me3 (Millipore) or IgG (Millipore). Following this, DNA was isolated and purified from Protein/DNA complexes, followed by the RT-qPCR analysis of FOXF1 promoter fragments. The primers of FOXF1 promoter region were listed as follows: FOXF1, 5′-AGGGTCTTAGGCCGACCC-3′ (forward) and 5′-CGCTCGGCTCCGAGATTC-3′ (reverse).2.12. Lentivirus production and infection
The shRNA sequences of PVT1 (sh-PVT1) and control sequences (sh-con) were constructed into pLKO.1 lentivirus vector (Addgene, Cambridge, Massachusetts, USA) to generate sh-PVT1 and sh-con lentivirus plasmids. Then constructed sh-PVT1 or sh-con plasmid was transfected into HEK293T cells together with pMD2G and psPAX2 (Addgene). At 72 h posttransfection, sh-PVT1 and sh-con lentiviruses were collected and filtered with 0.45 mm pore filter, respectively. Next, MCF-7 cells were infected with sh-PVT1 or sh-con lentivirus, followed by the sieving using puromycin (Sigma-aldrich) for nearly 7 days in order to obtain stable lentivirus-transfected cell lines.2.13. Mice xenografts
The mice experiments were performed with the approval of the Ethic Committee for Animal Research of the First Affiliated Hospital of Zhengzhou University following the national standard of the care and use of laboratory animals. Twelve female BALB/c athymic nude mice (5 weeks old) were obtained from Hubei Research Center of Laboratory Animal (Wuhan, China) and cultured under pathogen-free conditions. Then the mice were randomly divided into two groups (sh-con and sh-PVT1 group) with 6 mice in each group. Then, 1 × 10⁷ MCF-7 cells stably transfected with sh-con or sh-PVT1 were subcutaneously injected in the left flank of mice, respectively. Tumor volume was monitored and measured using a caliper every three days for 21 days after injection. At the end of the experiment, tumors were resected, photographed and weighted. Furthermore, the expression patterns of PVT1 and FOXF1 proteins in tumor tissues were detected using RT-qPCR and western blot assays.2.14. Statistical analysis
Data were obtained from at least 3 independent experiments and displayed as mean ± standard deviation (mean ± SD). The difference analyses between groups were performed using one-way ANOVA or Student's t-test. Overall survival rate was determined using Kaplan–Meier method with the log-rank test employed for comparison. Pearson correlation analyses were performed to explore the correlation between PVT1 and EZH2 expressions. P value of <0.05 was regarded as statistically significant.3. Results
3.1. PVT1 expression was elevated in breast cancer tissues and correlated to breast cancer progression and prognosis
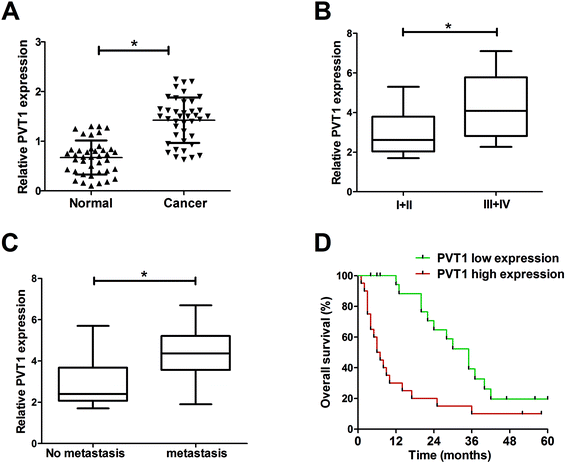
Firstly, the expression pattern of PVT1 in breast cancer tissues was explored by RT-qPCR assays. Results showed that PVT1 expression was significantly increased in breast cancer tissues (n = 40) compared with adjacent normal tissues (Fig. 1A). Moreover, the expression of PVT1 in different clinical pathological grades of breast cancer patients was detected. The results indicated that PVT1 expression was higher in patients with advanced pathological stage (III + IV) than that in patients with lower stage (I + II) (Fig. 1B). Moreover, PVT1 expression was significantly up-regulated in metastatic breast cancer tissues relative to that in non-metastatic breast cancer tissues (Fig. 1C). To further investigate the effect of PVT1 on prognosis, breast patients were divided into PVT1 high expression group and PVT1 low expression group by making the median PVT1 expression values as a cutoff point. Subsequent Kaplan–Meier analysis showed that the overall survival time was shorter in higher PVT1 expression group than that in PVT1 low expression group (Fig. 1D). Taken together, these results suggested that PVT1 may be related to the progression and prognosis of breast cancer.3.2. Knockdown of PVT1 suppressed proliferation and induced apoptosis in breast cancer cells
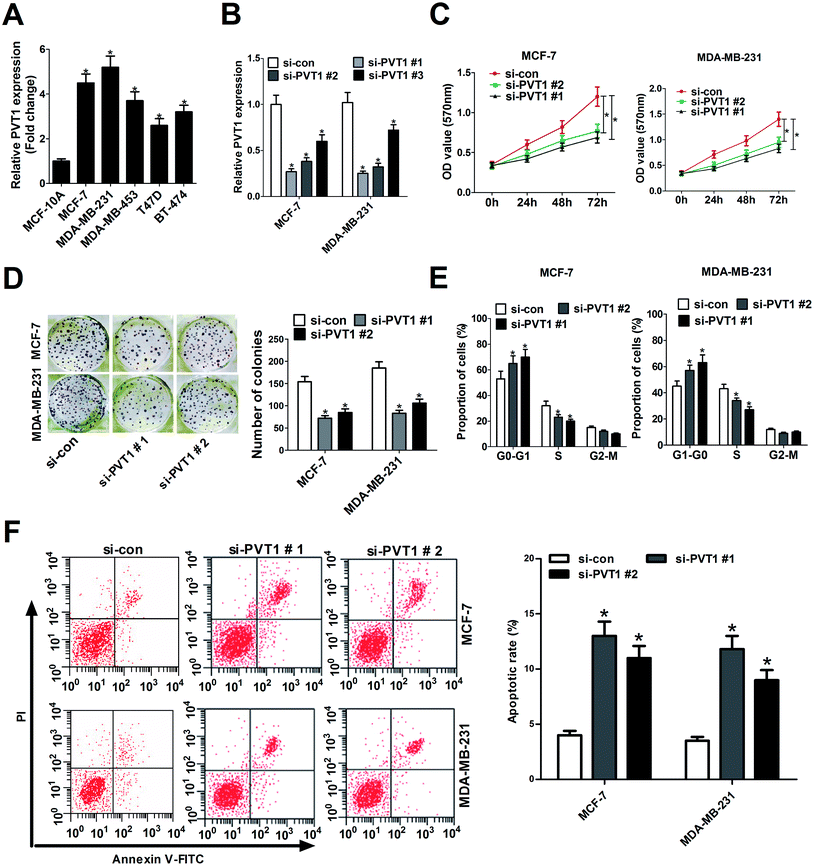
The expression profile of PVT1 in breast cancer cell lines and normal human mammary epithelial cell line was also detected by RT-qPCR assays. Results showed that PVT1 expression was enhanced in breast cancer cells (MCF-7, MDA-MB-231, MDA-MB-453, T47D, BT-474) compared with normal human mammary epithelial cell line (MCF-10A) (Fig. 2A). Hence, we further investigated the roles of PVT1 in the development of breast cancer by loss-of-function analysis. Three specific siRNAs targeting PVT1 (si-PVT1#1, si-PVT1#2, si-PVT1#3) and one scramble control siRNA (si-con) were synthesized and then transfected into MCF-7 and MDA-MB-231 cells. RT-qPCR showed that all these siRNAs (si-PVT1#1, si-PVT1#2, si-PVT1#3) effectively decreased PVT1 expression compared with scramble control in MCF-7 and MDA-MB-231 cells (Fig. 2B). Considering the better interfering efficiency of si-PVT1#1 and si-PVT1#2, si-PVT1#1 and si-PVT1#2 were chosen for further loss-of-function assays. Then the effect of PVT1 deficiency on breast cancer cell proliferation was assessed by MTT assays, colony formation and cell cycle distribution assays. MTT assays revealed that knockdown of PVT1 by both si-PVT1#1 and si-PVT1#2 significantly reduced the proliferation ability of MCF-7 and MDA-MB-231 cells (Fig. 2C). Also, a significant decrease of colonies numbers was observed in MCF-7 and MDA-MB-231 cells transfected with si-PVT1#1 or si-PVT1#2 when compared to that in si-con-transfected cells (Fig. 2D). Moreover, the depletion of PVT1 expression resulted in a significant increase of cell proportion in G0/G1 phage and a notable reduction of cell percentage in S phage in MCF-7 and MDA-MB-231 cells, indicating that knockdown of PVT1 hindered cell cycle progression in breast cancer cells (Fig. 2E). Additionally, the effect of si-PVT1#1 and si-PVT1#2 on apoptosis was measured in breast cancer cells. Results implied that apoptotic rates were significantly increased in MCF-7 and MDA-MB-231 cells after down-regulating PVT1 (Fig. 2F). In summary, these data manifested that knockdown of PVT1 hindered proliferation and induced apoptosis in breast cancer cells.3.3. PVT1 silenced FOXF1 expression by recruiting EZH2
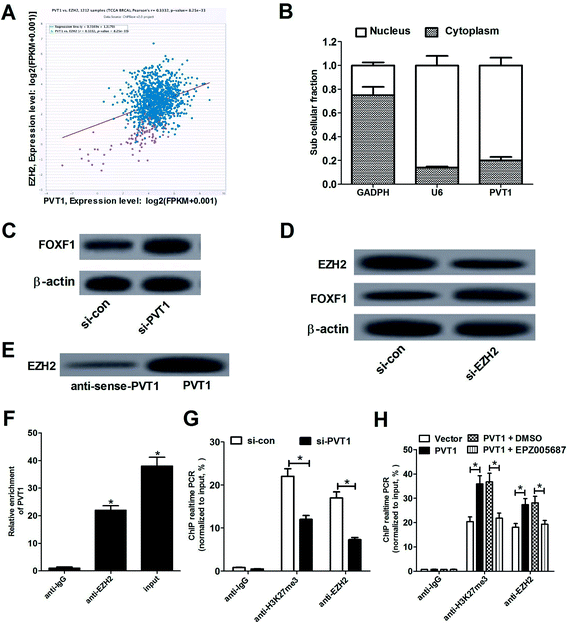
As mentioned above, PVT1 could regulate gene expression by recruiting EZH2, resulting in the increase of H3K27me3 level in promoter regions of target genes.7 Also, Lo et al. pointed out that FOXF1 as a tumor suppressor is aberrantly silenced due to hypermethylation of promoter region in breast cancer.19 Hence, we further explored whether PVT1 could regulate FOXF1 expression by recruiting EZH2 in breast cancer. Firstly, Chipbase database (http://rna.sysu.edu.cn/chipbase/) was used to analyze the relationships of EZH2 and PVT1 in 1212 clinical tumor tissue samples of breast cancer (from The Cancer Genome Atlas Breast Invasive Carcinoma database (TCGA BRCA)). Results showed that EZH2 expression was positively associated with PVT1 expression in breast cancer tumor tissue samples (Fig. 3A). Subsequently, we assessed PVT1 expression in nuclear and cytosolic fractions from MCF-7 cells by RT-qPCR analysis. The results showed that PVT1 was mainly distributed in nucleus of MCF-7 cells (Fig. 3B), indicating that PVT1 may exert regulatory effect at the transcriptional level. Western blot assay further showed that FOXF1 expression was up-regulated in MCF-7 cells following PVT1 knockdown (Fig. 3C). Moreover, introduction of si-EZH2 resulted in an evident reduction of EZH2 expression and a significant increase of FOXF1 expression compared with negative control (si-con) in MCF-7 cells (Fig. 3D), supporting the idea that EZH2 could regulate FOXF1 expression. Then, to validate whether PVT1 could directly bind to EZH2, RNA-protein pull down and RIP assays were performed in MCF-7 cells. RNA-protein pull down and western blot assays manifested that PVT1 bound more EZH2 than anti-sense-PVT1 (Fig. 3E). RIP assays also demonstrated that PVT1 was substantially enriched by EZH2 antibody (Fig. 3F). Collectively, these data manifested that PVT1 could interact with EZH2 in breast cancer cells. To further explore whether PVT1 is involved in transcriptional repression through enrichment of EZH2 to FOXF1 promoter, ChIP assays were carried out in MCF-7 cells. Results indicated that knockdown of PVT1 markedly reduced the enrichment of H3K27me3 and EZH2 in FOXF1 promoter region compared with si-con control group (Fig. 3G), suggesting that PVT1 could recruit EZH2 to the promoter region of FOXF1, resulting in the increase of H3K27me3 level in FOXF1 promoter region. To further validate this conclusion, EZH2 inhibitor EPZ005687 (ref. 20 and 21) was used to explore whether inhibition of EZH2 could abrogate the effect of PVT1. As displayed in Fig. 3H, PVT1 overexpression facilitated enrichments of H3K27me3 and EZH2 in FOXF1 promoter region, while the effect of PVT1 was markedly weakened following treatment with EPZ005687 (5 μM). Collectively, these data suggested that PVT1 negatively regulated FOXF1 expression by recruiting EZH2 to the promoter region of FOXF1 and increasing H3K27me3 level in breast cancer cells.3.4. FOXF1 overexpression inhibited proliferation and facilitated apoptosis in breast cancer cells
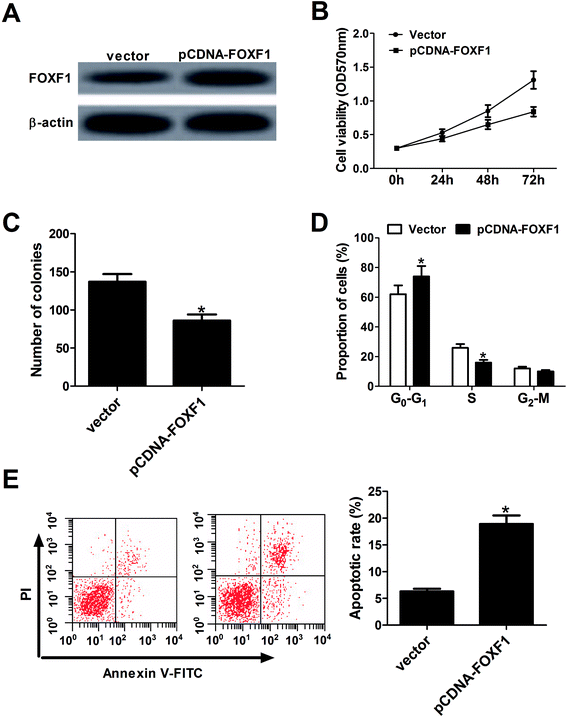
Next, the effect of FOXF1 on breast cancer cell proliferation and apoptosis by transfecting FOXF1 overexpression plasmid (pcDNA-FOXF1) into MCF-7 cells was evaluated. Results showed that FOXF1 protein expression was increased in pcDNA-FOXF1-transfected MCF-7 cells compared with vector-transfected cells (Fig. 4A). Subsequent gain-of-function experiments manifested that ectopic expression of FOXF1 markedly hampered proliferation, revealed by a significant drop of cell viability (Fig. 4B), a significant decrease of colony formation number (Fig. 4C), a significant increase of cell proportion in G0/G1 phage and a substantial decline of cell percentage in S phage (Fig. 4D). Moreover, enforced expression of FOXF1 significantly induced apoptosis of MCF-7 cells (Fig. 4E). These results indicated that FOXF1 overexpression blocked proliferation and promoted apoptosis in breast cancer cells.3.5. Down-regulation of FOXF1 partly abrogated PVT1-knockdown-mediated anti-proliferation and pro-apoptosis effect in breast cancer cells
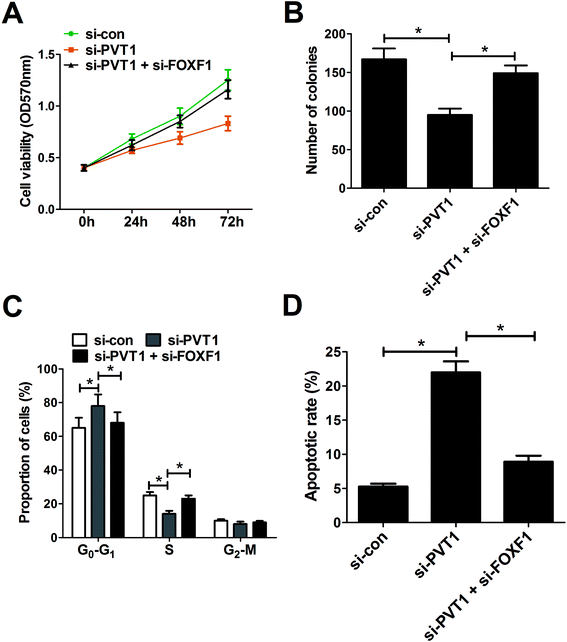
Restoration assay were performed to explore whether PVT1 exerted its oncogenic effect by silencing FOXF1 expression. The results showed that depletion of FOXF1 significantly relieved the inhibition effect of PVT1 knockdown on cell viability (Fig. 5A) and colony formation (Fig. 5B) in MCF-7 cells. Correspondingly, FOXF1 interfering RNA partly abated si-PVT1-induced cell cycle arrest in MCF-7 cells (Fig. 5C). As expected, FOXF1 down-regulation attenuated si-PVT1-triggered apoptosis in MCF-7 cells (Fig. 5D). These data indicated that PVT1-knockdown-mediated tumor-suppressive effect was undermined following the down-regulation of FOXF1.3.6. Knockdown of PVT1 suppressed tumor growth by promoting FOXF1 expression in vivo
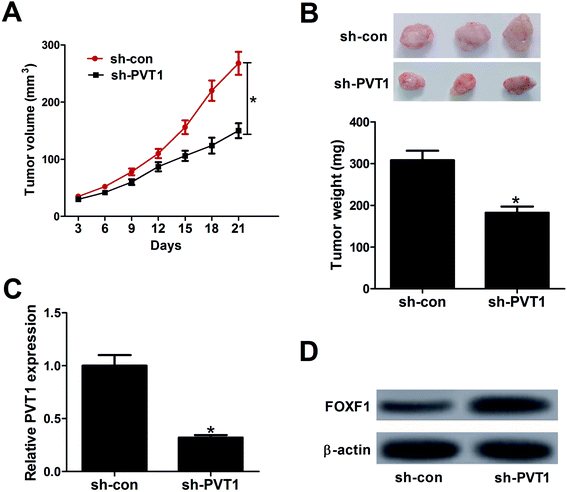
To further explore the effect of PVT1 on tumorigenesis of breast cancer in vivo, MCF-7 cells stably transfected sh-PVT1 or sh-con were injected into nude mice. Results showed that PVT1 knockdown significantly suppressed tumor growth, presented by the decrease of tumor volume (Fig. 6A) and weight (Fig. 6B) in sh-PVT1-transfected group compared with control group. Additionally, RT-qPCR and western blot assays further elucidated an evident decline of PVT1 expression (Fig. 6C) and a substantial increase of FOXF1 protein expression (Fig. 6D) in tumor tissues derived from sh-PVT1-transfected MCF-7 cells when compared to that from sh-con-transfected cells. All these results manifested that depletion of PVT1 inhibited tumor growth by elevating FOXF1 expression in vivo.4. Discussion
Accumulating evidence shows that lncRNAs are involved in the development and progression of various cancers including breast cancer.22–24 PVT1 is encoded by a locus mapped on the well-known cancer risk region chromosome 8q24.5 Moreover, PVT1 has been identified as an oncogene in some cancers. For example, in gastric cancer, higher PVT1 level was associated with advanced TNM stage, deeper invasion and poor prognosis, and depletion of PVT1 strikingly suppressed the proliferation of gastric cancer cells.7 In this study, it is demonstrated that PVT1 was highly expressed in breast cancer tissues and cells. Moreover, higher PVT1 level was positively associated with aggressive pathological status and poor prognosis of breast cancer, which were in accordance with a previous report.10 Function analysis revealed that the depletion of PVT1 significantly hindered proliferation and induced apoptosis of breast cancer cells, which was also demonstrated in an earlier study.9 Moreover, a previous study showed that PVT1-derived miR-1207-5p contributed to breast cancer cells proliferation by negatively regulating STAT6 expression.25About 20% of human lncRNAs have been revealed to be physically associated with PRC2 complex, hinting the important roles of lncRNAs in recruiting polycomb-group proteins to their target genes.26 Previous studies also showed that PVT1 could bind to EZH2, which modulated gene expression by promoting H3K27me3.11,12 For instance, PVT1 recruited EZH2 to the promoter regions of miR-195 or miR-200b, resulting in an increase of H3K27me3 levels and an inhibition of miR-195 or miR-200b expression.27,28 Moreover, a recent study manifested that FOXF1 as a tumor suppressor is aberrantly silenced due to hypermethylation of promoter region in breast cancer, and the hypermethylation status of FOXF1 promoter was positively associated with tumor grade of breast cancer.19 Hence, we further investigated whether PVT1 could regulate FOXF1 expression by recruiting EZH2. Firstly, ChIPBase online website figured out a positive correlation between EZH2 and PVT1. Subcellular fraction assays manifested that PVT1 was mainly located in nucleus of MCF-7 cells, suggesting that PVT1 had a chance to interact with EZH2 in space. Moreover, western blot assays manifested that PVT1 knockdown or EZH2 deficiency led to an up-regulation of FOXF1 protein expression. Subsequent RNA-protein pull down and RIP assays further validated that PVT1 could bind to EZH2. ChIP and RT-qPCR assays further disclosed that PVT1 knockdown attenuated the binding ability of EZH2 to the promoter region of FOXF1 and lowered H3K27me3 level in FOXF1 promoter region. Conversely, PVT1 overexpression facilitated recruitment of EZH2 to FOXF1 promoter region, resulting in the upregulation of H3K27me3 level in FOXF1 promoter region. Moreover, we further demonstrated that this effect of PVT1 was abrogated following the inhibition of EZH2. In a word, these data elaborated that PVT1 suppressed FOXF1 expression by recruiting EZH2 and increasing H3K27me3 in breast cancer cells.
FOXF1 facilitated tumor growth and progression by inducing the activation of ERK5 in prostate cancer.29 Whereas, Tamura et al. verified that FOXF1 could be upregulated by p53, and enforced expression of FOXF1 hampered migration and invasion in HCT116 cells (a human colorectal cancer cell line), Ca9-22 cells (an established transformed human gingival cell line) and DLD1 cells (human colon cancer cell).30 Also, opposite results were obtained in previous studies with regard to the function of FOXF1 in breast cancer progression. As presented above, Lo et al. demonstrated that FOXF1 as a tumor suppressor was aberrantly silenced in breast cancer.19 Nevertheless, Nilsson et al. manifested that FOXF1 was a highly expressed factor in aggressive breast cancer cells, and FOXF1 overexpression facilitated tumorigenesis of breast cancer in vitro and in vivo.31 In the present study, it is demonstrated that FOXF1 overexpression hindered proliferation and facilitated apoptosis in breast cancer cells. Moreover, restoration assays were performed to explore whether PVT1 exerted its oncogenic effect by silencing FOXF1 expression. Results showed that down-regulation of FOXF1 partly abrogated PVT1-knockdown-mediated anti-proliferation and pro-apoptosis effect in breast cancer cells. Furthermore, PVT1 knockdown hampered tumor growth by enhancing FOXF1 expression in vivo.
5. Conclusion
Taken together, our study demonstrated that PVT1 promoted proliferation and hampered apoptosis by inhibiting downstream gene FOXF1 expression. Further mechanism analysis revealed that PVT1 silenced FOXF1 expression by recruiting EZH2 and increasing H3K27me3 level in FOXF1 promoter region.Authors' contribution
This work was conceived and designed by Guangcheng Guo, Yuanting Gu and Xin Duan. The experiments were carried out by Lin Li and Mingli Han. The manuscript was prepared by Guangcheng Guo and Fang Wang.Conflicts of interest
The authors have no conflict of interest to declare.References
- R. L. Siegel, K. D. Miller and A. Jemal, Ca-Cancer J. Clin., 2016, 66, 7–30 CrossRef PubMed.
- K. D. Miller, R. L. Siegel, C. C. Lin, A. B. Mariotto, J. L. Kramer, J. H. Rowland, K. D. Stein, R. Alteri and A. Jemal, Ca-Cancer J. Clin., 2016, 66, 271–289 CrossRef PubMed.
- R. Spizzo, M. I. Almeida, A. Colombatti and G. A. Calin, Oncogene, 2012, 31, 4577–4587 CrossRef PubMed.
- Z. Hua, Z. Chen, X. Wang, Z. Huang, Z. He and Y. Chen, J. Hematol. Oncol., 2013, 6, 37 CrossRef PubMed.
- T. Colombo, L. Farina, G. Macino and P. Paci, BioMed. Res. Int., 2015, 2015, 304208 Search PubMed.
- Y. Takahashi, G. Sawada, J. Kurashige, R. Uchi, T. Matsumura, H. Ueo, Y. Takano, H. Eguchi, T. Sudo and K. Sugimachi, Br. J. Cancer, 2014, 110, 164–171 CrossRef CAS PubMed.
- R. Kong, E. B. Zhang, D. D. Yin, L. H. You, T. P. Xu, W. M. Chen, R. Xia, L. Wan, M. Sun and Z. X. Wang, Mol. Cancer, 2015, 14, 82 CrossRef PubMed.
- Y. R. Yang, S. Z. Zang, C. L. Zhong, Y. X. Li, S. S. Zhao and X. J. Feng, Int. J. Clin. Exp. Pathol., 2014, 7, 6929–6935 CAS.
- Y. Guan, W. L. Kuo, J. L. Stilwell, H. Takano, A. V. Lapuk, J. Fridlyand, J. H. Mao, M. Yu, M. A. Miller and J. L. Santos, Clin. Cancer Res., 2007, 13, 5745–5755 CrossRef CAS PubMed.
- Y. Wang, J. Zhou, Z. Wang, P. Wang and S. Li, Biochem. Biophys. Res. Commun., 2017, 493, 429–436 CrossRef CAS PubMed.
- R. Cao, L. Wang, H. Wang, L. Xia, H. Erdjumentbromage, P. Tempst, R. S. Jones and Y. Zhang, Science, 2002, 298, 1039–1043 CrossRef CAS PubMed.
- R. Cao and Y. Zhang, Curr. Opin. Genet. Dev., 2004, 14, 155–164 CrossRef CAS PubMed.
- S. Varambally, S. M. Dhanasekaran, M. Zhou, T. R. Barrette, C. Kumar-Sinha, M. G. Sanda, D. Ghosh, K. J. Pienta, R. G. Sewalt, A. P. Otte, M. A. Rubin and A. M. Chinnaiyan, Nature, 2002, 419, 624–629 CrossRef CAS PubMed.
- C. G. Kleer, Q. Cao, S. Varambally, R. Shen, I. Ota, S. A. Tomlins, D. Ghosh, R. G. Sewalt, A. P. Otte and D. F. Hayes, Proc. Natl. Acad. Sci. U. S. A., 2003, 100, 11606–11611 CrossRef CAS PubMed.
- L. J. He, M. Y. Cai, G. L. Xu, J. J. Li, Z. J. Weng, D. Z. Xu, G. Y. Luo, S. L. Zhu and D. Xie, Asian Pac. J. Cancer Prev., 2012, 13, 3173–3178 CrossRef PubMed.
- L. Benetatos, Int. J. Cancer, 2013, 133, 267–274 CrossRef CAS PubMed.
- H. Hirata, Y. Hinoda, V. Shahryari, G. Deng, K. Nakajima, Z. L. Tabatabai, N. Ishii and R. Dahiya, Cancer Res., 2015, 75, 1322–1331 CrossRef CAS PubMed.
- L. Wan, M. Sun, G. J. Liu, C. C. Wei, E. B. Zhang, R. Kong, T. P. Xu, M. D. Huang and Z. X. Wang, Mol. Cancer Ther., 2016, 15, 1082–1094 CrossRef CAS PubMed.
- P. K. Lo, S. L. Ji, X. Liang, L. Han, T. Mori, M. J. Fackler, H. Sadik, P. Argani, T. K. Pandita and S. Sukumar, Cancer Res., 2010, 70, 6047–6058 CrossRef CAS PubMed.
- E. Miele, S. Valente, V. Alfano, M. Silvano, P. Mellini, D. Borovika, B. Marrocco, A. Po, Z. M. Besharat, G. Catanzaro, G. Battaglia, L. Abballe, C. Zwergel, G. Stazi, C. Milite, S. Castellano, M. Tafani, P. Trapencieris, A. Mai and E. Ferretti, Oncotarget, 2017, 8, 68557–68570 Search PubMed.
- S. K. Knutson, T. J. Wigle, N. M. Warholic, C. J. Sneeringer, C. J. Allain, C. R. Klaus, J. D. Sacks, A. Raimondi, C. R. Majer, J. Song, M. P. Scott, L. Jin, J. J. Smith, E. J. Olhava, R. Chesworth, M. P. Moyer, V. M. Richon, R. A. Copeland, H. Keilhack, R. M. Pollock and K. W. Kuntz, Nat. Chem. Biol., 2012, 8, 890–896 CrossRef CAS PubMed.
- G. Yang, X. Lu and L. Yuan, Biochim. Biophys. Acta, 2014, 1839, 1097–1109 CrossRef CAS PubMed.
- X. Su, G. G. Malouf, Y. Chen, J. Zhang, H. Yao, V. Valero, J. N. Weinstein, J. P. Spano, F. Meric-Bernstam and D. Khayat, Oncotarget, 2014, 5, 9864–9876 Search PubMed.
- Y. Liu, S. Sharma and K. Watabe, Front. Biosci., Scholar Ed., 2015, 7, 94–108 CrossRef.
- C. Yan, Y. Chen, W. Kong, L. Fu, Y. Liu, Q. Yao and Y. Yuan, Cancer Sci., 2017, 108, 868–876 CrossRef CAS PubMed.
- A. M. Khalil, M. Guttman, M. Huarte, M. Garber, A. Raj, D. R. Morales, K. Thomas, A. Presser, B. E. Bernstein and A. V. Oudenaarden, Proc. Natl. Acad. Sci. U. S. A., 2009, 106, 11667–11672 CrossRef CAS PubMed.
- C. J. Shen, Y. M. Cheng and C. L. Wang, J. Drug Targeting, 2017, 25, 637–644 CrossRef CAS PubMed.
- S. Zhang, G. Zhang and J. Liu, APMIS, 2016, 124, 649–658 CrossRef CAS PubMed.
- L. Fulford, D. Milewski, V. Ustiyan, N. Ravishankar, Y. Cai, T. Le, S. Masineni, S. Kasper, B. Aronow and V. V. Kalinichenko, Sci. Signaling, 2016, 9, ra48 CrossRef PubMed.
- M. Tamura, Y. Sasaki, R. Koyama, K. Takeda, M. Idogawa and T. Tokino, Oncogene, 2014, 33, 4837–4846 CrossRef CAS PubMed.
- J. Nilsson, K. Helou, A. Kovács, P. O. Bendahl, G. Bjursell, M. Fernö, P. Carlsson and M. Kanniusjanson, Cancer Res., 2010, 70, 2020–2029 CrossRef CAS PubMed.
| This journal is © The Royal Society of Chemistry 2018 |

