DOI:
10.1039/C7RA12086A
(Paper)
RSC Adv., 2018,
8, 6996-7004
Research into the reaction process and the effect of reaction conditions on the simultaneous removal of H2S, COS and CS2 at low temperature
Received
3rd November 2017
, Accepted 4th February 2018
First published on 12th February 2018
Abstract
In this work, tobacco stem active carbon (TSAC) catalysts loaded on to CuO and Fe2O3 were prepared by a sol–gel method and used for the simultaneous removal of hydrogen sulfide (H2S), carbonyl sulfide (COS) and carbon disulfide (CS2). The influences of the operating conditions such as reaction temperature, relative humidity (RH), O2 concentration, and gas hourly space velocity (GHSV) were discussed. DRIFTS results showed that the deactivation was attributed to the generation of S and sulfates. H2O promoted the generation of sulfate. The enhancement of the hydrolysis of COS/CS2 was due to the promotion of H2S oxidation by O2. A high GHSV decreased the contact time between the gases and the catalyst. Meanwhile, a high GHSV was not conducive to the adsorption of gases on the surface of the catalyst. XPS results indicated that the deactivation of the catalyst was attributable to the formation of S containing components, such as thiol/thioether, S, –SO– and sulfate. BET results indicated that the adsorptive ability of the catalyst was related to the microporous volume and surface area.
1. Introduction
H2S, COS and CS2 are major sulfur-containing compounds produced from industrial tail gas, such as closed carbide furnace tail gas.1–5 H2S, COS and CS2 not only pollute the natural environment but also cause corrosion to reactors, and poison catalysts.6,7 Meanwhile, there is a small amount of vapor and oxygen in the closed carbide furnace tail gas. A catalytic hydrolysis method has been widely developed to remove COS and CS2 from industrial tail gas.3,8,9 The hydrolysis product H2S can be removed by a catalytic oxidation method. Raw materials that have undergone desulfurization are less hazardous and corrosive, and thus can be used to produce other products. Therefore, it is of great significance to remove H2S, COS and CS2.
In previous studies, many researchers focused on the influence of catalyst characterization on the removal of H2S, COS and CS2.1,10–14 However, the influence of reaction conditions is also important for the removal of H2S, COS and CS2. Song et al. investigated the influence of reaction conditions on the hydrolysis of COS and CS2.15,16 The results showed that reaction conditions affected the reaction rate and the reaction product species. Furthermore, the reaction conditions directly affected the reaction process, such as the change of surface functional groups. In our previous studies, it could be found that –OH, –COO, and –C![[double bond, length as m-dash]](https://www.rsc.org/images/entities/char_e001.gif) O groups played important roles in the desulfurization process.17–19 –OH promoted the hydrolysis of COS and CS2, and –COO and –C
O groups played important roles in the desulfurization process.17–19 –OH promoted the hydrolysis of COS and CS2, and –COO and –C![[double bond, length as m-dash]](https://www.rsc.org/images/entities/char_e001.gif) O groups promoted the oxidation of H2S.20–22 Furthermore, CO2 could be converted into –COO and –C
O groups promoted the oxidation of H2S.20–22 Furthermore, CO2 could be converted into –COO and –C![[double bond, length as m-dash]](https://www.rsc.org/images/entities/char_e001.gif) O groups during this process, which enhanced the removal of H2S. However, there are few studies on the simultaneous removal of H2S, COS and CS2, and the detailed changes in surface functional groups during the desulfurization process under different reaction conditions were unknown. Therefore, this study is important and valuable.
O groups during this process, which enhanced the removal of H2S. However, there are few studies on the simultaneous removal of H2S, COS and CS2, and the detailed changes in surface functional groups during the desulfurization process under different reaction conditions were unknown. Therefore, this study is important and valuable.
Yunnan province is the main area that produces tobacco. However, a large number of tobacco stems are discarded every year. Previous studies showed that tobacco stems could be used for the preparation of biochar, and this showed a high adsorption ability.23,24 Therefore, the preparation of tobacco stem biochar could solve the disposal problems of waste tobacco stems. In this work, the influence of reaction conditions (reaction temperature, relative humidity (RH), O2 content, and gas hourly space velocity (GHSV)) on the removal of H2S, COS and CS2 was investigated. Meanwhile, the influence of reaction conditions on the change of surface functional groups was analyzed by DRIFTS (diffuse reflectance infrared Fourier transform spectroscopy), BET (surface area and pore structure analysis) and XPS (X-ray photoelectron spectroscopy).
2. Materials and methods
2.1 Catalyst preparation
The raw material of walnut shell biochar was from Yunnan province. The main preparation parameters were firstly that the tobacco stem was washed twice with water and smashed to 4 mesh size for use in this study. Then, the walnut shell was calcined at 700 °C for 1 h under nitrogen (N2) conditions, and sieved to 40–60 mesh size. After that, the carbonized material and the activator (CO2) were mixed together, and calcined at 800 °C for 1 h.
Secondly, a colloidal solution was made with certain amounts of Cu(NO3)2·3H2O solution, Fe(NO3)3·6H2O solution and K2CO3 solution. The activated carbon catalysts were supported by the desired proportions (mass fraction of CuO was 10% and Cu/Fe = 10/1). Then, the samples were dipped into ultrasonic conditions for 30 min, dried at 100 °C in the drying oven and calcined at 400 °C at a heating rate of 5 °C min−1 for 4 h under nitrogen (N2) conditions. Lastly, the catalysts were impregnated by 5% (mass fraction) KOH, and kept under ultrasonic conditions for 10 min, then dried for 6 h at 100 °C in the drying oven to get the catalyst (Cu–Fe/TSAC) needed for the experiments. Cu–Fe/TSAC showed a high desulfurization efficiency, and the sulfur capacity was 231.28 mgS g−1.
2.2 Catalytic activity measurements
Desulfurization tests were performed in a fixed-bed quartz reactor (3 mm inside diameter, 140 mm length) under atmospheric pressure (Fig. 1). H2S, COS and CS2 from gas cylinders (1% H2S in N2; 1% COS in N2; 0.3% CS2 in N2) were diluted with N2 (99.99%) to the required concentrations (H2S: 500 ppm; COS: 400 ppm; CS2: 60 ppm). The gas hourly space velocity (GHSV) of the reaction mixture was standardized at 10![[thin space (1/6-em)]](https://www.rsc.org/images/entities/char_2009.gif) 000–20
000–20![[thin space (1/6-em)]](https://www.rsc.org/images/entities/char_2009.gif) 000 h−1. The water comes from a saturator system, and the relative humidity (RH) was 0–60%. The reaction temperature of this reactor was controlled at 50–70 °C by a water-bath with a circulating pump, with an accuracy of ±0.1 °C. FULI 9790II gas chromatography was used to analyze the total H2S, COS and CS2 concentrations of the gaseous feed and effluent from the reactor. The conversion rates of H2S, COS and CS2 are achieved according to eqn (1).
000 h−1. The water comes from a saturator system, and the relative humidity (RH) was 0–60%. The reaction temperature of this reactor was controlled at 50–70 °C by a water-bath with a circulating pump, with an accuracy of ±0.1 °C. FULI 9790II gas chromatography was used to analyze the total H2S, COS and CS2 concentrations of the gaseous feed and effluent from the reactor. The conversion rates of H2S, COS and CS2 are achieved according to eqn (1).| |
 | (1) |
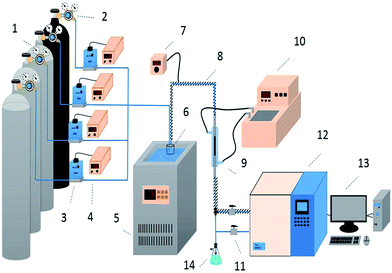 |
| | Fig. 1 Schematic diagram of the apparatus for the simultaneous removal of H2S, COS, and CS2 ((1) compressed gases (N2, CS2, COS, and H2S); (2) pressure reducing valve; (3) mass flow meter; (4) flow controller; (5) low temperature thermostatic bath; (6) water saturator; (7) heating controller; (8) heating cable; (9) fixed-bed quartz reactor; (10) water bath; (11) switch; (12) FULI 9790II gas chromatography; (13) workstation; (14) absorbing bottle). | |
The sulfur capacity (mgS g−1 catalyst) is defined as the sulfur deposition per unit mass of desulfurizer agent in H2S, COS and CS2 between time points (ending at 85% conversion).
2.3 Characterization
DRIFTS spectra were collected using a Nicolet iS50 FTIR spectrometer equipped with a smart collector. Mass flow controllers were used to control the volume flow of different gases to the required concentrations. The heating cable controlled the temperature (70 °C) of mixed gas until it entered the reactor. A reactor heater controlled the temperature (70 °C) of the reactor in the DRIFTS experiments. In this case, it ensured that the reaction temperature of the gas phase and the solid phase are the same. IR spectra were recorded by accumulating 100 scans at a resolution of 4 cm−1. Nitrogen adsorption–desorption isotherms were obtained by a Quantachrome surface area analyzer instrument. Before the measurement, the samples were outgassed under vacuum at 393 K for 24 h. Specific surface areas, and mesoporous and micropore adsorption–desorption isotherms were calculated by Brunauer–Emmett–Teller (BET), Barret–Joyner–Halenda (BJH) and Horvath–Kawazoe (HK) methods, respectively. XPS (ESCALAB 250) analysis was performed using Al Kα radiation, where the energy of the Al target powered was 200 W.
3. Results and discussion
3.1 Effect of reaction temperatures on the simultaneous removal of H2S, COS and CS2
The influence of reaction temperatures on the catalytic performance of the Cu–Fe/TSAC catalyst is illustrated in Fig. 2. The conversion of H2S, COS and CS2 first increased and then decreased with increasing temperature, and was highest at 60 °C. The H2S, COS and CS2 conversion was 100% in the initial 600, 150 and 180 min respectively. As shown in Fig. 2(d), the sulfur capacity first increased and then decreased with increasing reaction temperatures. The highest sulfur capacity (231.28 mgS g−1) was achieved at 60 °C.
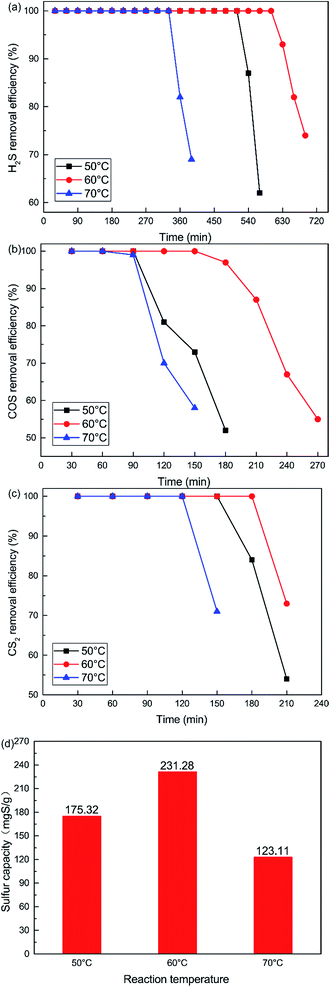 |
| | Fig. 2 Effect of reaction temperature on the removal of (a) H2S, (b) COS, and (c) CS2, and (d) sulfur capacity (reaction conditions: 500 ppm H2S; 400 ppm COS; 60 ppm CS2; GHSV = 10![[thin space (1/6-em)]](https://www.rsc.org/images/entities/char_2009.gif) 000 h−1; RH = 49%; O2 = 0%). 000 h−1; RH = 49%; O2 = 0%). | |
The reaction rates of simultaneous catalytic hydrolysis of COS and CS2 and catalytic oxidation of H2S were poor at low temperatures. Therefore, with increasing reaction temperature, the sulfur capacity was increased and the reaction rate of catalytic hydrolysis can be increased, and the hydrolysis reaction could occur more easily. However, the conversion of H2S to S or sulfate on Cu–Fe/TSAC involves parallel reactions. With increasing reaction temperatures, the yield rate of sulfuric acid increases faster than that of sulfur. At higher temperatures, H2S can be oxidized to sulfate more easily, and the higher concentration of SO42− poisons the hydrolysis activity.25 The majority of the products on the exhausted Cu–Fe/TSAC were S/SO42− species which accumulated on the active carbon’s surface and had a negative effect on the hydrolysis activity. Thus, the removal efficiency of H2S, COS and CS2 declined sharply at 70 °C.
DRIFTS results were used to further study the catalytic reaction of Cu–Fe/TSAC at different temperatures. As shown in Fig. 3, the Cu–Fe/TSAC surface generates CO2 (2363 cm−1), C![[double bond, length as m-dash]](https://www.rsc.org/images/entities/char_e001.gif) O groups (1604 cm−1), C–S groups (2080 cm−1) and S–O groups (1140 cm−1 and 1307 cm−1) as the reaction proceeds.1,26,27 Furthermore, CO2 was produced as the reaction time progressed, which can prove that the reaction is indeed the hydrolysis of COS and CS2. The formation of S–O groups can prove that the H2S was oxidized. Compared with reactions at 60 °C and 70 °C, fewer S–O groups were generated at 50 °C. This indicated that a temperature of 50 °C was not conducive to the oxidation of H2S. Compared with reactions at 50 °C and 60 °C, more S–O groups and fewer C–S groups were generated at 70 °C. This indicated that a temperature of 70 °C enhanced the hydrolysis of COS/CS2 and the oxidation of H2S. However, excessive oxidation of H2S could generate more sulfate, which could lead to the deactivation of the catalyst. At the temperature of 60 °C, the number of C
O groups (1604 cm−1), C–S groups (2080 cm−1) and S–O groups (1140 cm−1 and 1307 cm−1) as the reaction proceeds.1,26,27 Furthermore, CO2 was produced as the reaction time progressed, which can prove that the reaction is indeed the hydrolysis of COS and CS2. The formation of S–O groups can prove that the H2S was oxidized. Compared with reactions at 60 °C and 70 °C, fewer S–O groups were generated at 50 °C. This indicated that a temperature of 50 °C was not conducive to the oxidation of H2S. Compared with reactions at 50 °C and 60 °C, more S–O groups and fewer C–S groups were generated at 70 °C. This indicated that a temperature of 70 °C enhanced the hydrolysis of COS/CS2 and the oxidation of H2S. However, excessive oxidation of H2S could generate more sulfate, which could lead to the deactivation of the catalyst. At the temperature of 60 °C, the number of C![[double bond, length as m-dash]](https://www.rsc.org/images/entities/char_e001.gif) O groups increased and the amount of CO2 decreased, which indicated that CO2 could be converted into C
O groups increased and the amount of CO2 decreased, which indicated that CO2 could be converted into C![[double bond, length as m-dash]](https://www.rsc.org/images/entities/char_e001.gif) O groups in the reaction. As a result, the catalyst has a good adsorptive ability for COS/CS2/H2S and a good oxidation ability for H2S over time. Therefore, a temperature of 60 °C is conducive to the hydrolysis of COS/CS2 and the oxidation of H2S. The result was in accordance with the activity experiment.
O groups in the reaction. As a result, the catalyst has a good adsorptive ability for COS/CS2/H2S and a good oxidation ability for H2S over time. Therefore, a temperature of 60 °C is conducive to the hydrolysis of COS/CS2 and the oxidation of H2S. The result was in accordance with the activity experiment.
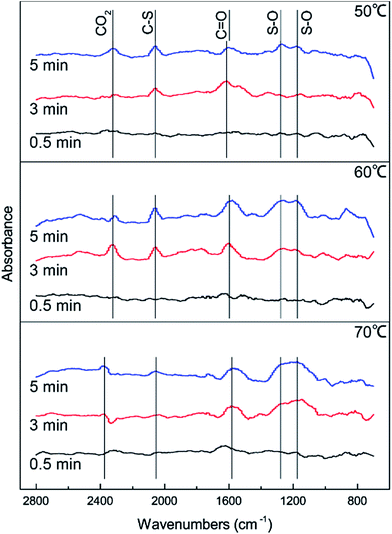 |
| | Fig. 3 DRIFTS spectra of reactions at different temperatures (reaction conditions: 500 ppm H2S; 400 ppm COS; 60 ppm CS2; GHSV = 10![[thin space (1/6-em)]](https://www.rsc.org/images/entities/char_2009.gif) 000 h−1; RH = 49%; O2 = 0%). 000 h−1; RH = 49%; O2 = 0%). | |
3.2 Effects of RH on the simultaneous removal of H2S, COS and CS2
The effects of RH on H2S, COS and CS2 removal were studied by introducing feed gas through a humidifier. Influences of different RHs on the catalytic performance are plotted in Fig. 4. Removal efficiency for H2S, COS and CS2 first increased and then decreased with increasing RH. Low RH should benefit the hydrolysis and oxidation activities. When the RH was 49%, the catalyst showed the best activity, as 100% H2S, COS and CS2 conversion was maintained for about 600 min, 150 min and 180 min respectively. As shown in Fig. 4(d), the sulfur capacity first increased and then decreased with increasing RH. The sulfur capacity was highest (231.28 mgS g−1) when the RH was 49%. The sulfur capacity decreased to 176.50 mgS g−1 at the RH of 60%. The selective catalytic oxidation of H2S to S or HS− will be easier in the presence of less vapor. The fact that excessive water could restrain catalytic activity might be due to competition between H2S (COS or CS2) and vapor for the same active sites of the catalyst.28 Another reason is that the pores of the catalyst’s surface will form water films when the RH reaches a certain amount. Although the formation of water films would provide more accommodating spaces for the product, excessive water films may stop H2S, COS and CS2 diffusing on the hydrolysis center and inhibit the catalytic hydrolysis reaction.29
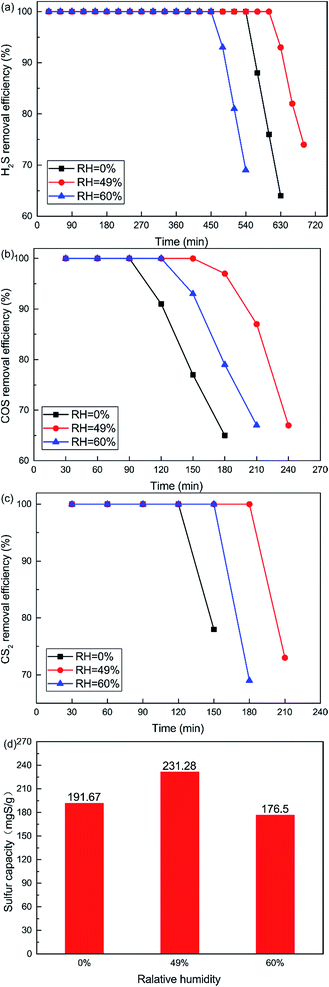 |
| | Fig. 4 Effect of RH on the simultaneous removal of (a) H2S, (b) COS, and (c) CS2, and (d) sulfur capacity (reaction condition: 500 ppm H2S; 400 ppm COS; 60 ppm CS2; reaction temperature = 60 °C; GHSV = 10![[thin space (1/6-em)]](https://www.rsc.org/images/entities/char_2009.gif) 000 h−1; O2 = 0%). 000 h−1; O2 = 0%). | |
In order to further investigate the effect of different RHs on the conversion of H2S, COS and CS2 over Cu–Fe/TSAC, DRIFTS measurements of the catalytic reactions over Cu–Fe/TSAC were taken. As shown in Fig. 5, there was no obvious CO2 peak when the reaction was performed at 0% RH. This indicated that the removal of COS/CS2 was an adsorption process without H2O.1 After introducing H2O (49% RH), a peak due to CO2 appeared over time. This proved that the removal of COS/CS2 with H2O was due to a hydrolysis process. Furthermore, more S–O groups were generated when the RH was 49%, which indicated that H2O promoted the generation of sulfate. Meanwhile, the decrease in CO2 and the increase in C![[double bond, length as m-dash]](https://www.rsc.org/images/entities/char_e001.gif) O groups indicated that H2O promoted the conversion of CO2. It can be deduced that the catalytic hydrolysis reaction occurs on the surface of Cu–Fe/TSAC, where the hydrolysis of COS and CS2 produces CO2 and H2S.
O groups indicated that H2O promoted the conversion of CO2. It can be deduced that the catalytic hydrolysis reaction occurs on the surface of Cu–Fe/TSAC, where the hydrolysis of COS and CS2 produces CO2 and H2S.
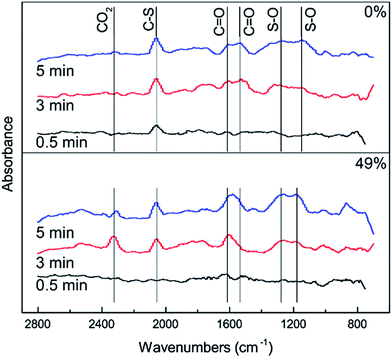 |
| | Fig. 5 DRIFTS spectra of reactions at different RHs (reaction conditions: 500 ppm H2S; 400 ppm COS; 60 ppm CS2; reaction temperature = 60 °C; GHSV = 10![[thin space (1/6-em)]](https://www.rsc.org/images/entities/char_2009.gif) 000 h−1; O2 = 0%). 000 h−1; O2 = 0%). | |
3.3 Effect of O2 content on the simultaneous removal of H2S, COS and CS2
The curves plotted in Fig. 6 show the effect of O2 content on the removal efficiency of H2S, COS and CS2. It is very difficult to control the oxygen content below 0.5%, although we wanted to investigate the lower O2 content. So the non-oxygen conditions were investigated. What is more, the O2 content is extremely low, even close to zero, in closed carbide furnace tail gas which is a reductive atmosphere. The catalytic removal efficiency initially increased and then decreased with increasing O2 content. When the O2 content was 0.5%, the removal efficiency of H2S, COS and CS2 was highest. 100% H2S, COS and CS2 conversion was maintained for about 600 min, 150 min, 180 min respectively. As shown in Fig. 6(d), the sulfur capacity first increased and then decreased with the increase in O2 content. The sulfur capacity was 231.28 mgS g−1 when the O2 content was 0%. When the O2 content was 0.5%, the sulfur capacity increased to 239.18 mgS g−1. With a further increase in O2 content, the sulfur capacity decreased. The sulfur capacity was only 133.98 mgS g−1 when the O2 content was 5%.
 |
| | Fig. 6 Effect of O2 content on the simultaneous removal of (a) H2S, (b) COS, and (c) CS2, and (d) sulfur capacity (reaction conditions: 500 ppm H2S; 400 ppm COS; 60 ppm CS2; reaction temperature = 60 °C; RH = 49%; GHSV = 10![[thin space (1/6-em)]](https://www.rsc.org/images/entities/char_2009.gif) 000 h−1). 000 h−1). | |
It is clear that the addition of a little O2 enhanced the catalytic activity in the COS and CS2 hydrolysis. The reason may be that sufficient oxygen can increase the oxidation of H2S and promote the catalytic hydrolysis of COS and CS2. The oxidation rate of H2S speeds up with the increasing oxygen content. This will lead to the generation of more sulfate, with the inhibition effect greater than the promotion effect.
In order to further investigate the effect of different amounts of O2 on the conversion of H2S, COS and CS2 from Cu–Fe/TSAC, DRIFTS measurements of the catalytic reaction over Cu–Fe/TSAC were taken. As shown in Fig. 7, more S–O groups (related to C![[double bond, length as m-dash]](https://www.rsc.org/images/entities/char_e001.gif) O groups) appeared when the reaction was performed below 5% O2. This indicated that O2 was conducive to the removal of H2S due to the oxidation of H2S.27 Meanwhile, fewer C
O groups) appeared when the reaction was performed below 5% O2. This indicated that O2 was conducive to the removal of H2S due to the oxidation of H2S.27 Meanwhile, fewer C![[double bond, length as m-dash]](https://www.rsc.org/images/entities/char_e001.gif) O groups appeared when the O2 content was 5%, which indicated that O2 mainly promoted the oxidation of H2S but not the conversion of C
O groups appeared when the O2 content was 5%, which indicated that O2 mainly promoted the oxidation of H2S but not the conversion of C![[double bond, length as m-dash]](https://www.rsc.org/images/entities/char_e001.gif) O groups.
O groups.
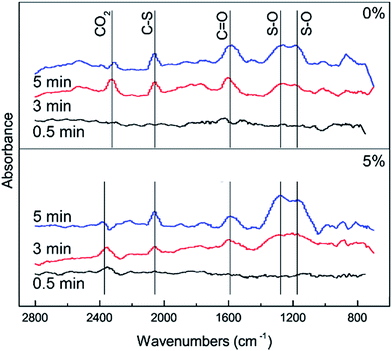 |
| | Fig. 7 DRIFTS spectra of reactions at different amounts of O2 (reaction conditions: 500 ppm H2S; 400 ppm COS; 60 ppm CS2; reaction temperature = 60 °C; GHSV = 10![[thin space (1/6-em)]](https://www.rsc.org/images/entities/char_2009.gif) 000 h−1; RH = 49%). 000 h−1; RH = 49%). | |
3.4 Effect of the gas hourly space velocity on the simultaneous removal of H2S, COS and CS2
As shown in Fig. 8, the removal efficiency for H2S, COS and CS2 decreases with increasing GHSV. 100% H2S, COS and CS2 conversion was maintained for about 600 min, 150 min and 180 min respectively when the GHSV was 10![[thin space (1/6-em)]](https://www.rsc.org/images/entities/char_2009.gif) 000 h−1. As shown in Fig. 8(d), the sulfur capacity was 231.28 mgS g−1 when the GHSV was 10
000 h−1. As shown in Fig. 8(d), the sulfur capacity was 231.28 mgS g−1 when the GHSV was 10![[thin space (1/6-em)]](https://www.rsc.org/images/entities/char_2009.gif) 000 h−1. The sulfur capacity decreased with increasing GHSV, and the capacity was 165.55 mgS g−1 when the GHSV was 20
000 h−1. The sulfur capacity decreased with increasing GHSV, and the capacity was 165.55 mgS g−1 when the GHSV was 20![[thin space (1/6-em)]](https://www.rsc.org/images/entities/char_2009.gif) 000 h−1. At low GHSV, more gases could be adsorbed on the surface of the catalyst. As a result, the catalytic hydrolysis and catalytic oxidation reactions could occur fully. However, a high GHSV decreased the contact time between the gases and the catalyst. This led to the decrease of reaction time and conversion efficiency. Meanwhile, a high GHSV was not conducive to the adsorption of gases on the surface of the catalyst. This further decreased the catalytic efficiency.
000 h−1. At low GHSV, more gases could be adsorbed on the surface of the catalyst. As a result, the catalytic hydrolysis and catalytic oxidation reactions could occur fully. However, a high GHSV decreased the contact time between the gases and the catalyst. This led to the decrease of reaction time and conversion efficiency. Meanwhile, a high GHSV was not conducive to the adsorption of gases on the surface of the catalyst. This further decreased the catalytic efficiency.
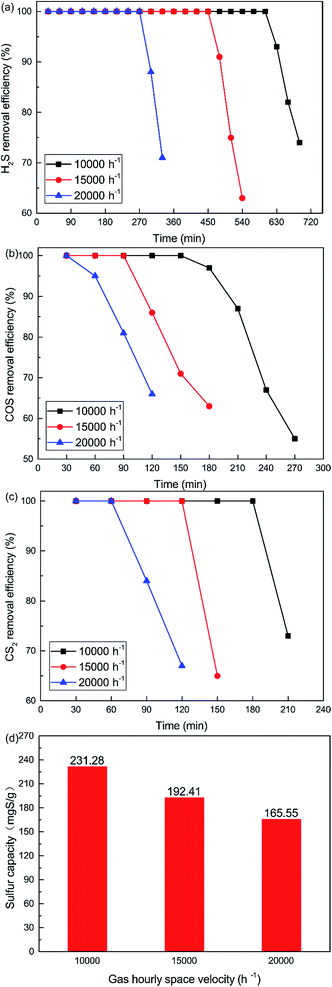 |
| | Fig. 8 Effect of GHSV on the simultaneous removal of (a) H2S, (b) COS, and (c) CS2, and (d) sulfur capacity (reaction conditions: 500 ppm H2S; 400 ppm COS; 60 ppm CS2; reaction temperature = 60 °C; RH = 49%; O2 = 0%). | |
3.5 BET results and reaction process analysis
Nitrogen adsorption isotherms and microporous size distribution for fresh and deactivated Cu–Fe/TSAC are shown in Fig. 9 and Table 1. As shown in Fig. 9 and Table 1, Cu–Fe/TSAC had the characteristics of surface area (554 m2 g−1), microporous volume (0.21 cm3 g−1) and total pore volume (0.29 cm3 g−1). The N2 adsorption quantity, microporous volume and surface area in the deactivated catalyst obviously decreased, which indicated that the adsorptive ability of the catalyst decreased over time. This affected the desulfurization ability of the catalyst. The XPS characterization results and the data of fresh and deactivated Cu–Fe/TSAC (S2p) are shown in Fig. 10 and Table 2. From the XPS results, it could be found that the thiol/thioether, S, –SO–, and sulfate amounts increased from 0% to 1.92%, 2.90%, 0.83% and 1.25% respectively. This indicated that the deactivation of the catalyst was attributed to the formation of S containing components, such as thiol/thioether, S, –SO– and sulfate. Combined with the BET results, the formation of Cu2O led to the decrease of the microporous volume and surface area.
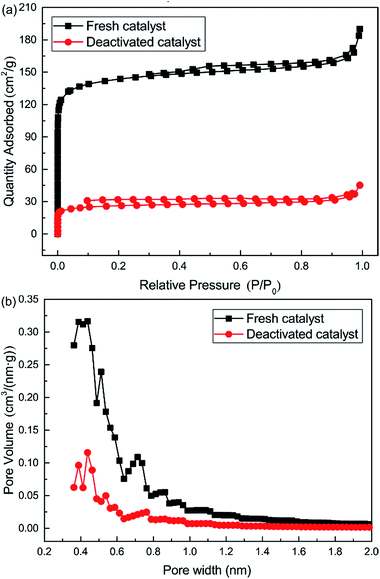 |
| | Fig. 9 (a) Nitrogen adsorption isotherms and (b) pore size distribution (<2.0 nm) for fresh and deactivated Cu–Fe/TSAC. | |
Table 1 Porosity parameters for fresh and deactivated Cu–Fe/TSAC
| Samples |
Surface area (m2 g−1) |
Total pore volume (cm3 g−1) |
Micropore volume (cm3 g−1) |
| Fresh catalyst |
554 |
0.29 |
0.21 |
| Deactivated catalyst |
98 |
0.07 |
0.04 |
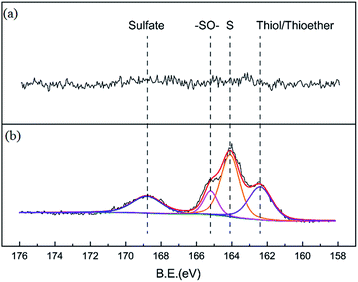 |
| | Fig. 10 XPS characterization results for (a) fresh and (b) deactivated Cu–Fe/TSAC. | |
Table 2 XPS data for fresh and deactivated Cu–Fe/TSAC
| Sample |
Elements |
Binding energy (eV) |
Amount (%) |
Chemical speciation |
| Fresh catalyst |
S2p |
— |
— |
— |
| Deactivated catalyst |
S2p |
162.41 |
1.92 |
Thiol/thioether |
| S2p |
164.09 |
2.90 |
S |
| S2p |
165.22 |
0.83 |
–SO– |
| S2p |
168.83 |
1.25 |
Sulfate |
According to previous experimental results, the removal processes of COS, CS2 and H2S could be divided into two parts: the catalytic hydrolysis reaction and the catalytic oxidation reaction. In the removal processes, COS and CS2 were first hydrolyzed into H2S, and then H2S was oxidized into S/sulfates. Combined with previous DRIFTS results, the removal processes of COS and CS2 were different. For the removal of CS2, CS2 and H2O were first adsorbed on the surface of the catalyst, and then the hydrolysis reaction occurred under the effect of surface functional groups and CuO. However, COS had not been found on the deactivated catalyst, which indicated that gaseous COS directly reacted with adsorbed H2O under the effect of surface functional groups and CuO. Furthermore, the conversion process for H2S could be regarded as H2S → S → SO2 → SO42−. As mentioned above, the possible reaction process diagram is shown in Fig. 11. As shown in Fig. 11, the main reactions on the surface of the catalyst were as follows.
| |
 | (2) |
| |
 | (3) |
| |
 | (4) |
| |
 | (5) |
| |
 | (6) |
| |
 | (7) |
| |
 | (8) |
| |
 | (9) |
| |
 | (10) |
| |
 | (11) |
| |
 | (12) |
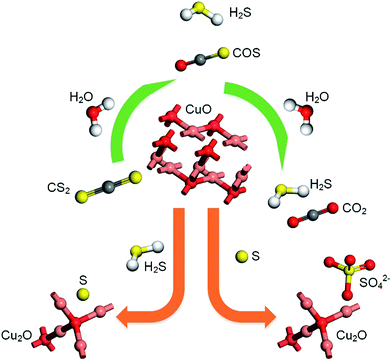 |
| | Fig. 11 Reaction process diagram. | |
In these reactions, * represents the hydrolysis activity center and Θ represents the oxidation activity center. Eqn (2)–(9) are the catalytic hydrolysis processes and eqn (10)–(12) are the catalytic oxidation processes.
4. Conclusions
Modified tobacco stem active carbon (Cu–Fe/TSAC) was prepared by a sol–gel method, and tested for the simultaneous removal efficiency of H2S, COS and CS2. The influences of reaction conditions for the removal of H2S, COS and CS2 were investigated. A high reaction temperature improved the hydrolysis and oxidation efficiency, but accelerated the deactivation of the catalyst. DRIFTS results indicated that the deactivation was attributed to the generation of S and sulfates. Excessive water films decreased the diffusion of H2S, COS and CS2 on the hydrolysis center, and inhibited the catalytic hydrolysis reaction. DRIFTS results indicated that H2O promoted the generation of sulfate. Appropriate O2 content directly promoted the oxidation of H2S, and indirectly promoted the hydrolysis of COS and CS2. DRIFTS results indicated that the enhancement of hydrolysis of COS/CS2 was attributable to the promotion effect of O2 for H2S oxidation. A high GHSV decreased the contact time between the gases and the catalyst. Meanwhile, a high GHSV was not conducive to the adsorption of gases on the surface of the catalyst. XPS results indicated that the deactivation of the catalyst was attributed to the formation of S containing components, such as thiol/thioether, S, –SO–, and sulfate. BET results indicated that the adsorptive ability of the catalyst was related to the microporous volume and surface area.
Conflicts of interest
There are no conflicts to declare.
Acknowledgements
This work was supported by the National Natural Science Foundation [51708266, 21667015 and 51408282], the China Scholarship Council [201508530017, 201608530169 and 201608740011], the Analysis and Testing Foundation of Kunming University of Science and Technology and the Research Fund Program of Guangdong Provincial Key Laboratory of Environmental Pollution Control and Remediation Technology [2018K23].
Notes and references
- X. Song, P. Ning, C. Wang, K. Li, L. Tang, X. Sun and H. Ruan, Chem. Eng. J., 2017, 314, 418–433 CrossRef CAS.
- Y. Yang, Y. Shi and N. Cai, Fuel, 2016, 181, 1020–1026 CrossRef CAS.
- J. Qiu, P. Ning, X. Q. Wang, K. Li, W. Liu, W. Chen and L. L. Wang, Front. Environ. Sci. Eng., 2016, 10, 11–18 CrossRef CAS.
- S. Ibrahim, A. Al Shoaibi and A. K. Gupta, Fuel, 2015, 150, 1–7 CrossRef CAS.
- X. F. Jiang, H. Huang, Y. F. Chai, T. L. Lohr, S. Y. Yu, W. Lai, Y. J. Pan, M. Delferro and T. J. Marks, Nat. Chem., 2017, 9, 188–193 CrossRef CAS PubMed.
- H. Huang, N. Young, B. P. Williams, S. H. Taylor and G. Hutchings, Catal. Lett., 2006, 110, 243–246 CrossRef CAS.
- C. Rhodes, S. A. Riddel, J. West, B. P. Williams and G. J. Hutchings, Catal. Today, 2000, 59, 443–464 CrossRef CAS.
- H. H. Yi, K. Li, X. L. Tang, P. Ning, J. H. Peng, C. Wang and D. He, Chem. Eng. J., 2013, 230, 220–226 CrossRef CAS.
- L. Wang, D. Y. Wu, S. D. Wang and Q. Yuan, J. Environ. Sci., 2008, 20, 436–440 CrossRef CAS.
- K. Li, X. Song, G. Zhang, C. Wang, P. Ning, X. Sun and L. Tang, RSC Adv., 2017, 7, 40354–40361 RSC.
- S. Z. Zhao, H. H. Yi, X. L. Tang, F. Y. Gao, Q. J. Yu, Y. S. Zhou, J. E. Wang, Y. H. Huang and Z. Y. Yang, Ultrason. Sonochem., 2016, 32, 336–342 CrossRef CAS PubMed.
- K. Li, X. Song, P. Ning, H. Yi, X. Tang and C. Wang, Energy Technol., 2015, 3, 136–144 CrossRef CAS.
- H. H. Yi, S. Z. Zhao, X. L. Tang, C. Y. Song, F. Y. Gao, B. W. Zhang, Z. X. Wang and Y. R. Zuo, Fuel, 2014, 128, 268–273 CrossRef CAS.
- S. Zhao, H. Yi, X. Tang and C. Song, Chem. Eng. J., 2013, 226, 161–165 CrossRef CAS.
- X. Song, P. Ning, L. H. Tang, X. Sun, Y. Mei, C. Wang and K. Li, J. Chem. Eng. Jpn., 2017, 50, 115–121 CrossRef CAS.
- X. Song, K. Li, P. Ning, L. H. Tang, X. Sun, H. T. Ruan, Y. Mei and C. Wang, Fresenius Environ. Bull., 2016, 25, 4952–4958 CAS.
- F. Mohammadzadeh, M. Jahanshahi and A. M. Rashidi, Appl. Surf. Sci., 2012, 259, 159–165 CrossRef CAS.
- S. Shu, J. Guo, X. Liu, X. Wang, H. Yin and D. Luo, Appl. Surf. Sci., 2016, 360, 684–692 CrossRef CAS.
- A. Ryzhikov, V. Hulea, D. Tichit, C. Leroi, D. Anglerot, B. Coq and P. Trens, Appl. Catal., A, 2011, 397, 218–224 CrossRef CAS.
- S. Zhao, H. Yi, X. Tang, D. Kang, H. Wang, K. Li and K. Duan, Appl. Clay Sci., 2012, 56, 84–89 CrossRef CAS.
- V. Saheb, M. Alizadeh, F. Rezaei and S. Shahidi, Comput. Theor. Chem., 2012, 994, 25–33 CrossRef CAS.
- D. Barba, F. Cammarota, V. Vaiano, E. Salzano and V. Palma, Fuel, 2017, 198, 68–75 CrossRef CAS.
- W. Li, J. Peng, L. Zhang, H. Xia, N. Li, K. Yang and X. Zhu, Ind. Crops Prod., 2008, 28, 73–80 CrossRef.
- W. Li, L. Zhang, J. Peng, N. Li and X. Zhu, Ind. Crops Prod., 2008, 27, 341–347 CrossRef CAS.
- P. Liu and E. J. M. Hensen, J. Am. Chem. Soc., 2013, 135, 14032–14035 CrossRef CAS PubMed.
- S. Velu, V. Ramkumar, A. Narayanan and C. S. Swamy, J. Mater. Sci., 1997, 32, 957–964 CrossRef CAS.
- X. Song, K. Li, P. Ning, C. Wang, X. Sun, L. Tang, H. Ruan and S. Han, Appl. Surf. Sci., 2017, 425, 130–140 CrossRef CAS.
- K. V. Bineesh, D. K. Kim, D. W. Kim, H. J. Cho and D. W. Park, Energy Environ. Sci., 2010, 3, 302–310 CAS.
- C. Wilson and D. M. Hirst, J. Chem. Soc., Faraday Trans., 1995, 91, 793–798 RSC.
|
| This journal is © The Royal Society of Chemistry 2018 |
Click here to see how this site uses Cookies. View our privacy policy here.  Open Access Article
 *a,
Ping Ning
 *a and
Chi Wangb
![[double bond, length as m-dash]](https://www.rsc.org/images/entities/char_e001.gif) O groups played important roles in the desulfurization process.17–19 –OH promoted the hydrolysis of COS and CS2, and –COO and –C
O groups played important roles in the desulfurization process.17–19 –OH promoted the hydrolysis of COS and CS2, and –COO and –C![[double bond, length as m-dash]](https://www.rsc.org/images/entities/char_e001.gif) O groups promoted the oxidation of H2S.20–22 Furthermore, CO2 could be converted into –COO and –C
O groups promoted the oxidation of H2S.20–22 Furthermore, CO2 could be converted into –COO and –C![[double bond, length as m-dash]](https://www.rsc.org/images/entities/char_e001.gif) O groups during this process, which enhanced the removal of H2S. However, there are few studies on the simultaneous removal of H2S, COS and CS2, and the detailed changes in surface functional groups during the desulfurization process under different reaction conditions were unknown. Therefore, this study is important and valuable.
O groups during this process, which enhanced the removal of H2S. However, there are few studies on the simultaneous removal of H2S, COS and CS2, and the detailed changes in surface functional groups during the desulfurization process under different reaction conditions were unknown. Therefore, this study is important and valuable.![[thin space (1/6-em)]](https://www.rsc.org/images/entities/char_2009.gif) 000–20
000–20![[thin space (1/6-em)]](https://www.rsc.org/images/entities/char_2009.gif) 000 h−1. The water comes from a saturator system, and the relative humidity (RH) was 0–60%. The reaction temperature of this reactor was controlled at 50–70 °C by a water-bath with a circulating pump, with an accuracy of ±0.1 °C. FULI 9790II gas chromatography was used to analyze the total H2S, COS and CS2 concentrations of the gaseous feed and effluent from the reactor. The conversion rates of H2S, COS and CS2 are achieved according to eqn (1).
000 h−1. The water comes from a saturator system, and the relative humidity (RH) was 0–60%. The reaction temperature of this reactor was controlled at 50–70 °C by a water-bath with a circulating pump, with an accuracy of ±0.1 °C. FULI 9790II gas chromatography was used to analyze the total H2S, COS and CS2 concentrations of the gaseous feed and effluent from the reactor. The conversion rates of H2S, COS and CS2 are achieved according to eqn (1).
![[double bond, length as m-dash]](https://www.rsc.org/images/entities/char_e001.gif) O groups (1604 cm−1), C–S groups (2080 cm−1) and S–O groups (1140 cm−1 and 1307 cm−1) as the reaction proceeds.1,26,27 Furthermore, CO2 was produced as the reaction time progressed, which can prove that the reaction is indeed the hydrolysis of COS and CS2. The formation of S–O groups can prove that the H2S was oxidized. Compared with reactions at 60 °C and 70 °C, fewer S–O groups were generated at 50 °C. This indicated that a temperature of 50 °C was not conducive to the oxidation of H2S. Compared with reactions at 50 °C and 60 °C, more S–O groups and fewer C–S groups were generated at 70 °C. This indicated that a temperature of 70 °C enhanced the hydrolysis of COS/CS2 and the oxidation of H2S. However, excessive oxidation of H2S could generate more sulfate, which could lead to the deactivation of the catalyst. At the temperature of 60 °C, the number of C
O groups (1604 cm−1), C–S groups (2080 cm−1) and S–O groups (1140 cm−1 and 1307 cm−1) as the reaction proceeds.1,26,27 Furthermore, CO2 was produced as the reaction time progressed, which can prove that the reaction is indeed the hydrolysis of COS and CS2. The formation of S–O groups can prove that the H2S was oxidized. Compared with reactions at 60 °C and 70 °C, fewer S–O groups were generated at 50 °C. This indicated that a temperature of 50 °C was not conducive to the oxidation of H2S. Compared with reactions at 50 °C and 60 °C, more S–O groups and fewer C–S groups were generated at 70 °C. This indicated that a temperature of 70 °C enhanced the hydrolysis of COS/CS2 and the oxidation of H2S. However, excessive oxidation of H2S could generate more sulfate, which could lead to the deactivation of the catalyst. At the temperature of 60 °C, the number of C![[double bond, length as m-dash]](https://www.rsc.org/images/entities/char_e001.gif) O groups increased and the amount of CO2 decreased, which indicated that CO2 could be converted into C
O groups increased and the amount of CO2 decreased, which indicated that CO2 could be converted into C![[double bond, length as m-dash]](https://www.rsc.org/images/entities/char_e001.gif) O groups in the reaction. As a result, the catalyst has a good adsorptive ability for COS/CS2/H2S and a good oxidation ability for H2S over time. Therefore, a temperature of 60 °C is conducive to the hydrolysis of COS/CS2 and the oxidation of H2S. The result was in accordance with the activity experiment.
O groups in the reaction. As a result, the catalyst has a good adsorptive ability for COS/CS2/H2S and a good oxidation ability for H2S over time. Therefore, a temperature of 60 °C is conducive to the hydrolysis of COS/CS2 and the oxidation of H2S. The result was in accordance with the activity experiment.
![[thin space (1/6-em)]](https://www.rsc.org/images/entities/char_2009.gif) 000 h−1; RH = 49%; O2 = 0%).
000 h−1; RH = 49%; O2 = 0%).![[double bond, length as m-dash]](https://www.rsc.org/images/entities/char_e001.gif) O groups indicated that H2O promoted the conversion of CO2. It can be deduced that the catalytic hydrolysis reaction occurs on the surface of Cu–Fe/TSAC, where the hydrolysis of COS and CS2 produces CO2 and H2S.
O groups indicated that H2O promoted the conversion of CO2. It can be deduced that the catalytic hydrolysis reaction occurs on the surface of Cu–Fe/TSAC, where the hydrolysis of COS and CS2 produces CO2 and H2S.
![[thin space (1/6-em)]](https://www.rsc.org/images/entities/char_2009.gif) 000 h−1; O2 = 0%).
000 h−1; O2 = 0%).![[double bond, length as m-dash]](https://www.rsc.org/images/entities/char_e001.gif) O groups) appeared when the reaction was performed below 5% O2. This indicated that O2 was conducive to the removal of H2S due to the oxidation of H2S.27 Meanwhile, fewer C
O groups) appeared when the reaction was performed below 5% O2. This indicated that O2 was conducive to the removal of H2S due to the oxidation of H2S.27 Meanwhile, fewer C![[double bond, length as m-dash]](https://www.rsc.org/images/entities/char_e001.gif) O groups appeared when the O2 content was 5%, which indicated that O2 mainly promoted the oxidation of H2S but not the conversion of C
O groups appeared when the O2 content was 5%, which indicated that O2 mainly promoted the oxidation of H2S but not the conversion of C![[double bond, length as m-dash]](https://www.rsc.org/images/entities/char_e001.gif) O groups.
O groups.
![[thin space (1/6-em)]](https://www.rsc.org/images/entities/char_2009.gif) 000 h−1; RH = 49%).
000 h−1; RH = 49%).![[thin space (1/6-em)]](https://www.rsc.org/images/entities/char_2009.gif) 000 h−1. As shown in Fig. 8(d), the sulfur capacity was 231.28 mgS g−1 when the GHSV was 10
000 h−1. As shown in Fig. 8(d), the sulfur capacity was 231.28 mgS g−1 when the GHSV was 10![[thin space (1/6-em)]](https://www.rsc.org/images/entities/char_2009.gif) 000 h−1. The sulfur capacity decreased with increasing GHSV, and the capacity was 165.55 mgS g−1 when the GHSV was 20
000 h−1. The sulfur capacity decreased with increasing GHSV, and the capacity was 165.55 mgS g−1 when the GHSV was 20![[thin space (1/6-em)]](https://www.rsc.org/images/entities/char_2009.gif) 000 h−1. At low GHSV, more gases could be adsorbed on the surface of the catalyst. As a result, the catalytic hydrolysis and catalytic oxidation reactions could occur fully. However, a high GHSV decreased the contact time between the gases and the catalyst. This led to the decrease of reaction time and conversion efficiency. Meanwhile, a high GHSV was not conducive to the adsorption of gases on the surface of the catalyst. This further decreased the catalytic efficiency.
000 h−1. At low GHSV, more gases could be adsorbed on the surface of the catalyst. As a result, the catalytic hydrolysis and catalytic oxidation reactions could occur fully. However, a high GHSV decreased the contact time between the gases and the catalyst. This led to the decrease of reaction time and conversion efficiency. Meanwhile, a high GHSV was not conducive to the adsorption of gases on the surface of the catalyst. This further decreased the catalytic efficiency.


