DOI:
10.1039/C7RA12112A
(Paper)
RSC Adv., 2018,
8, 9423-9429
Seawater splitting for hydrogen evolution by robust electrocatalysts from secondary M (M = Cr, Fe, Co, Ni, Mo) incorporated Pt
Received
4th November 2017
, Accepted 13th February 2018
First published on 6th March 2018
Abstract
Water splitting is a promising technique for clean hydrogen energy harvesting. The creation of cost-effective electrocatalysts with improved hydrogen evolution reaction (HER) activity and stability is crucial in realizing persistent hydrogen evolution by reducing the reaction overpotential and minimizing energy consumption. Herein, we present the preparation of alloyed PtM (M = Cr, Fe, Co, Ni, Mo) modified titanium (Ti) mesh by a simple electrodeposition method, aiming at hydrogen generation from seawater splitting. The preliminary results indicate that the Ti/PtM electrodes feature markedly reduced onset overpotentials and Tafel slopes as well as significantly increased exchange current densities compared with pristine Pt electrodes, arising from the incorporation of secondary M atoms into the Pt lattice for alloying effects. Moreover, the competitive dissolution reaction between guest M species to Pt with Cl2 in seawater is beneficial for enhancing the long-term stability of resultant PtM alloy electrodes. The optimized PtMo alloy electrode maintains 91.13% of the initial current density upon 172 h operation in real seawater, making it promising in practical applications.
Introduction
With the increasing demands for energy harvesting accompanied by environmental pollution and global warming by utilizing fossil fuels, hydrogen is regarded as one of the most promising candidates for substituting fossil energy due to its zero emission and clean nature. So far, considerable attention has been paid to both experimental and theoretical aspects.1–3 As one of the efficient energy conversion methods, the hydrogen evolution reaction (HER) is extensively studied for directly converting water into hydrogen (H2) and oxygen (O2) on the surface of catalytic electrodes.4–6 However, freshwater resources shortage is another challenge for facing population growth and improving living standards. In addition, the acids and alkali are always utilized to increase ionic conductivity, therefore realizing loops during the electrolysis process. However, the state-of-the-art catalytic electrodes will suffer chemical dissolution in such non-neutral aqueous solutions. Nearly 70% of the earth is covered with neutral seawater, and it can spit into Na+ and Cl− as well as other ions. The gigantic cations and anions in seawater are beneficial to the charge transportation, so it is significant to directly split seawater into H2 and O2 on the surface of catalytic electrodes through complicated HER processes.
The theoretical voltage of water splitting is about 1.23 V, but a much higher value of 1.8–2.0 V is required for commercial electrolyzers due to the over-potentials of HER.7,8 In this fashion, a catalytic electrode with low overpotential, high electrochemical stability and good electrocatalytic activity is expected to realize effective water electrolysis. Pt/C is the preferred electrode material for HER due to its low overpotential and fast charge transfer kinetics. But its commercial application is still hindered by the high cost and limited resources.9,10 To address this issue, various cost-effective cathode materials have been made to replace Pt/C, them can be divided into three types: (i) RANEY® nickel comprising of nickel and zinc or aluminium elements,11,12 (ii) nickel based alloys such as NiMo, NiMoFe, NiSe, NiS2, etc.,13–15 (iii) other transition element alloys including FeMoR (R = rare earth metal), CuAg, FeTi, etc.15–17 These candidates have characteristics in large specific-surface area and/or catalytic activities, but the chemical dissolution of Ni and other transition metals can significantly reduce the long-term stability under persistent operation. The improved long-term stability is believed to be equally important to high catalytic activity in practical applications. Azevedo et al. have found that CuO electrocatalyst has good stability over more than 50 h of light chopping.18 Li et al. introduced Ti nitride/Ti oxide composites to water splitting, and the catalytic performances are maximized by optimizing electrode materials.19 Molybdenum carbide nanoparticles were also demonstrated for HER, yielding good stability over four weeks.20 Subsequently, other transition metal carbides (WC, Mo2C, TaC, NbC) were also applicable as potential electrocatalysts for water splitting processes.21 However, the above-mentioned Pt-free candidates with semiconducting nature suffer electron loss and increased overpotentials because of their low conductivities.
Non-precious metals such as chromium (Cr), iron (Fe), cobalt (Co), nickel (Ni) and molybdenum (Mo) can react with produced Cl2 gas at anode to form competitive dissolution reactions to Pt. These competitive reactions can efficiently drag the dissolution of Pt species. Therefore, incorporation of secondary transition metal to Pt is a promising strategy to increase electrode stability. In addition, those transition metals with large surface area have extraordinary electrocatalytic performances toward HER processes. According to Brewer–Engel theory,22 chemisorptive bonds are easily formed between unpaired d-band electrons and the electrons of hydrogen atoms,23–25 which is in favour of hydrogen production. It is noteworthy to mention that the transition metal atoms have a large number of unpaired d-band electrons and unfilled d-orbital, making them most promising materials for electrocatalytic hydrogen evolution. In the current work, we would like to incorporate secondary metallic M (M = Cr, Fe, Co, Ni, Mo) to Pt lattice using titanium (Ti) mesh as a placeholder. The alloying effect in either electron redistribution or competitive dissolution reactions can help alloyed PtM electrodes increase their catalytic properties and long-term stability. By carefully characterizing catalytic activity for seawater splitting, the PtMo alloy electrode is regarded as the most promising for HER.
Experimental
Preparation of Ti mesh supported PtM alloy electrodes
The Ti/PtM electrodes were prepared according to following procedures: a precursor was obtained by mixing 35 mL of 1 mM H2PtCl6 aqueous solution and 1.17 mL of 3 mM CrCl3, FeSO4, CoSO4, NiSO4 or NiSO4 aqueous solution. The catalytic electrodes were made by a cyclic voltammetry (CV) technique using an Ag/AgCl as a reference electrode, a Pt sheet as a counter electrode, a cleaned Ti mesh (the exposed surface area was 1.93 mm2 per mm2 Ti mesh) as a working electrode, and above-mentioned precursor solution as a supporting electrolyte. By scanning in a potential window of −0.8 to +0.6 V at a scan rate of 10 mV s−1 for fifteen cycles, the final Ti mesh supported PtM alloy electrodes were thus obtained and subsequently rinsed with deionized water and dried at 60 °C for 30 min in vacuum.26
Electrochemical characterizations
All electrochemical performances were performed on a CHI660E electrochemical workstation using atypical three-electrode setup in seawater at room temperature, which comprised a platinum sheet, a Ti mesh supported PtM and an Ag/AgCl electrode as the counter electrode, working electrode and reference electrode, respectively. The electrodic reactions were evaluated by linear sweep voltammetry (LSV) at a scan rate of 10 mV s−1. Electrochemical impedance spectrum (EIS) was performed in a frequency window ranging from 100 kHz to 0.1 Hz with bias of −0.4 to −1.4 V and an amplitude of 10 mV.
Characterizations
The morphologies of the electrodes were observed on a scanning electron microscope (SEM, SU8020), while the X-ray diffraction (XRD) profiles were recorded with an X-ray powder diffractometer (Philips, Netherlands) at 2θ = 20–60°. X-ray photoelectric spectra (XPS) were collected on a RBD upgraded PHI-5000C ESCA system with Mg Kα radiation (hγ = 1253.6 eV). The crystal structures were studied on a field-emission transmission electron microscope (HRTEM, Tecnai G2 F20).
Results and discussion
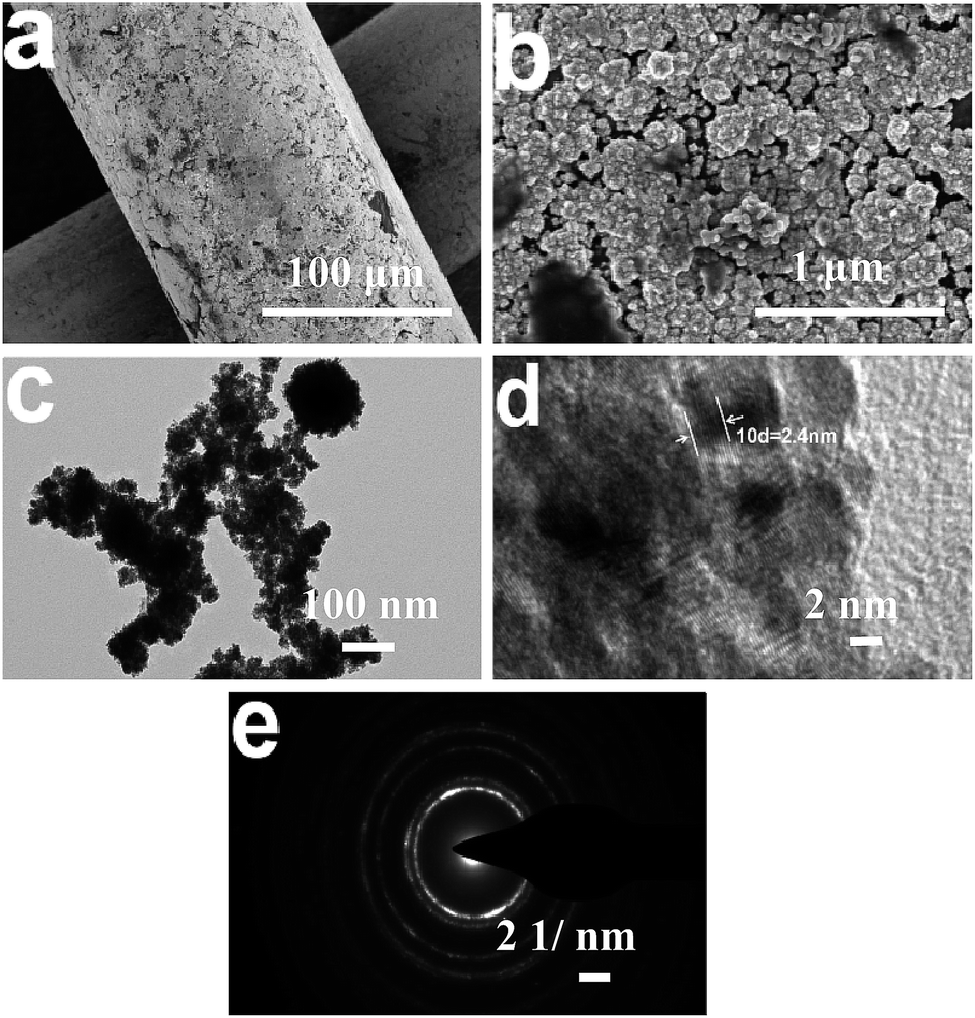
Fig. 1a shows the top-view SEM images of Ti mesh supported PtMo alloy electrode, suggesting that PtMo catalysts are homogeneously distributed on Ti mesh. Deep observation in Fig. 1b and c reveals a nanoparticle-structured PtMo catalyst with particle size < 10 nm.27 The lattice fringe shows a lattice distance of 0.24 nm (Fig. 1d), which is larger than 0.23 nm for the (111) plane of face-centered Pt. The result indicates that the alloying of guest M atoms with host Pt does not apparently change crystal structure of Pt lattice (Fig. 1e). However, the entering of M into Pt lattice increases the crystal size of Pt.
 |
| | Fig. 1 (a) and (b) Top-view SEM images of Ti mesh supported PtMo electrode. (c) and (d) TEM photographs and (e) electron diffraction pattern of the alloyed PtMo catalyst. | |
Additionally, we can find enormous lattice distortions and plenty of defects in HRTEM image (Fig. 1d), which produce gigantic active sites for hydrogen bonding and subsequent HER processes.
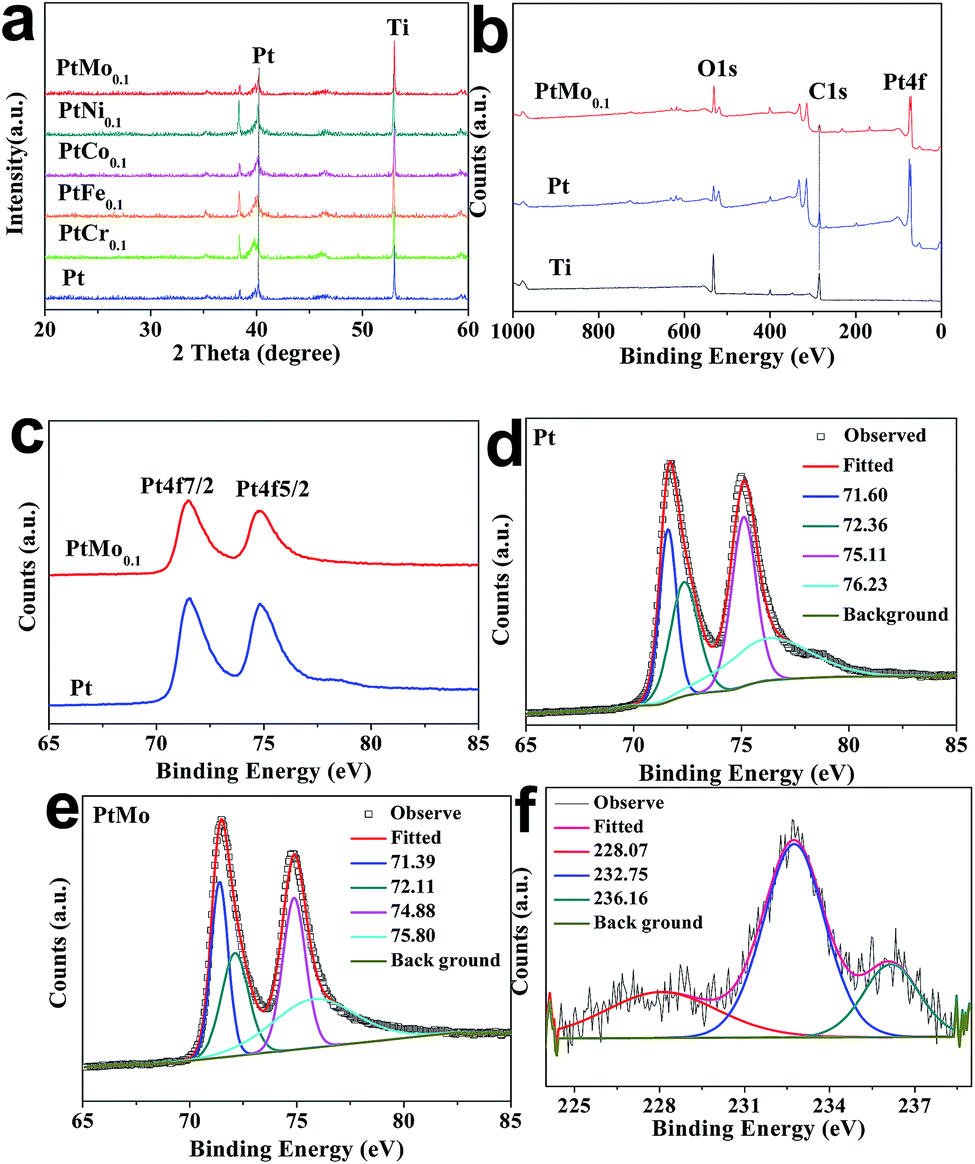
The XRD profiles of Ti mesh supported Pt or PtM electrodes are performed to determine the crystal structure, as shown in Fig. 2a. The distinctive diffraction peak centered at 2θ = 40.18° corresponds to Pt (111) and the peak at 2θ = 46.24° is for Pt (200) crystal plane, suggesting the face cubic crystal (FCC) structure of Pt (PDF#04-0802). However, the peaks have shifted by alloying Pt with M species, and there is a significant reduction in peak intensity and an obvious broadening of diffraction peaks for PtM alloy. This demonstrates a nanometric crystal structure or partially-amorphous structure in PtM electrode. The peak change is attributed to the incorporation of secondary M (Cr, Fe, Co, Ni, Mo) atoms into FCC Pt lattice and formation of PtM alloys.28 No detection of diffraction peaks for M species indicates that the M atoms have been completely incorporated into Pt structure to form PtM alloys. To study how transition metals impact the crystal structure of FCC Pt, we compare the lattice constants of the guest M and host Pt, showing 2.88, 2.87, 2.51, 3.53, 3.15 and 3.93 Å for Cr, Fe, Co, Ni, Mo and Pt, respectively. In this fashion, the guest M with lower crystal lattices may enter Pt lattice during alloying processes to tune electronic structure of Pt, creating many defects or active sites for HER.
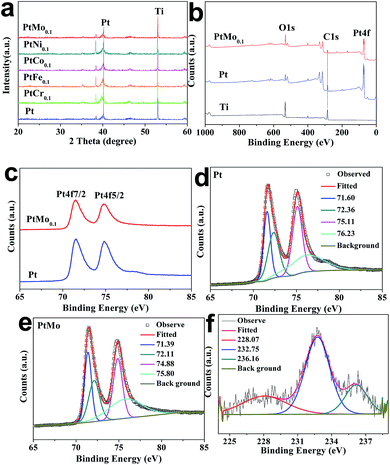 |
| | Fig. 2 (a) XRD patterns and (b) full-scan XPS spectra of various catalysts. (c) Magnified XPS spectra for characteristic Pt peaks. The peak-fitting of Pt peaks for (d) pristine Pt and (e) PtMo alloy. (f) The peak-fitting of Mo peaks for PtMo alloy. | |
XPS analysis is carried out to determine the possible changes in binding energies, oxidation state and the surface compositions of different catalytic electrodes. As shown in Fig. 2b and c, the binding energies at 71.6 and 74.8 eV (binding energy difference ΔE = 3.2 eV) correspond to the Pt4f7/2 and Pt4f5/2 core electrons, respectively. This result indicates the resultant Pt species are in their metallic state. One can find from Table 1 that the peak positions of Pt4f of PtMo are detected at around 71.39 and 74.88 eV, which have an offset in comparing with Pt 71.60 and 75.11 eV, resulting a downshift of 0.21 and 0.23 eV, respectively. The decreased binding energies of Pt4f core electrons may be attributed to electronic interactions between the atomic orbitals of Pt and M, resulting in partial electron transfer from M to Pt. Fig. 2f shows two peaks at the binding energies of 228.07 and 232.75 eV, which is attributed to the doublet Mo3d3/2 and Mo3d5/2, respectively, accompanied by 0.93 and 0.45 eV downshift compared with pure Mo (229.0 and 233.3 eV).29 The weak peak at 236.16 eV corresponding to MoO3 suggests that a small portion of Mo is in its oxidation state. Moreover, we can see that the element ratio of Pt and Mo obtained from XPS is 8![[thin space (1/6-em)]](https://www.rsc.org/images/entities/char_2009.gif) :1, as summarized in Table 2, this cross-checks that the feed ratio in experimental process agrees well with the final atomic ratio.
:1, as summarized in Table 2, this cross-checks that the feed ratio in experimental process agrees well with the final atomic ratio.
Table 1 The peak positions of Pt4f7/2 and Pt4f5/2 bands for Pt and PtMo electrodes
| Peaks |
Pt |
PtMo |
Offset (eV) |
| Pt4f2/7 (eV) |
71.60 |
71.39 |
0.21 |
| Pt4f2/5 (eV) |
75.11 |
74.88 |
0.23 |
Table 2 The XPS values of PtMo coating electrode
| Name |
Start BE |
Peak BE |
End BE |
Height CPS |
FWHM (eV) |
Area(P) CPS (eV) |
Atomic% |
| Pt4f |
82.83 |
71.515 |
67.33 |
26792.25 |
1.408 |
85737.8997 |
29.464 |
| Mo3d |
240.08 |
232.734 |
224.18 |
1625.582 |
1.98 |
6989.687 |
3.792 |
| C1s |
295.48 |
286.689 |
280.13 |
3406.984 |
1.404 |
11005.1702 |
66.744 |
The HER at electrode/seawater interface is considered as a multi-step process.30,31 The first step is Volmer or discharge reaction: an electron transfers to the catalytic electrode and couples with a proton, which is adsorbed on the empty active sites of the electrode to obtain absorbed hydrogen atom. In acidic electrolytes, the proton source is contributed to hydronium cation (H3O+), it is H2O molecule in alkaline solutions. The second step is Heyrovsky reaction: (i) an electron combines with a hydrogen atom and a proton to release a H2 molecule; (ii) two absorbed hydrogen atoms combine on the electrode surface to yield H2, which is known as Tafel reaction.
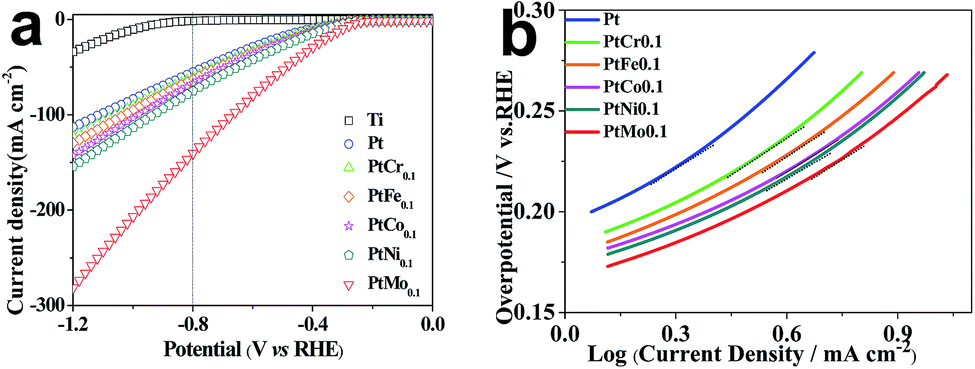
Electrochemical characterizations are performed to study the HER performance of different catalytic electrodes. LSV is carried out in real seawater at a scan rate of 10 mV s−1 to evaluate the electrocatalytic activity of different alloys toward HER and the corresponding curves are plotted in Fig. 3a. The hydrogen evolution initial potential value of Pt coating electrode is −186.20 mV which is consist with literature report, while the value of binary alloy electrodes of PtCr, PtFe, PtCo, PtNi and PtMo are determined to be −166.03, −157.69, −149.93, −147.75 and −142.50 mV, respectively, which are obviously lower than the values for other alloys such as nickel based alloy catalysts,32 RuCo and RuCoMox alloys.33 Obviously, the binary alloys tailored catalytic electrodes have lower initial hydrogen evolution potential than Ti/Pt electrode. This reflects a lower energy requirement and facile HER process for Ti/PtM electrode. The improved catalytic performances arise from promoting diffusion and exchange of electrons upon alloying effects. Simultaneously, the cathodic current density reflects the reaction rate, a larger current density means a faster reaction rate. Fig. 3a shows that the current densities of Pt, PtCr, PtFe, PtCo, PtNi and PtMo tailored catalytic electrodes are −55.5, −60.9, −63.2, −67.8, −75.2 and −141.0 mA cm−2 at −0.8 V vs. RHE, respectively. Obviously, the Ti/PtMo electrode has the maximized catalytic activity. The improved performance of the electrocatalytic activity is attributed to the synergistic interaction of different atoms in alloy. According to the Brewer–Engel theory, electrons are easily transferred to H2O molecules through d-orbital electrons to break O–H bonds. While the half or completely empty d-orbital atoms may facilitate the adsorption of H atoms. A ‘volcano’ shaped curve of the catalytic properties of different elements for HER has been previously determined, 3d series of metal atoms located in the right side of the periodic table (such as Fe, Co, Ni) and the left side series metal atoms with extended d-orbitals (such as Mo, Cr, W) form an alloy, which improve the catalytic activity for HER.34 So, the catalytic electrode tailored with PtMo alloy has good performance owing to their excellent synergistic interaction in comparison with pure Pt (5d96s1) and Mo (4d54s1), while, the alloy composed with Pt and Cr (3d54s1) have undesirable performance for the strong adsorption of Cr leading to difficult desorption of H and affect its catalytic activity for HER.
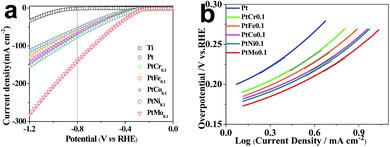 |
| | Fig. 3 (a) The polarization curves and (b) Tafel plots of different electrodes recorded in seawater and at a scan rate of 10 mV s−1. | |
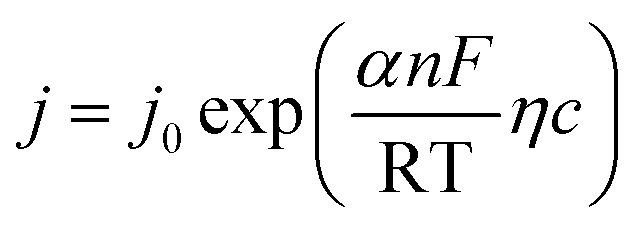
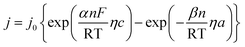
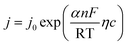
Polarization curves are always used to assess the electrodic reaction kinetic for HER. When using seawater as a target electrolyte, the concentration polarization can be ignored due to the high concentration of the reaction particles (H2O molecules), therefore the overpotential of hydrogen evolution is mainly controlled by electrochemical polarization. The basic kinetic equation of the relationship between current density and overpotential is described by Butler–Volmer equation:
| |
 | (a) |
Electrode potential deviates far from the equilibrium potential at a high overpotential, thus the electricity chemical equilibrium is damaged, the latter one for the formula can be ignored, so the eqn (a) can be simplified as:
| |
 | (b-1) |
or
| |
 | (b-2) |
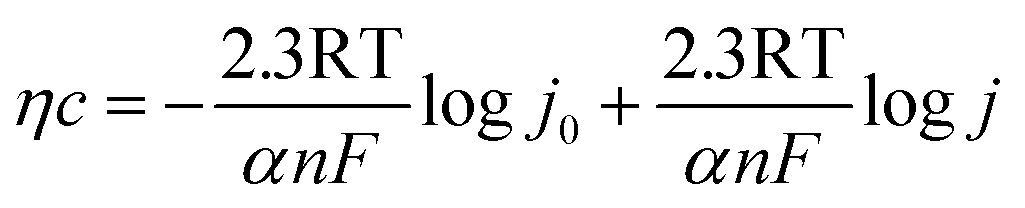
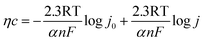
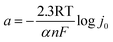
Therefore, semi-logarithmic relationship for current density and overpotential is named Tafel equation.
| | |
η = a + b × logj
| (c) |
| |
 | (d) |
| |
 | (e) |
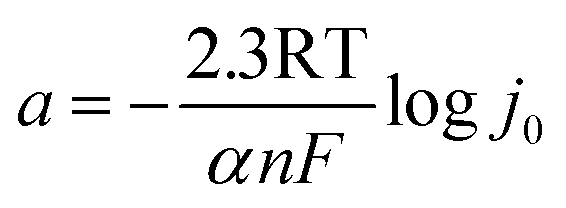
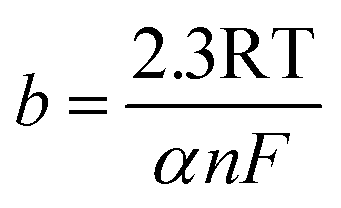
The kinetic parameters for revealing catalytic mechanism and rate determining step (RDS) of the HER (j0 and b) are derived from Tafel equation:35
where
η (V) is the applied overpotential,
j (mA cm
−2) refers to current density,
b (V dec
−1) is the representative of the Tafel slope and
a (V) means the intercept.
R is gas constant,
β is a symmetry factor,
n represents the number of electrons and
F is the Faraday constant (96
485 °C mol
−1). When
η = 0,
j0 = 10
(−a/b), which can directly reflect the depolarization ability and activity of HER. The electrochemical parameters are summarized in
Table 3.
Table 3 The electrochemical parameters derived from Tafel polarization characterization. j0 is exchange current density, EHER is onset potential, η10 is overpotential at j = 10 mA cm−2
| Catalysts |
EHER/mV vs. RHE |
j0/A cm−2 |
η10/mV vs. RHE |
| Pt |
−186.20 |
2.78 × 10⁻⁵ |
305.9 |
| PtCr0.1 |
−166.03 |
3.90 × 10⁻⁵ |
283.8 |
| PtFe0.1 |
−157.69 |
4.55 × 10⁻⁵ |
275.2 |
| PtCo0.1 |
−149.93 |
5.18 × 10⁻⁵ |
266.5 |
| PtNi0.1 |
−147.75 |
5.27 × 10⁻⁵ |
263.3 |
| PtMo0.1 |
−142.50 |
5.35 × 10⁻⁵ |
254.6 |
The potentiodynamic polarization method is applied to study the electrochemical behaviour of the electrodes. Fig. 3b shows the polarization curves of different catalytic electrodes and corresponding parameters are summarized in Table 3. The exchange current density (j0) is an important kinetic parameter that is correlated to electron transfer rate under reversible conditions. j0 influences the electrochemical reaction rate at other potentials. An ideal electrocatalytic electrode is expected to have a high j0 value. We introduce here a better parameter targeted current density η (η = b(logj/j0)) to indicate the catalytic processes toward HER. From Table 3, we can see that Ti/PtMo electrode has a j0 of 5.35 × 10⁻⁵ A cm−2 and η10 of only 254.6 mV, while they are 2.78 × 10⁻⁵ A cm−2 and 305.9 mV for Ti/Pt electrode, respectively. The larger j0 and lower η10 both suggest that Ti supported PtMo electrode has an increased catalytic activity for HER.36 The potential mechanisms behind enhanced performances are attributed two aspects: first, the synergistic interaction of d-metal according to Brewer's theory could be caused by the deposition of the d-metals from two branches of the Volcano curve.37 Second, the cathode surface area is increased by using PtMo alloy.
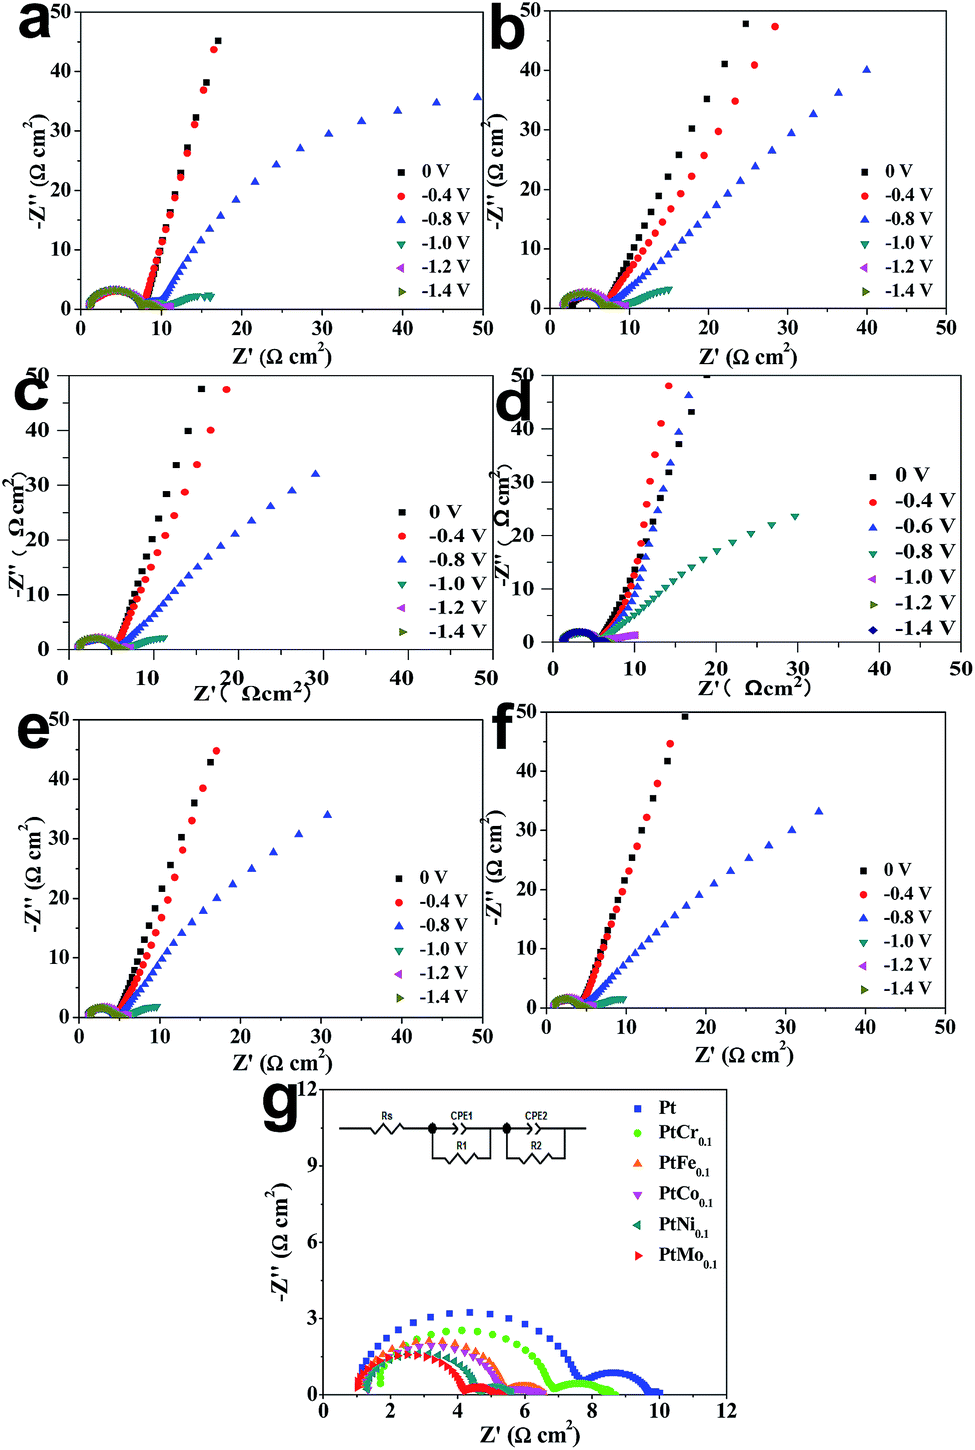
EIS characterization is used to investigate the electrode reaction processes at electrode/seawater interface. To illustrate the electron transfer kinetics toward HER, the Nyquist EIS spectra of same electrode at various overpotentials are recorded in seawater, as shown in Fig. 4. Two semicircles are determined in each Nyquist EIS spectra, suggesting there are two hydrogen evolution reaction steps during a HER process. By fitting Nyquist EIS plots with an equivalent circuit, the electrochemical parameters are extracted and summarized in Table 4. CPE1 and R1 are used to describe a capacitor and a resistor in the high-frequency region during hydrogen evolution reaction, while R2 and CPE2 are a capacitor and a resistor in low-frequency region, respectively.38 By stacking the Nyquist plots recorded at an overpotential of −1.4 V vs. Ag/AgCl, as shown in Fig. 4g. The semicircle in low-frequency is produced by Volmer and Heyrovsky reactions and always used to compare charge-transfer process. Another semicircle located in high-frequency region results from non-Faraday proliferation, which is considered as a diffusion process.39,40 Rct has a reduction evolution with increase of applied potential, indicating that the charge-transfer ability is enhanced at catalytic electrode/seawater interface. When applying a potential of −1.4 V vs. Ag/AgCl, the Ti/PtMo alloy electrode has the minimal Rct of 2.983 Ω cm2 in comparison with 3.022, 3.581, 3.972, 4.840 and 6.406 Ω cm2 for Ti/PtNi, Ti/PtCo, Ti/PtFe, Ti/PtCr and Ti/Pt, respectively. These findings cross-check that the Ti/PtMo electrode is robust in catalyzing HER by seawater splitting.
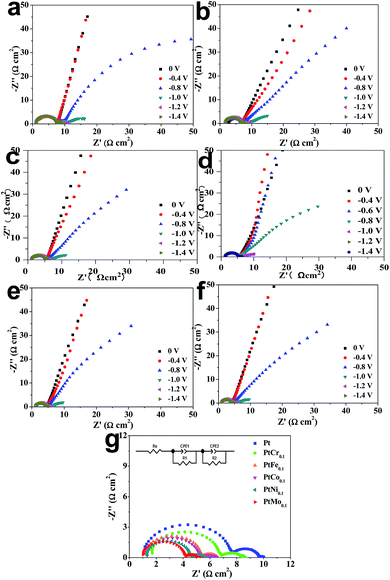 |
| | Fig. 4 Nyquist EIS plots recorded at different overvoltages for (a) Ti/Pt, (b) Ti/PtCr, (c) Ti/PtFe, (d) Ti/PtCo, (e) Ti/PtNi, and (f) Ti/PtMo electrodes. (g) Comparison of Nyquist EIS plots of various electrodes recorded at an overpotential of −1.4 V vs. Ag/AgCl. The inset shows an equivalent circuit. | |
Table 4 Comparison of EIS parameters extracted by fitting Nyquist EIS plots with an equivalent circuit
| Samples |
Rs (Ω cm2) |
R1 (Ω cm2) |
Rct (Ω cm2) |
| Pt |
1.078 |
6.406 |
2.250 |
| PtCr0.1 |
1.682 |
4.840 |
2.142 |
| PtFe0.1 |
1.200 |
3.972 |
1.798 |
| PtCo0.1 |
1.300 |
3.581 |
1.756 |
| PtNi0.1 |
1.343 |
3.022 |
1.532 |
| PtMo0.1 |
1.021 |
2.983 |
1.338 |
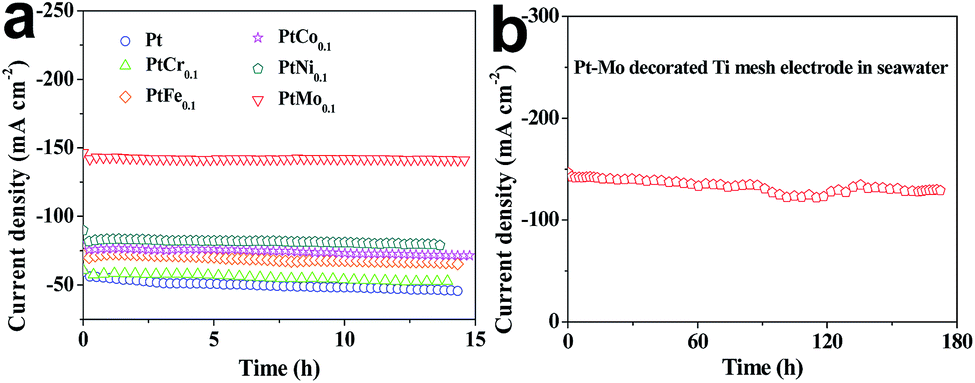
The long-term stabilities of Ti/Pt and Ti/PtM electrodes for HER are investigated by chronoamperometric curves recorded at a constant potential of −0.8 V vs. RHE for over 14 h in seawater. As shown in Fig. 5a, the corresponding current densities of all catalytic electrodes have slight reductions under persistent operation, suggesting a reduced catalytic activity toward HER.41 As shown in Table 5, the Ti/PtMo, Ti/PtNi, Ti/PtCo, Ti/PtFe and Ti/PtCr electrodes only have current density reductions of 0.58, 5.24, 6.13, 7.45 and 9.26% over 14 h comparing with 17.75% for Ti/Pt electrode, respectively. Notably, the current density of Ti/PtMo electrode is only reduced by 8.87% over 173 h, as shown in Fig. 5b.
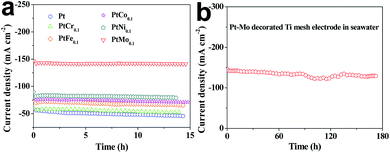 |
| | Fig. 5 The long-term stability of (a) Ti/Pt and Ti/PtM as well as (b) Ti/PtMo alloy electrode for HER recorded at −0.8 V vs. RHE in seawater. | |
Table 5 The deviations of current densities for different electrodes upon long-term operation over 14 h
| Samples |
Before (mA cm−2) |
After (mA cm−2) |
Retention (%) |
Decay rate (%) |
| Pt |
−55.451 |
−45.61 |
82.25 |
17.75 |
| PtCr0.1 |
−57.472 |
−52.148 |
90.74 |
9.26 |
| PtFe0.1 |
−70.615 |
−65.358 |
92.55 |
7.45 |
| PtCo0.1 |
−75.939 |
−71.289 |
93.87 |
6.13 |
| PtNi0.1 |
−82.544 |
−79.848 |
94.76 |
5.24 |
| PtMo0.1 |
−141.853 |
−141.179 |
99.52 |
0.58 |
The improved long-term stability along with high-efficiency hydrogen evolution demonstrates the Ti/PtMo alloy electrode to be promising in practical applications for hydrogen harvest from seawater splitting. Why Ti/PtMo electrode have markedly enhanced long-term stability? The abundant Cl− ions in seawater are generated into Cl2 at anode/seawater interface, subsequently the Cl2 molecules dissolved in seawater react with Pt and Mo species to form metal chlorides. The increased anticorrosion of Ti/PtMo electrode arises from competitive dissolution reactions of Mo with Cl2 in seawater.42 From Table 6, we find that all the metal species can react with Cl2 owing to their negative ΔrGm,25 °C values. Besides, the ΔrGm,25 °C values in the dissolution reactions of transition metals with Cl2 are more negative compared with that of Pt. Therefore, Pt and M in the electrodes can form competitive dissolution reactions which is beneficial to the increased anticorrosion of the alloy electrodes.43,44
Table 6 Thermodynamically corrosion reactions between Pt (or M) and Cl2 in seawater
| Reaction |
Dissolution |
ΔrGm,25 °C (kJ mol−1) |
| 1 |
Pt (s) + 2 Cl2 (g) = PtCl4 (s) |
−163.7 |
| 2 |
Cr (s) + 3/2 Cl2 (g) = CrCl3 (s) |
−486.3 |
| 3 |
Fe (s) + 3/2 Cl2 (g) = FeCl3 (s) |
−333.9 |
| 4 |
Co (s) + Cl2 (g) = CoCl2 (s) |
−269.7 |
| 5 |
Ni (s) + Cl2 (g) = NiCl2 (s) |
−259.1 |
| 6 |
Mo (s) + 3/2 Cl2 (g) = MoCl3 (s) |
−358.0 |
Conclusions
In summary, a class of robust catalytic electrodes from Ti mesh supported PtM (M = Cr, Fe, Co, Ni, Mo) electrodes have been successfully fabricated by incorporating secondary M into host Pt lattice for hydrogen evolution from seawater splitting. The results demonstrate that the catalytic electrodes are featured with reduced overpotentials and increased current densities, arising from the electron distribution and alloying effects. Moreover, the long-term stability of Ti/PtMo electrode yields a relatively high long-term stability under persistent operation over 173 h, making it promising in practical applications for seawater splitting. The current work can guide us to design highly efficient and cost-effective catalytic electrodes for hydrogen evolution from seawater splitting.
Conflicts of interest
There are no conflicts to declare.
Acknowledgements
The authors acknowledge financial supports from Key research and development Plan Project of Shandong Province (2015GGX104012), A Project of Shandong Province Higher Educational Science and Technology Program (J17KB001) and the National Natural Science Foundation of China (Grant No. 61704128).
Notes and references
- X. M Niu, Q. W. Tang, B. L. He and P. Z. Yang, Electrochim. Acta, 2016, 208, 180 CrossRef.
- X. Y. Liu, X. Wang, X. T. Yuan, W. J. Dong and F. Q. Huang, J. Mater. Chem. A, 2016, 4, 167 CAS.
- D. S. P. Cardoso, L. Amaral, D. M. F. Santos, B. Šljukić, C. A. C. Sequeira, D. Macciò and A. Saccone, Int. J. Hydrogen Energy, 2015, 40, 4295 CrossRef CAS.
- A. A. Ensafi, M. Jafari-Asl and B. Rezaei, Phys. Chem. Chem. Phys., 2015, 17, 23770 RSC.
- M. Zeng and Y. G. Li, J. Mater. Chem. A, 2015, 3, 14942 CAS.
- J. Lu, T. L. Xiong, W. J. Zhou, L. J. Yang, Z. H. Tang and S. W. Chen, ACS Appl. Mater. Interfaces, 2016, 8, 5065 CAS.
- T. T. Liu, X. P. Sun, A. M. Asiri and Y. Q. He, Int. J. Hydrogen Energy, 2016, 41, 7264 CrossRef CAS.
- K. Zeng and D. K. Zhang, Prog. Energy Combust. Sci., 2010, 36, 307 CrossRef CAS.
- G. H. Yang, Y. Z. Zhou, H. B. Pan, C. Z. Zhu, S. F. Fu, C. M. Wai, D. Du, J. J. Zhu and Y. H Lin, Ultrason. Sonochem., 2016, 28, 192 CrossRef CAS PubMed.
- C. Tang, Z. H. Pu, Q. Liu, A. M. Asiri and X. P. Sun, Electrochim. Acta, 2015, 153, 508 CrossRef CAS.
- D. Chade, L. Berlouis, D. Infield, A. Cruden, P. T. Nielsen and T. Mathiesen, Int. J. Hydrogen Energy, 2013, 38, 14380 CrossRef CAS.
- A. K. Cheong, A. Lasia and J. Lessard, J. Electrochem. Soc., 1994, 141, 975 CrossRef CAS.
- D. S. P. Cardoso, L. Amaral, D. M. F. Santos, B. Šljukić, C. A. C. Sequeira, D. Macciò and A. Saccone, Int. J. Hydrogen Energy, 2015, 40, 4295 CrossRef CAS.
- K. Ngamlerdpokin and N. Tantavichet, Int. J. Hydrogen Energy, 2014, 39, 2505 CrossRef CAS.
- F. Rosalbino, D. Macciò, A. Saccone, E. Angelini and S. Delfino, Int. J. Hydrogen Energy, 2011, 36, 1965 CrossRef CAS.
- L. Najdovski, P. R. Selvakannan and A. P. O'Mullane, RSC Adv., 2014, 4, 7207 RSC.
- L. Wang, C. Y. Lee and P. Schmuki, Electrochem. Commun., 2014, 44, 49 CrossRef CAS.
- J. Azevedo, L. Steier, P. Dias, M. Stefik, C. T. Sousa, J. P. Araújo, A. Mendes, M. Graetzel and S. D. Tilley, Energy Environ. Sci., 2014, 7, 4044 CAS.
- C. T. Li, S. R. Li, L. Y. Chang, C. P. Lee, P. Y. Chen, S. S. Sun, J. J. Lin, R. Vittal and K. C. Ho, J. Mater. Chem. A, 2015, 3, 4695 CAS.
- S. Tuomi, R. G. Lopez and T. Kallio, J. Catal., 2016, 334, 102 CrossRef CAS.
- S. Meyer, A. V. Nikiforov, I. M. Petrushina, K. Köhler, E. Christensen, J. O. Jensen and N. J. Bjerrum, Int. J. Hydrogen Energy, 2015, 40, 2905 CrossRef CAS.
- M. M. Jaksic, Electrochim. Acta, 1984, 29, 1539 CrossRef CAS.
- X. Q. Wang, R. Su, H. Aslan, J. Kibsgaard, S. Wendt, L. H. Meng, M. D. Dong, Y. D. Huang and F. Besenbacher, Nano Energy, 2015, 12, 9 CrossRef CAS.
- S. Harinipriya and M. V. Sangaranaravanan, Langmuir, 2002, 18, 5572 CrossRef CAS.
- Q. Han, S. Cui, N. W. Pu, J. S. Chen, K. R. Liu and X. J. Wei, Int. J. Hydrogen Energy, 2010, 35, 5194 CrossRef CAS.
- Q. W Tang, H. H. Zhang, Y. Y Meng, B. L. He and L. M. Yu, Angew. Chem., Int. Ed., 2015, 127, 11610 CrossRef.
- G. Darabdhara, M. A. Amin, G. A. M. Mersal, E. M. Ahmed, M. R. Das, M. B. Zakaria, V. Malgras, S. M. Alshehri and Y. Yamauchi, J. Mater. Chem. A, 2015, 3, 20254 CAS.
- D. Golodnitskt, R. Yuand and A. Ulus, Electrochim. Acta, 2002, 47, 2707 CrossRef.
- Y. S. Du, J. Su, W. Luo and G. Z. Cheng, ACS Appl. Mater. Interfaces, 2015, 7, 1031 CAS.
- J. Benson, M. X. Li, S. B. Wang, P. Wang and P. Papakonstantinou, ACS Appl. Mater. Interfaces, 2015, 7, 14113 CAS.
- B. Subramanya, Y. Ullal, S. U. Shenoy, D. K. Bhat and A. C. Hegde, RSC Adv., 2015, 5, 47398 RSC.
- Y. G. Zhang, P. J. Li, X. G. Yang, W. J. Fa and S. X. Ge, J. Alloys Compd., 2018, 732, 248 CrossRef CAS.
- X. M. Niu, Q. W. Tang, B. L. He and P. Z. Yang, Electrochim. Acta, 2016, 208, 180 CrossRef CAS.
- B. E. Conway and G. Jerkiewicz, Solid State Ionics, 2002, 150, 93 CrossRef CAS.
- E. N. Flores, Z. W. Chong and S. Omanovic, J. Mol. Catal. A: Chem., 2005, 226, 179 CrossRef.
- Y. Pan, Y. Q. Liu, Y. Lin and C. G. Liu, ACS Appl. Mater. Interfaces, 2016, 8, 13890 CAS.
- B. E. Conway and G. Jerkiewicz, Electrochim. Acta, 2000, 45, 4075 CrossRef CAS.
- L. L. Chen and A. Lasia, J. Electrochem. Soc., 1992, 139, 3214 CrossRef CAS.
- A. Lasia and A. Rami, J. Electroanal. Chem. Interfacial Electrochem., 1990, 294, 123 CrossRef CAS.
- W. F. Deng, H. M. Jiang, C. Chen, L. Yang, Y. M. Zhang, S. Q. Peng, S. Q. Wang, Y. M. Tan, M. Ma and Q. X. Xie, ACS Appl. Mater. Interfaces, 2016, 8, 13341 CAS.
- D. M. Hou, W. J. Zhou, X. J. Liu, K. Zhou, J. Xie, G. Q. Li and S. W. Chen, Electrochim. Acta, 2015, 166, 26 CrossRef CAS.
- H. Y. Li, Q. W. Tang, B. L. He and P. Z. Yang, J. Mater. Chem. A, 2016, 4, 6513 CAS.
- J. Wang, Q. W. Tang, B. L. He and P. Z. Yang, J. Power Sources, 2016, 328, 185 CrossRef CAS.
- Q. W. Tang, J. Liu, H. H. Zhang, B. L. He and L. M. Yu, J. Power Sources, 2015, 297, 1 CrossRef CAS.
Footnote |
| † The authors have equal contributions. |
|
| This journal is © The Royal Society of Chemistry 2018 |
Click here to see how this site uses Cookies. View our privacy policy here. 
 Open Access Article
 This Open Access Article is licensed under a Creative Commons Attribution-Non Commercial 3.0 Unported Licence
 *ab,
Yuanyuan Zhao†
*ab,
Yuanyuan Zhao†