 Open Access Article
Creative Commons Attribution 3.0 Unported Licence
Magnetocaloric study, critical behavior and spontaneous magnetization estimation in La0.6Ca0.3Sr0.1MnO3 perovskite
M. Jeddi *a,
H. Gharsallahab,
M. Bejara,
M. Bekric,
E. Dhahri
 a and
E. K. Hlild
aLaboratoire de Physique Appliquée, Faculté des Sciences, Université de Sfax, B. P. 1171, 3000 Sfax, Tunisia. E-mail: marwajeddi@gmail.com
bInstitut Préparatoire aux Études d'Ingénieur de Sfax, Université de Sfax, B. P. 1172, 3018 Sfax, Tunisia
cPhysics Department, Rabigh College of Science and Art, King Abdulaziz University, P.O. Box 344, Rabigh 21911, Saudi Arabia
dInstitut Néel, CNRS Université J. Fourier, B. P. 166, 38042 Grenoble, France
First published on 6th March 2018
Abstract
A detailed study of structural, magnetic and magnetocaloric properties of the polycrystalline manganite La0.6Ca0.3Sr0.1MnO3 is presented. The Rietveld refinement of X-ray diffraction pattern reveals that our sample is indexed in the orthorhombic structure with Pbnm space group. Magnetic measurements display a second order paramagnetic (PM)/ferromagnetic (FM) phase transition at Curie temperature Tc = 304 K. The magnetic entropy change (ΔSM) is calculated using two different methods: Maxwell relations and Landau theory. An acceptable agreement between both data is noted, indicating the importance of magnetoelastic coupling and electron interaction in magnetocaloric effect (MCE) properties of La0.6Ca0.3Sr0.1MnO3. The maximum magnetic entropy change (−ΔSmaxM) and the relative cooling power (RCP) are found to be respectively 5.26 J kg−1 K−1 and 262.53 J kg−1 for μ0H = 5 T, making of this material a promising candidate for magnetic refrigeration application. The magnetic entropy curves are found to follow the universal law, confirming the existence of a second order PM/FM phase transition at Tc which is in excellent agreement with that already deduced from Banerjee criterion. The critical exponents are extracted from the field dependence of the magnetic entropy change. Their values are close to the 3D-Ising class. Scaling laws are obeyed, implying their reliability. The spontaneous magnetization values determined using the magnetic entropy change (ΔSM vs. M2) are in good agreement with those obtained from the classical extrapolation of Arrott curves (μ0H/M vs. M2). The magnetic entropy change can be effectively used in studying the critical behavior and the spontaneous magnetization in manganites system.
1. Introduction
In the last few decades, the study of the Magnetocaloric Effect (MCE) has attracted the attention and whetted the interest of scientific and engineering communities, not only for its potential applications near room temperature but also for other energy conversion matters1 as well as certain environmental protection issues. The MCE can be defined as an intrinsic property of magnetic materials. It is characterized by the temperature change (ΔTad) in an adiabatic process and by the entropy change (ΔSiso) in an isothermal process originating uniquely from the application and removal of an external magnetic field in the presence of such ferromagnetic materials as gadolinium which was firstly proposed by G. V. Brown in 1976.2The building of a magnetic refrigeration device near room temperature based on the MCE provides tremendous economic, ecological and energetic benefits compared to the rest of existing refrigeration machines which are based on conventional gas compression/expansion technique.3–5 Indeed, since the driving force of magnetic refrigerators arises from the variation of the applied magnetic field, the number of energy consuming elements involved in the refrigeration process is drastically reduced resulting in an enhancement of the cooling efficiency. Moreover, these devices are very environmentally friendly. They do not use any toxic gaseous substances which are normally responsible for damaging our living environment.6 It is worthy highlighting that Brown's idea has opened the door to a completely innovative technology which is now under development with a notably huge amount of working prototypes.7 The research on magnetocaloric materials presenting optimal magnetocaloric properties8–10 was obviously taken further towards the end of the 90's when giant MCE was discovered in Gd5Si2Ge2.11 Immediately, hundreds of other materials with extraordinary MCE were found12–15 and still today dozens of new materials with giant MCE are described every year. Consequently, several magnetic materials which belong to various chemical families have been fully characterized16 with deeper investigation on the most intimate details of the structural and magnetic properties. Recently, large values of MCE have been observed in the perovskite based-manganite of (R1 − xMx)MnO3 formula (where R is a trivalent rare earth ion and M is a divalent alkali earth ion).17,18 With small thermal and magnetic hysteresis, large magnetic entropy change, and relatively low cost,19 perovskite manganese oxides have been the subject of continuous research for many years as advantageous materials for refrigeration. This interest arises not only from its dynamic ability for uses in device applications20–22 but also from its impressive physical properties.23–27 There are numerous sound arguments confirming the fact that perovskite based-manganite compounds will perform a crucial role in the incoming technologies of the near future.28
Owing to the large amount of known magnetocaloric materials, it was necessary to develop strategies which enable us to compare them accurately, apart from their nature, processing or composition. Nowadays, significant advances have been carried out allowing a deeper insight to better explore the matter. Phenomenological theories are the key tools which allow us to interpret the performing properties of different magnetocaloric materials. The Landau theory was used to evaluate the importance of magnetoelastic coupling and electron interaction in the magnetocaloric effect.29,30 The Mean-field theory was created to establish direct relations between magnetic entropy change and magnetization.31–33 The theory of critical phenomena was exploited to justify the existence of a universal magnetocaloric behavior in second-order magnetic phase transition materials.34,35
In the present work, a detailed investigation was conducted on magnetocaloric properties of La0.6Ca0.3Sr0.1MnO3 compound and its potential application in the cooling fields. Landau mean-field analysis was performed to estimate the magnetic entropy change (ΔSM) near the Curie temperature. Results are then compared to those obtained using the classical Maxwell relation. A phenomenological universal curve was used as a simple method for extrapolating the magnetic entropy change to confirm the order of the magnetic transition. From the field dependence of isothermal entropy change data, critical exponents were calculated and then verified by the scaling law. From the magnetic entropy change (ΔSM vs. M2), spontaneous magnetization (Mspont) was estimated and then compared to that estimated from the classical extrapolation of the Arrott curves (μ0H/M vs. M2).
2. Experiment
2.1. Synthesis
The polycrystalline sample of La0.6Ca0.3Sr0.1MnO3 was obtained by the mixture of two citric-gel manganite-based oxides; La0.6Ca0.4MnO3 and La0.6Sr0.4MnO3, with mole fractions of 0.75 and 0.25, respectively. Then, the mixed powder 0.75La0.6Ca0.4MnO3/0.25La0.6Sr0.4MnO3 was sintered at 1300 °C to obtain the desired manganite.The La0.6Ca0.4MnO3 and La0.6Sr0.4MnO3 samples were prepared by citric-gel method36,37 using nitrate reagents: La(NO3)·6H2O, Ca(NO3)2·4H2O, Mn(NO3)2·6H2O and Sr(NO3)2. The precursors were dissolved in distilled water. Citric acid and ethylene glycol were added to prepare a transparent stable solution. The solution was heated at 80 °C in order to eliminate water excess and to obtain a viscous glassy gel. The solution on further heating at 120 °C led to the emergence of dark grayish flakes which were calcined at 700 °C for 12 h. Then, the powder was pressed into pellets and finally sintered at 900 °C for 18 h.
2.2. Characterization
The structure and phase purity of La0.6Ca0.3Sr0.1MnO3 were examined by powder X-ray diffraction technique with CuKα radiation (λ = 1.5406 Å), at room temperature, by a step scanning of 0.015° in the range of 20° ≤ 2θ ≤ 80°. The morphology of the surface was observed by the scanning electron microscopy (SEM). This technique was employed also to prepare a histogram of particle size. The elemental composition of the prepared specimen was checked by the energy dispersive X-ray analysis (EDAX). The magnetization curve versus temperature was obtained under an applied magnetic field of 0.05 T with a temperature ranging from 5 to 400 K. Isothermal magnetization data as a function of magnetic field was performed with dc magnetic fields from 0 to 5 T.3. Results and discussion
3.1. Structural study
Fig. 1a illustrates the X-ray diffraction (XRD) pattern of La0.6Ca0.3Sr0.1MnO3 sample. Rietveld refinement is performed by using Fullprof program.38 The fitting between the observed and the calculated diffraction profiles shows an excellent agreement, taking into consideration the low value of the fit indicator (χ2 = 1.897). We notice that the sample is of a single phase without any trace of foreign impurity confirming the high purity of the product material. All the diffraction peaks are indexed in the orthorhombic structure with Pbnm space group. The crystal structure of La0.6Ca0.3Sr0.1MnO3 is schematically depicted in Fig. 1b. The refinement results are gathered in Table 1.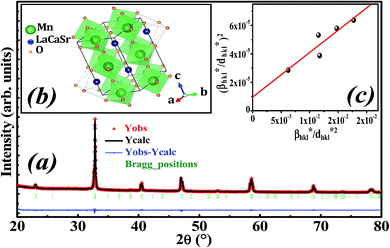 | ||
| Fig. 1 (a) Rietveld refinement, (b) crystal structure and (c) Halder–Wagner plot of La0.6Ca0.3Sr0.1MnO3 compound. | ||
| Compound | La0.6Ca0.3Sr0.1MnO3 |
| Space group | Pbnm, a ≠ b ≠ c, α = β = γ = 90° |
| Cell parameters | |
| a (Å) | 5.48045 (18) |
| b (Å) | 5.45131 (18) |
| c (Å) | 7.69547 (2) |
| V/FU (Å3) | 57.477 |
![[thin space (1/6-em)]](https://www.rsc.org/images/entities/char_2009.gif) |
|
| Atoms | |
| La, Ca, Sr site (x, y, z) | 0.9968 (11) |
| 0.0117 (8) | |
| 0.25000 | |
| Mn site (x, y, z) | 0.50000 |
| 0.00000 | |
| 0.00000 | |
| O1 site (x, y, z) | 0.0562 (4) |
| 0.4917 (6) | |
| 0.25000 | |
| O2 site (x, y, z) | 0.7174 (3) |
| 0.2763 (5) | |
| 0.0342 (18) | |
![[thin space (1/6-em)]](https://www.rsc.org/images/entities/char_2009.gif) |
|
| Bond angles and bond lengths | |
| 〈θMn–O–Mn〉 (°) | 160.595 |
| 〈dMn–O〉(Å) | 1.959 |
![[thin space (1/6-em)]](https://www.rsc.org/images/entities/char_2009.gif) |
|
| Agreement factors | |
| RF (%) | 3.05 |
| RB (%) | 2.08 |
| Rp (%) | 14.6 |
| Rwp (%) | 10.5 |
| Rexp (%) | 9.05 |
| χ2 (%) | 1.897 |
Goldschmidt's tolerance factor tG as a criterion for the formation of a perovskite structure is calculated using the following expression:39
 | (1) |
Oxide-based manganite compounds have a perovskite structure if their tolerance factor is between 0.78 and 1.05.40 In the present study, the obtained tolerance factor of La0.6Ca0.3Sr0.1MnO3 is 0.925 which is within the stable range of the perovskite structure.
The average crystallite size is obtained from the XRD peaks using the Debye–Scherrer formula:41
 | (2) |
The mean value of the crystallite size of La0.6Ca0.3Sr0.1MnO3 corresponds to 30 nm which confirms the nanometric size of our compound.
The Halder–Wagner (H–W) method is another method to determine the crystallite size. It is expressed as follows:42
 | (3) |

 and ε is a coefficient related to strain effect on the crystallites.
The plot of (β*/d*)2 (axis-y) as a function of (β*/d*2) (axis-x) corresponding to the 5 strongest peaks of La0.6Ca0.3Sr0.1MnO3 is shown in Fig. 1c. The crystallite size DHW is achieved from the slope inverse of the linearly fitted data and the root of the y-intercept gives the microstrain ε. The values of DHW and ε are found to be respectively 31.9 nm and 0.0062. It is worth noting that the crystallite size calculated by H–W method is slightly higher than that calculated by Debye–Scherrer method because the broadening effect due to the microstrain is completely excluded in Debye–Scherrer technique.43
Fig. 2a shows the SEM micrograph of our synthesized sample. The particles are largely agglomerated with a broad size distribution. The size distribution of particles presented in the inset of Fig. 2a is analyzed quantitatively by fitting the histogram using a Lorentzian function. The mean diameter of La0.6Ca0.3Sr0.1MnO3 is mostly 59 nm. The particle size obtained by SEM image is larger than that calculated by XRD data which indicates that each particle observed by SEM is formed by several crystallized grains.
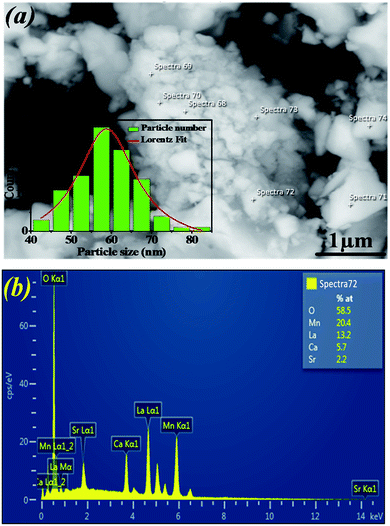 | ||
| Fig. 2 (a) SEM image of La0.6Ca0.3Sr0.1MnO3 compound. The inset shows the size distribution histogram. (b) EDAX analysis spectrum. | ||
Fig. 2b exemplifies the EDAX spectrum of La0.6Ca0.3Sr0.1MnO3 compound. The analysis was carried out on different zones. One can see that there are no impurities. All the elements integrated during the preparation (La, Ca, Sr, Mn and O) are present. The sample composition is similar to the desired one.
3.2. Magnetic measurements
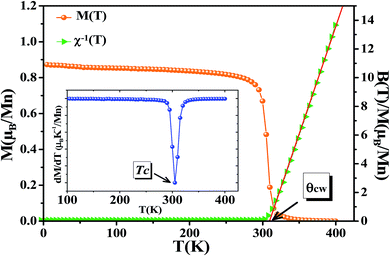
The temperature dependence of magnetization curve is carried out under an applied magnetic field of 0.05 T (Fig. 3). With decreasing temperature, La0.6Ca0.3Sr0.1MnO3 exhibits a single magnetic transition from PM to FM phase at Curie temperature (Tc = 304 K) defined as the temperature at which dM/dT shows a minimum (inset Fig. 3). Curie temperature near room temperature has a great importance in terms of the cooling technology.44In order to better understand the magnetic behavior of our sample in the PM region above Tc, we studied the inverse magnetic susceptibility as a function of temperature χ−1(T). Fig. 3 shows that χ−1(T) follows the Curie–Weiss law defined as:45
 | (4) |
It is known that the fitting of χ−1(T) curve using Curie–Weiss law provides a valuable information about the magnetic character of material.46–49 In our case, by fitting the high temperature region of χ−1(T), the Curie–Weiss temperature θcw proves to be equal to 310 K. The obtained value of θcw is positive, validating the FM character of our sample. Generally, θcw is slightly higher than Tc which refers basically to the presence of a magnetic inhomogeneity.50
The experimental effective paramagnetic moment μexpeff can be estimated from the Curie constant by the relation:51
 | (5) |
In this paper, the magnetization is expressed in μB/Mn. The Curie constant is thus reduced to:
 | (6) |
The calculated effective paramagnetic moment μcaleff is calculated as follows:52
 | (7) |
The obtained values of μexpeff and μcaleff are found to be equal to 5.57μB and 4.51μB, respectively. The difference between the experimental effective paramagnetic moment and the calculated one can be explained by the existence of FM clusters within the PM phase.54
The isothermal magnetizations versus applied magnetic field M(μ0H,T) measured at various temperatures with a maximum magnetic field of 5 T are depicted in Fig. 4a. Below Tc, M(μ0H,T) data increases sharply at low fields and then shows a tendency to saturation as field value increases which is typical for FM materials. Above Tc, a dramatic decrease of M(μ0H,T) is observed with an almost linear behavior as a feature of PM materials.
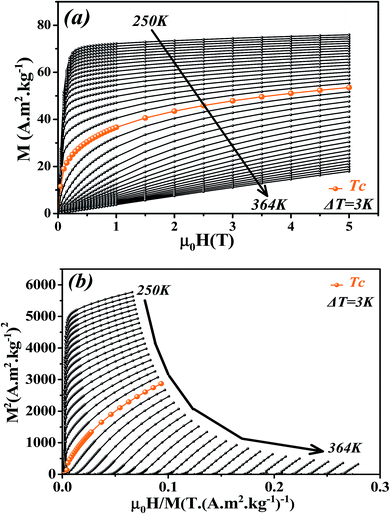 | ||
| Fig. 4 (a) Isothermal magnetization curves measured at different temperatures around Tc for La0.6Ca0.3Sr0.1MnO3 compound. (b) Arrott plots (M2 vs. μ0H/M). | ||
Fig. 4b presents the Arrott plots of (M2 vs. μ0H/M) which are derived from the isothermal magnetizations. According to the criterion proposed by Banerjee,55 the order of the magnetic phase transition can be checked through the sign of the slope of Arrott curves (M2 vs. μ0H/M). The positive slope observed for all studied temperatures indicates that the magnetic transition between the FM and PM phase is of the second order.
3.3. Magnetocaloric properties
In order to enquire about the efficiency of our compound in the magnetic refrigeration systems, the magnetic entropy change (ΔSM) can be determined indirectly from the isothermal magnetization curves using the approximated Maxwell equation:56
 | (8) |
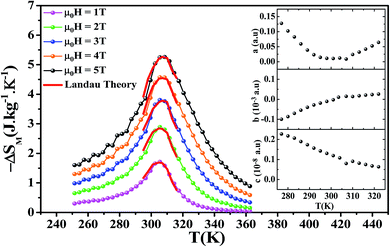
Fig. 5 shows the temperature dependence of the magnetic entropy change (−ΔSM(T)) under several external magnetic fields for La0.6Ca0.3Sr0.1MnO3 sample. The magnitude of ΔSM increases with the increase of the applied magnetic field and reaches its maximum around the Curie temperature Tc. The maximum values of the magnetic entropy (−ΔSmaxM) are 2.89 and 5.26 J kg−1 K−1 under an applied magnetic field of 2 and 5 T, respectively. These values correspond to about 53 and 52% of those observed in pure Gd at 2 and 5 T, respectively.5,57,58
Depending on the magnitude of (−ΔSM) and its full-width at half maximum (δTFWHM), the magnetocaloric efficiency can be determined through the relative cooling power (RCP).59 The latter, defined as the heat transfer between the hot and the cold sinks in one ideal refrigeration cycle, can be described by the following formula:
| RCP = (−ΔSmaxM) × δTFWHM | (9) |
The calculated RCP is 98.17 J kg−1 for μ0H = 2 T and 262.53 J kg−1 for μ0H = 5 T, which stands for about 60 and 64% of that observed in pure Gd, respectively. (−ΔSmaxM) and RCP constitute a good initial approximation to the potential performance of a material used as a magnetic refrigerator. To evaluate the applicability of our compound as magnetic refrigerant, the obtained values of (−ΔSmaxM) and RCP in our study, compared to other magnetic materials,5,58,60–66 are summarized in Table 2.
| Compound | μ0H (T) | Tc (K) | (−ΔSmaxM), (J kg−1 K−1) | RCP (J kg−1) | Ref. |
|---|---|---|---|---|---|
| La0.6Ca0.3Sr0.1MnO3 | 5 | 304 | 5.26 | 262.53 | Present work |
| 2 | 2.89 | 98.17 | |||
| Gd | 5 | 294 | 10.2 | 410 | 5 |
| 2 | 5.5 | 164 | 58 | ||
| La0.8K0.2MnO3 | 5 | 281 | 3.71 | 160 | 60 |
| La0.67Ba0.33MnO3 | 5 | 292 | 1.48 | 161 | 61 |
| La0.7(Ba, Sr)0.3MnO3 | 2 | 316 | 1.27 | 75.74 | 62 |
| La0.8Na0.2MnO3 | 2 | 335 | 2.83 | 76.91 | 63 |
| La0.75Sr0.25Mn0.8Cr0.2O3 | 5 | 278 | 3.85 | 323 | 64 |
| La0.75Sr0.25Mn0.95Ti0.05O3 | 2 | 308 | 2.2 | 90 | 65 |
| La0.7Sr0.3Mn0.95Co0.05O3 | 1.5 | 300 | 1.17 | 46.8 | 66 |
For the theoretical modeling of the MCE, Amaral et al.29 attempted to explore in depth the MCE in terms of Landau theory of phase transition which takes into account the electron interaction and magnetoelastic coupling effects.
According to Landau theory, Gibb's free energy is expressed as:67
 | (10) |
Using the equilibrium condition at Tc (∂G/∂M = 0), the obtained relation between the magnetization of the material and the applied field is expressed as follows:
 | (11) |
Landau's parameters a(T), b(T) and c(T) determined from a polynomial fit of the experimental isothermal magnetizations are shown in the inset of Fig. 5.
The magnetic entropy change is theoretically obtained from the differentiation of the free energy with respect to temperature as follows:69
 | (12) |
Fig. 5 shows the magnetic entropy behavior of our sample, obtained by comparing the results coming from the Maxwell relation integration of the experimental data and the one calculated by using the Landau theory. An excellent concordance is found between the experimental magnetic entropy change and the theoretical one in the vicinity of the magnetic phase transition. The result indicates that both magnetoelastic coupling and electron interaction can account for the MCE properties of this sample.70
From physical point of view, the efficiency of magnetic refrigerant materials can be assessed by the nature of the phase transition that they undergo.71 The phase transition can be of the first order in which the first derivative of the Gibb's free energy is discontinuous. Therefore, magnetization shows an abrupt change at the transition temperature. Although this change causes a correspondingly giant magnetic entropy change, this appears at the cost of thermal and magnetic hysteresis, which should be avoided in refrigerators appliances. However, if the magnetic phase transition is of the second order, no thermal and magnetic hysteresis are observed which is much more suitable for refrigerators applications.
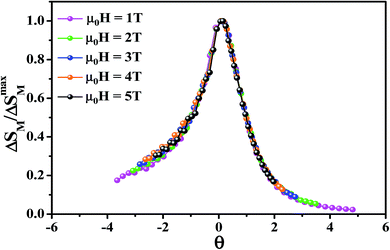
To further investigate the nature of the phase transition in samples, Bonilla et al.72 have suggested a phenomenological universal curve. The construction of the phenomenological universal curve is based on the collapse of all ΔSM(T,μ0H) data measured at different μ0H into one single new curve. This procedure was performed by normalizing the magnetic entropy change curves ΔSM with respect to their peak ΔSmaxM (ΔSM/ΔSmaxM) and rescaling the temperature axis using two additional reference temperatures in a different way below and above Tc. The positions of these additional reference temperatures in the curve correspond to θ = ±1:
 | (13) |
Departing from Fig. 6, it is obvious that all normalized entropy change curves collapse into a single curve confirming that the PM/FM transition observed in our sample is of the second order, which is in good agreement with the analysis of the Banerjee criterion.
3.4. Critical behavior determination through magnetic entropy change
Generally, the common methods to identify the critical behavior of materials undergoing second order phase transition are the modified Arrott plots73 and the Kouvel–Fisher method.74 The choice of model to first construct some tentative Arrott plots and determine initial values of the critical exponents affects systematically their final values. Since several researchers make different choices, a considerable uncertainty is unavoidable. To eliminate the drawbacks arising from the conventional method,75 another method based on the field dependence of magnetic entropy change can be used to show the intrinsic relation between MCE and the universality class. According to the approach suggested by Oesterreicher and Paker,76 the field dependence of the magnetic entropy change of second order phase transition magnetic materials can be approximated by a universal law of the field:| ΔSM ∝ (μ0H)n | (14) |
The exponent n which is dependent on μ0H and T, can be calculated as follows:
 | (15) |
At T = Tc, the exponent n becomes an independent field:77
 | (16) |
Using βδ = β + γ78 the relation (16) can be rewritten as:
 | (17) |
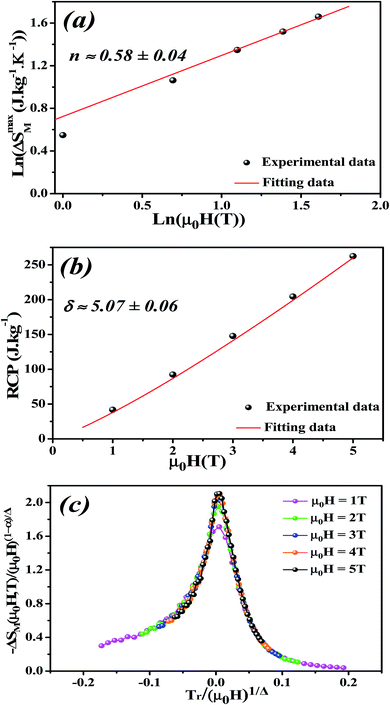
By fitting ΔSM vs. μ0H data on the ln–ln scale (Fig. 7a), the value of n obtained from the slope around Tc is 0.58 ± 0.04. On the basis of the mean-field approach, the field dependence of the magnetic entropy change at the Curie temperature corresponds to n = 2/3.79,80 The deviation of n value from the mean-field behavior refers basically to the presence of magnetic inhomogeneities in the vicinity of transition temperature.81
The field dependence of RCP for our sample can be expressed as a power law:64
 | (18) |
The value of δ obtained from the fitting of RCP vs. μ0H plot is 5.07 ± 0.06 (Fig. 7b). By combining the value of n and δ according to eqn (16) and (17), the obtained values of the critical exponents β and γ are 0.319 ± 0.026 and 1.302 ± 0.010, respectively. It is noticed that the values of the critical exponents calculated using the magnetic entropy change match reasonably well within the 3D-Ising model (β = 0.325, γ = 1.241, δ = 4.82).
To check the reliability of the obtained critical exponents, Franco et al.71 used the scaled equation of state which is expressed as:
 | (19) |
 is the reduced temperature.
According to eqn (19) and using the appropriate values for the critical exponents, the plot of  is depicted in Fig. 7c. All the experimental data clearly collapses on a single master curve for all measured fields and temperatures indicating that the obtained values of the critical exponents for this specimen are in excellent accordance with the scaling hypothesis, which further reinforces their reliability. This result confirms that the critical behavior is well correlated with the MCE properties.
3.5. Spontaneous magnetization determination through magnetic entropy change
In the following section, the mean-field theory is invested so as to investigate the spontaneous magnetization (Mspont) in our sample. A general result issued from a mean-field theory reveals that the magnetic entropy as a function of magnetization can be described as:16,83,84
 | (20) |
For small M values, a proportionality of magnetic entropy to σ2 can be defined as:
 | (21) |
In the FM state, the system presents a spontaneous magnetization, therefore σ ≠ 0. Consequently, considering only the first term of eqn (21), the magnetic entropy may be written as:
 | (22) |
Taking the square of the reduced magnetization and substituting it for σ2 in eqn (22) results in:
 | (23) |
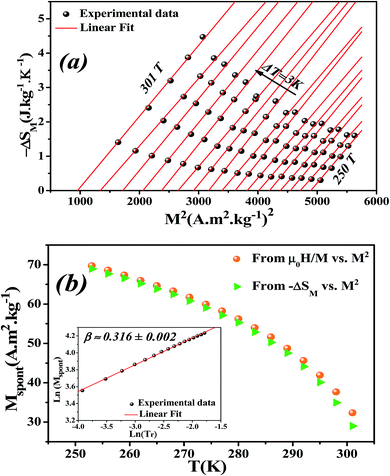
Eqn (23) implies that in the FM region, the isothermals (−ΔSM) vs. M2 exhibit a linear variation. By fitting the (−ΔSM) vs. M2 curves for T < Tc, the value of Mspont can be estimated through the intersection of the straight lines with the M2 axis (Fig. 8a). For T > Tc, the (−ΔSM) vs. M2 plots start at a null M value.
The spontaneous magnetization Mspont as a function of temperature is plotted in Fig. 8b. As the temperature decreases, the spontaneous magnetization increases, suggesting that the system is approaching a spin ordering state at lower temperature. The values of Mspont, estimated from the analysis of the magnetization dependence of magnetic entropy change (ΔSM vs. M2), are compared with those deduced from the classical extrapolation of the Arrott curves (μ0H/M vs. M2), as shown in Fig. 8b. The excellent agreement between both methods confirms the validity of the method based on the magnetic entropy change to determine the spontaneous magnetization of the La0.6Ca0.3Sr0.1MnO3 system as well as that of other compounds.
It is known that the spontaneous magnetization near Curie temperature of a second order phase transition material corresponds to a critical exponent β, through the relation:85
| Mspont ∝ (Tr)β | (24) |
 is the reduced temperature.
By changing eqn (24) to ln–ln scale, the value of β corresponds to the slope of the curve. From the linear fitting shown in the inset of Fig. 8b, we have obtained β = 0.316 ± 0.002, which is consistent with the 3D-Ising model (β = 0.325), as mentioned in the previous section.
4. Conclusion
In summary, a detailed study of magnetocaloric properties of La0.6Ca0.3Sr0.1MnO3 compound has been systematically performed. Through thermodynamic Maxwell relations, the magnetic entropy change (ΔSM) has been determined. Our compound presents large magnetocaloric effect (MCE) values around room temperature. It exhibits a relative cooling power (RCP) corresponding to about 64% of that observed in pure Gd for μ0H = 5 T, indicating its potential application in the cooling fields. The analysis of (ΔSM) using Landau theory is consistent with that estimated by Maxwell relations, concluding the importance of magnetoelastic coupling and electron interaction in the MCE properties of manganites system. Banerjee criterion and a phenomenological universal curve of the magnetic entropy change have successfully confirmed the second order of the magnetic phase transition. The field dependence of the magnetic entropy change was applied to study the critical behavior. Our results go in tandem with the values corresponding to the 3D-Ising model. The obtained critical exponents follow the scaling laws which further confirm their reliability. The field dependence of magnetic entropy change can be effectively used in studying the critical behavior of magnetic materials. The methodology based on the analysis of the magnetic entropy change (ΔSM vs. M2) compared to the classical extrapolation of the Arrott curves (μ0H/M vs. M2) proves that magnetic entropy change is a valid approach to determine the spontaneous magnetization in La0.6Ca0.3Sr0.1MnO3 system.Conflicts of interest
There are no conflicts to declare.References
- A. Kitanovski, J. Tušek, U. Tomc, U. Plaznik, M. Ozbolt and A. Poredoš, Magnetocaloric Energy Conversion: From Theory to Applications, Springer, 2014 Search PubMed.
- G. V. Brown, J. Appl. Phys., 1976, 47, 3673 CrossRef CAS.
- S. Y. Dan'Kov, Phys. Rev. B, 1998, 57, 3478 CrossRef.
- F. Casanova, X. Batlle and A. Labarta, Phys. Rev. B: Condens. Matter Mater. Phys., 2002, 66, 212402 CrossRef.
- K. A. Gschneidner Jr, V. K. Pecharsky and A. O. Tsokol, Rep. Prog. Phys., 2005, 68, 1479 CrossRef.
- C. Romero-Muñiz, V. Franco and A. Conde, Phys. Chem. Chem. Phys., 2017, 19, 3582 RSC.
- B. Yu, M. Liu, P. W. Egolf and A. Kitanovski, Int. J. Refrig., 2010, 33, 1029 CrossRef CAS.
- Y. Yi, L. Li, K. Su, Y. Qi and D. Huo, Intermetallics, 2017, 80, 22 CrossRef CAS.
- Y. Yang, Y. Zhang, X. Xu, S. Geng, L. Hou, X. Li, Z. Ren and G. Wilde, J. Alloys Compd., 2017, 692, 665 CrossRef CAS.
- Y. Zhang, L. Hou, Z. Ren, X. Li and G. Wilde, J. Alloys Compd., 2016, 656, 635 CrossRef CAS.
- V. K. Pecharsky and K. A. Gschneidner Jr, Phys. Rev. Lett., 1997, 78, 4494 CrossRef CAS.
- H. Wada and Y. Tanabe, Appl. Phys. Lett., 2001, 79, 3302 CrossRef CAS.
- F. X. Hu, B. G. Shen, J. R. Sun, Z. H. Cheng, G. H. Rao and X.-X. Zhang, Appl. Phys. Lett., 2001, 78, 3675 CrossRef CAS.
- S. Fujieda, A. Fujita and K. Fukamichi, Appl. Phys. Lett., 2002, 81, 1276 CrossRef CAS.
- J. Liu, T. Gottschall, K. P. Skokov, J. D. Moore and O. Gutfleisch, Nat. Mater., 2012, 11, 620 CrossRef CAS PubMed.
- A. M. Tishin and Y. I. Spichkin, The Magnetocaloric Effect and its Applications, Institute of Physics Publishing, 2003 Search PubMed.
- M. H. Phan and S. C. Yu, J. Magn. Magn. Mater., 2007, 308, 325 CrossRef CAS.
- M. Smari, I. Walha, E. Dhahri and E. K. Hlil, J. Alloys Compd., 2013, 579, 564 CrossRef CAS.
- S. Xi, W. Lu and Y. Sun, J. Appl. Phys., 2012, 111, 063922 CrossRef.
- M. Bejar, R. Dhahri, F. ElHalouani and E. Dhahri, J. Alloys Compd., 2006, 414, 31 CrossRef CAS.
- A. Dhahri, M. Jemmali, E. Dhahri and M. A. Valente, J. Alloys Compd., 2015, 638, 221 CrossRef CAS.
- M. Khlifi, M. Bejar, E. Dhahri, P. Lachkar and E. K. Hlil, J. Appl. Phys., 2012, 111, 103909 CrossRef CAS PubMed.
- R. Skini, A. Omri, M. Khlifi, E. Dhahri and E. K. Hlil, J. Magn. Magn. Mater., 2014, 364, 5 CrossRef CAS.
- Y. Tokura, Rep. Prog. Phys., 2006, 69, 797 CrossRef CAS.
- N. Dhahri, A. Dhahri, K. Cherif, J. Dhahri, K. Taibi and E. Dhahri, J. Alloys Compd., 2010, 496, 69 CrossRef CAS.
- A. Tozri, E. Dhahri and E. K. Hlil, Mater. Lett., 2010, 64, 2138 CrossRef CAS.
- M. Khlifi, A. Tozri, M. Bejar, E. Dhahri and E. K. Hlil, J. Magn. Magn. Mater., 2012, 324, 2142 CrossRef CAS.
- O. Gutfleisch, M. A. Willard, E. Brück, C. H. Chen, S. G. Sankar and J. P. Liu, Adv. Mater., 2011, 23, 821 CrossRef CAS PubMed.
- V. S. Amaral and J. S. Amaral, J. Magn. Magn. Mater., 2004, 272, 2104 CrossRef.
- J. S. Amaral, M. S. Reis, V. S. Amaral, T. M. Mendonca, J. P. Araujo, M. A. Sa, P. B. Tavares and J. M. Vieira, J. Magn. Magn. Mater., 2005, 290, 686 CrossRef.
- A. M. Tishin and Y. I. Spichin, The Magnetocaloric Effect and its Applications, IOP Publishing, London, 2003 Search PubMed.
- J. S. Smart, Effective Field Theories of Magnetism, W. B. Saunders Co., Philadelphia, USA, 1966 Search PubMed.
- G. J. Liu, J. R. Sun, J. Lin, Y. W. Xie, T. Y. Zhao, H. W. Zhang and B. G. Shen, Appl. Phys. Lett., 2006, 88, 212505 CrossRef.
- V. Franco, A. Conde, J. M. Romero-Enrique and J. S. Blazquez, J. Phys.: Condens. Matter, 2008, 20, 28 CrossRef.
- Q. Y. Dong, H. W. Zhang, J. R. Sun, B. G. Shen and V. Franco, J. Appl. Phys., 2008, 103, 11 Search PubMed.
- M. Verelst, N. Rangavittal, C. N. R. Rao and A. Rousset, J. Solid State Chem., 1993, 104, 74 CrossRef CAS.
- M. Gupta, P. Yadav, W. Khan, A. Azam, A. H. Naqvi and R. K. Kotnala, Adv. Mater. Lett., 2012, 3, 220 CrossRef.
- J. Rodrigues-Carvajal, FULLPROF: A Rietveld Refinement and Pattern Matching Analysis Program, CEA-CNRS, France, 2000 Search PubMed.
- V. M. Goldschmidt, Geochemistry, Oxford University Press, 1958, p. 730 Search PubMed.
- C. A. Randall, A. S. Bhalla, T. R. Shrout and L. E. J. Cross, Mater. Res., 1990, 5, 829 CrossRef CAS.
- P. Sherrer, Gottinger Nachrichten, 1918, vol. 2, p. 98 Search PubMed.
- J. E. Langford, International Conference Accuracy in Powder Diffraction II, National Institut of Standards and Technology, Special Publication 846, Gaithersburg, MD, USA, 1992, p. 145 Search PubMed.
- A. Gholizadeh, Adv. Mater. Processes, 2015, 3, 71 Search PubMed.
- R. Langebach, M. Klaus, C. Haberstroh and U. Hesse, Magnetocaloric Cooling Near Room Temperature-A Status Quo with Respect to Household Refrigeration, 2014 Search PubMed.
- A. Tozri, J. Khelifi, E. Dhahri and E. K. Hlil, Mater. Chem. Phys., 2015, 149, 728 CrossRef.
- P. S. Behera and P. A. Bhobe, J. Magn. Magn. Mater., 2015, 394, 200 CrossRef CAS.
- H. M. Rai, S. K. Saxena, V. Mishra, A. Sagdeo, P. Rajput, R. Kumar and P. R. Sagdeo, J. Mater. Chem. C, 2016, 4, 10876 RSC.
- A. Sagdeo, K. Gautam, P. R. Sagdeo, M. N. Singh, S. M. Gupta, A. K. Nigam, R. Rawat, A. K. Sinha, H. Ghosh, T. Ganguli and A. Chakrabarti, Appl. Phys. Lett., 2014, 105, 042906 CrossRef.
- F. Issaoui, M. T. Tlili, M. Bejar, E. Dhahri and E. K. Hlil, J. Supercond. Novel Magn., 2012, 25, 1169 CrossRef CAS.
- M. Nasri, M. Triki, E. Dhahri, M. Hussein, P. Lachkar and E. K. Hlil, Phys. B: Condens. Matter, 2013, 408, 104 CrossRef CAS.
- M. Khlifi, M. Wali and E. Dhahri, Phys. B: Condens. Matter, 2014, 449, 36 CrossRef CAS.
- C. kittel, Introduction to Solid State Physics, Wiley, 1968 Search PubMed.
- K. Dhahri, N. Dhahri, J. Dhahri, K. Taibi and E. K. Hlil, J. Alloys Compd., 2017, 699, 619 CrossRef CAS.
- B. Martinez, V. Laukhin, J. Fontcuberta, L. Pinsard and A. Revcolevschi, Phys. Rev. B: Condens. Matter Mater. Phys., 2002, 66, 054436 CrossRef.
- S. K. Banerjee, Phys. Lett., 1964, 12, 16 CrossRef.
- X. Bohigas, J. Tejada, M. L. Marínez-Sarrión, S. Tripp and R. Black, J. Magn. Magn. Mater., 2000, 208, 85 CrossRef CAS.
- E. Bruck, O. Tegus, D. T. C. Thanh and K. H. J. Buschow, J. Magn. Magn. Mater., 2007, 310, 2793 CrossRef.
- S. Y. Dankov, A. M. Tishin, V. K. Pecharsky and K. A. Gschneidner Jr, Phys. Rev. B, 1998, 57, 3478 CrossRef CAS.
- V. M. Andrade, R. C. Vivas, S. S. Pedro, J. C. G. Tedesco, A. L. Rossi, A. A. Coelho and M. S. Reis, Acta Mater., 2016, 102, 49 CrossRef CAS.
- M. Pekala, K. Pekala, V. Drozd, K. Staszkiewicz, J. F. Fagnard and P. Vanderbemden, J. Appl. Phys., 2012, 112, 023906 CrossRef.
- D. T. Morelli, A. M. Mane, J. V. Mantese and A. L. Micheli, J. Appl. Phys., 1996, 79, 373 CrossRef CAS.
- R. Tlili, A. Omri, M. Bekri, M. Bejar, E. Dhahri and E. K. Hlil, J. Magn. Magn. Mater., 2016, 399, 143 CrossRef CAS.
- M. Wali, R. Skini, M. Khlifi, E. Dhahri and E. K. Hlil, Dalton Trans., 2015, 44, 12796 RSC.
- A. Dhahri, E. Dhahri and E. K. Hlil, Appl. Phys. A, 2014, 116, 2077 CrossRef CAS.
- D. N. H. Nam, N. V. Dai, L. V. Hong, N. X. Phuc, S. C. Yu, M. Tachibana and E. Takayama-Muromachi, J. Appl. Phys., 2008, 103, 043905 CrossRef.
- S. Mnefgui, A. Dhahri, N. Dhahri, El. K. Hlil and J. Dhahri, J. Magn. Magn. Mater., 2013, 340, 91 CrossRef CAS.
- J. S. Amaral and V. S. Amaral, J. Magn. Magn. Mater., 2010, 322, 1552 CrossRef CAS.
- X. Si, K. Zhou, R. Zhang, Y. Liu and J. Qi, J. Appl. Phys., 2017, 121, 113902 CrossRef.
- M. S. Anwar, S. Kumar, F. Ahmed, N. Arshi, G. W. Kim and B. H. Koo, J. Korean Phys. Soc., 2012, 60, 1587 CrossRef CAS.
- P. T. Phong, N. V. Dang, L. V. Bau, N. M. An and I. J Lee, J. Alloys Compd., 2017, 698, 451 CrossRef CAS.
- V. Franco and A. Conde, Int. J. Refrig., 2010, 33, 465 CrossRef CAS.
- C. M. Bonilla, J. H. Albillos, F. Bartolomé, L. M. García, M. P. Borderías and V. Franco, Phys. Rev. B: Condens. Matter Mater. Phys., 2010, 81, 224424 CrossRef.
- A. Arrott and J. E. Noakes, Phys. Rev. Lett., 1967, 19, 786 CrossRef CAS.
- J. S. Kouvel and M. E. Fisher, Phys. Rev., 1964, 136, 1626 CrossRef CAS.
- J. Fan, L. Pi, L. Zhang, W. Tong, L. Ling, B. Hong and Y. Zhang, Appl. Phys. Lett., 2011, 98, 072508 CrossRef.
- H. Oesterreicher and F. T. Paker, J. Appl. Phys., 1984, 55, 4336 CrossRef.
- V. Franco, A. Conde, M. D. Kuzmin and J. M. Romero-Enrique, J. Appl. Phys., 2009, 105, 917 CrossRef.
- B. Widom, J. Chem. Phys., 1965, 43, 3898 CrossRef.
- M. Pekala, J. Appl. Phys., 2010, 108, 113913 CrossRef.
- H. Oesterreicher and F. T. Parker, J. Appl. Phys., 1984, 55, 4334 CrossRef CAS.
- T. L. Phan, P. Q. Thanh, P. D. H. Yen, P. Zhang, T. D. Thanh and S. C. Yu, Solid State Commun., 2013, 167, 49 CrossRef CAS.
- A. Hankey and H. E. Stanley, Phys. Rev. B: Condens. Matter Mater. Phys., 1972, 6, 3515 CrossRef.
- X. Si, Y. Shen, X. Ma, S. Chen, J. Lin, J. Yang and Y. Liu, Acta Mater., 2018, 143, 306 CrossRef CAS.
- J. C. Debnath, A. M. Strydom, P. Shamba, J. L. Wang and S. X. Dou, J. Appl. Phys., 2013, 113, 233903 CrossRef.
- H. E. Stanley, Introduction to phase transitions and critical phenomena, Oxford University Press, London, 1971 Search PubMed.
| This journal is © The Royal Society of Chemistry 2018 |

