DOI:
10.1039/C7RA12393K
(Paper)
RSC Adv., 2018,
8, 5441-5450
Fabrication and photocatalytic property of magnetic SrTiO3/NiFe2O4 heterojunction nanocomposites
Received
13th November 2017
, Accepted 26th January 2018
First published on 31st January 2018
Abstract
Novel multifunctional SrTiO3/NiFe2O4 nanocomposites were successfully fabricated via a two-step route. The as-prepared samples were characterized by using X-ray diffraction (XRD), field-emission scanning electron microscopy (FESEM), energy dispersive spectroscopy (EDS), field-emission transmission electron microscopy (TEM), UV-visible diffuse reflectance spectroscopy (DRS), X-ray photoelectron spectroscopy (XPS), photoluminescence (PL) spectroscopy and vibrating sample magnetometry (VSM). The results indicate that the SrTiO3/NiFe2O4 heterostructures are composed of SrTiO3 spheroidal nanoparticles adhered to NiFe2O4 polyhedra. The heterojunction established in the composite material accelerates the process of electron–hole pair separation and boosts the photo-Fenton reaction. Among the samples, 15 wt% SrTiO3/NiFe2O4 nanocomposites exhibit a powerful light response and excellent room temperature ferromagnetism. Subsequently, the photocatalytic degradation of RhB over the as-prepared samples was investigated and optimized, revealing that the 15 wt% SrTiO3/NiFe2O4 nanocomposites exhibit the best photocatalytic activity and stability under simulated solar light irradiation. Furthermore, according to experimental results, the possible mechanism of improved photocatalytic activity was also proposed.
1. Introduction
Photocatalysis has attracted researchers' interest due to its potential application in degradation of organic compounds for wastewater treatment, water splitting to produce high purity hydrogen, solar panels, and so on.1–4 Several photocatalytic semiconductor materials, for instance ZnO and TiO2, have been widely used in degradation of organic compounds, nevertheless, most photocatalysts are faced with two problem: low efficiency under visible-light irradiation and difficult recycling of photocatalysts after use. Thus, development of magnetic and highly efficient visible-light-driven photocatalysts has become an appealing challenge. Recent investigation of magnetic semiconductor photocatalysts has attracted attention due to their easy recycling, such as MFe2O4 (M = Ni, Zn, Fe, Co, Cu). Among these well-known magnetic semiconductors, NiFe2O4 is a visible-light response semiconductor material, typical representative of magnetic materials with high stability, high magnetic permeability and high electrical resistivity. It has wide application for magnetic devices, catalysis, water treatment, magnetic fluids and microwave absorbing materials.5–8 Unfortunately, pure NiFe2O4 exhibits lower photocatalytic activity owing to fast recombination of photoelectron–hole pairs.9,10 To improve the photocatalytic activity, many researchers have reported combinations with other semiconductor materials and doping to solve the problem meaningfully. Such as, Ji and Jing synthesized the magnetic g-C3N4/NiFe2O4 hybrids by a facile chemisorption method to degrade methyl orange dye,11 Zeng and Song synthesized the Au/g-C3N4/NiFe2O4 nanocomposites by a facile calcination method for enhanced visible-light-driven photocatalytic hydrogen evolution12, Dongdong Lv, et al. synthesized magnetic NiFe2O4/BiOBr nanocomposites by one-pot combustion for degradation of model dyes MB,13 Wang and Fu synthesized NiFe2O4/MWCNT to degrade phenol with C/C0 reaching 90% in 400 min under UV light,14 Hua-Yue Zhu, et al. synthesized the NiFe2O4/ZnO hybrids using a hydrothermal method to degrade congo red solution with C/C0 reaching 94.55% under simulated solar light irradiation for 10 min,15,16 and so on. SrTiO3 is perovskite p-type indirect semiconductor, endowed with corrosion properties, thermal stability, photocatalytic activity.17,18 However, pure SrTiO3 is used for dye degradation only in the UV region due to its wide band gap of 3.2 eV, consequently limiting its photocatalytic activity to the visible light region of the sunlight spectrum.19 Besides, pure SrTiO3 photocatalyst is difficult to be separated and recycled from wastewater and easily produces secondary pollution, which limits the practical application of SrTiO3. To overcome the above problem, many researchers have adopted metal or anion doping and coupling to other semiconductor to enhance the photocatalytic ability of SrTiO3, such as lanthanum and nitrogen-co-doped SrTiO3/TiO2,20 Cu-loaded SrTiO3,21 Cr-doped SrTiO3/g-C3N4,22 g-C3N4/N-doped SrTiO3,23 Rh-doped SrTiO3,24 Ag3PO4/Cr-SrTiO3,25 SrTiO3/BiOBr,26 LaFeO3/SrTiO3 (ref. 27) and Panpan Jing et al. synthesized the hierarchical SrTiO3/NiFe2O4 porous nanotubes by electrospinning method for degrade methyl orange dye.28,29 However, the electrospinning method is disadvantaged by high cost and rigorous condition in procedure, and is unsuitable for industrial production. If magnetic NiFe2O4 nanoparticles are coupled with SrTiO3 by a facile and large-scale preparation method, it is possible to improve the photocatalytic activity and convenient separation from the waste water.
Inspired by the previous studies, we synthesized a series of SrTiO3/NiFe2O4 nanocomposites with different percentage of SrTiO3 by a simple two-step method. The photocatalytic performance of the SrTiO3/NiFe2O4 nanocomposites catalysts was evaluated by the photodegradation of rhodamine B (RhB) dyes under simulated solar light illumination.
2. Experimental
2.1. Materials
Nickel chloride hexahydrate (NiCl2·6H2O ≥ 99.5%), iron chloride hexahydrate (FeCl3·6H2O ≥ 99%), sodium hydroxide (NaOH ≥ 98.5%), strontium chloride (SrCl2·6H2O ≥ 99.5%), acetic acid (CH3COOH ≥ 99%), citric acid (C6H8O7 ≥ 99%), titanium isopropoxide (CH3CH3CHO)4Ti ≥ 99.5% were purchased from Aladdin Industrial Co., Ltd (Shanghai, China). All the reagents were of analytical grade and used without any further purification.
2.2. Preparation of SrTiO3/NiFe2O4 nanocomposites
2.2.1 Preparation of SrTiO3. SrTiO3 was synthesized by a sol–gel method. In a typical process,30 14.2 mL of (CH3CH3CHO)4Ti was dissolved in 24 mL of CH3COOH, and 20 mL water was added to the (CH3CH3CHO)4Ti solution under magnetic stirring till clear transparent solution was obtained. 12.797 g of SrCl2·6H2O dissolved in 20 mL of water and 4 M C6H8O7 were added to the above solution, and then the pH of the solution was adjusted to 1.5. The solution was stirred for 6 h and heated in waterbath at 65 °C for 8 h. The viscous sol obtained was again heated at 110 °C for 12 h. The brown mass formed was dried at 200 °C for 8 h and heated at 500 °C for 8 h till it changed into white powder.
2.2.2 Preparation of SrTiO3/NiFe2O4. First, 0.02 mol FeCl3·6H2O was dissolved into 150 mL distilled water and 0.01 mol NiCl2·6H2O was dissolved into the FeCl3 aqueous solution under magnetic stirring. The pH of the solution was adjusted to 13.0 with NaOH solution, and heated in waterbath at 80 °C for 1 h, during which time the red-brown products gradually precipitated from the solution. Second, the pH of the solution was adjusted to 7.0 with distilled water, and then, 0.4136 g SrTiO3 was added to the solution under magnetic stirring. Finally, the products were collected, repeatedly washed with distilled water, and then annealed at 500 °C for 3 h in air. The reddish brown 15 wt% SrTiO3/NiFe2O4 powder was obtained. According to this method, other SrTiO3/NiFe2O4 photocatalysts with different SrTiO3 content were synthesized. To comparison, pure NiFe2O4 was obtained without SrTiO3 while keeping all the other conditions unchanged.
2.3. Instruments and characterization
X-ray powder diffraction (XRD) patterns were recorded with an X-ray diffractometer model D/max-2500 (Rigaku, Japan) with Cu Kα radiation (λ = 1.5418 Å). The diffractometer was set at 40 kV accelerating voltage and 20 mA applied current, and the samples were scanned from 10° to 80° at a rate of 0.02° s−1. The morphology and average grain size of the samples were observed using field emission scanning electron microscopy (FESEM, SUAPR55, Zeiss, Germany) equipped with energy dispersive X-ray spectroscopy (EDS). The microscopic features of the samples were characterized by transmission electron microscopy (TEM, FEI Tecnai F20). X-ray photoelectron spectroscopy (XPS) data were collected from a ESCALAB 250Xi X-ray photoelectron spectrometer from VG Scientific using 300 W Al Kα radiation (Thermo Fisher Scientific, USA). The UV-vis diffuse reflectance spectra (DRS) were obtained using a UV-9000S UV-vis spectrophotometer (METASH, China). The photoluminescence (PL) spectra of samples were measured by a FLs980 fluorescence spectrophotometer (Edinburgh, UK). The magnetism of the composites was analyzed on a MPMS XL-7 magnetometer (Quantum Design, USA).
2.4. Evaluation of photocatalytic performance
The photocatalytic performances of all the as-synthesized catalysts were assessed by degradation of target pollutants RhB solution under simulated solar light illumination. The photodegradation experiments were done according to procedures described by us in previous report.31 The specific process is as follows: 100 mg photocatalyst was added into the RhB solution (20 mg L−1, 100 mL), which was stirred in the dark for 30 min. The RhB solution was put in the photocatalytic experiment device, where the 0.4 mW cm−2 light intensity was ensured. During each photocatalytic experiment, 5 mL of the sample suspension was taken out at certain time intervals and separated to remove the residual particles. Residual RhB solution concentrations were analyzed by measuring the absorbance peak at 554 nm with the UV-9000S UV-vis spectrometer at ambient temperature, respectively. The degradation efficiency η (%) of dye solution can be calculated according to eqn (1)| |
 | (1) |
where η (%) is the degradation rate of the dye (catalytic degradation at any time t (min), A0 is the initial absorbance of the dye solution, and At is the absorbance of the dye solution at degradation time t (min).
3. Results and discussion
3.1. XRD analysis
The XRD patterns of as-synthesized samples are presented in Fig. 1. For the XRD pattern of the pure SrTiO3, all the diffraction peaks at the 2θ values of 22.75°, 32.39°, 39.95°, 46.47°, 52.34°, 57.78°, 67.82°, 72.56° and 77.18° can be indexed to (100), (110), (111), (200), (210), (211), (220), (221) and (310) crystal planes of perovskite SrTiO3 (JCPDS no. 73-0661), respectively.32 Besides, no evidence of other impurities is found. From the XRD pattern of pure NiFe2O4, it can be seen that the diffraction peaks can be indexed to spinel crystals NiFe2O4 (JCPDS no. 54-0964).33,34 All the diffraction peaks of NiFe2O4 at the 2θ values of 18.39°, 30.28°, 35.68°, 37.33°, 43.37°, 53.82°, 63.10° 67.33°and 74.58° are corresponded to (111), (220), (311), (222), (400), (422), (511), (440), and (533) crystal planes, respectively. From the XRD pattern of the 15 wt% NiFe2O4/SrTiO3 nanocomposites, it found that the (100), (110), (111), (200), (210), (211), (220), (221) and (310) peaks correspond to SrTiO3 phase and the (111), (220), (311), (222), (400), (422), (511), (440) and (533) peaks conform to spinel NiFe2O4 phase. No other impurities are observed.
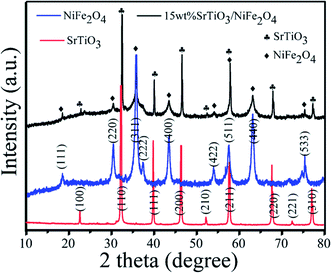 |
| | Fig. 1 XRD patterns of pure SrTiO3, pure NiFe2O4 and 15 wt% SrTiO3/NiFe2O4 nanocomposites. | |
3.2. XPS analysis
To investigate the elemental composition and chemical states of the as-prepared samples, XPS measurement was carried out to characterize the 15 wt% SrTiO3/NiFe2O4 nanocomposites, and the results are displayed in Fig. 2. The XPS survey scan spectrum of SrTiO3/NiFe2O4 nanocomposites is shown in Fig. 2a, indicating the existence of Ni, Fe, Sr, Ti and O elements in the composites. Furthermore, all the obtained binding energies were referenced to the C 1s (284.65 eV). Fig. 2b shows the XPS spectrum of Ni 2p, where the two peaks at 854.16 eV and 873.62 eV correspond to the banding energies of Ni 2p3/2 and Ni 2p1/2, respectively, which suggests the typical banding energy of Ni2+.35 Fig. 2c shows the XPS spectrum of Fe 2p. The peak at 710.41 eV corresponds to the binding energy of Fe 2p3/2, and the peak at 724.72 eV ascribes to Fe 2p1/2 signal, indicating that the Fe element exists in the Fe3+ ions.36 In the spectrum of Sr 3d (Fig. 2d), the peaks at 132.50 eV and 134.25 eV conform to the binding energies of Sr 3d5/2 and Sr 3d3/2, respectively, indicating the existence of the Sr2+ state.37 As displayed in Fig. 2e, the peaks at 457.90 eV and 463.80 eV are observed in the spectrum of Ti 2p, which correspond to the Ti 2p3/2 and Ti 2p1/2, respectively, suggesting that the Ti element exists in the Ti4+ state. The peaks of O 1s can be divided into three peaks located at 531.2 eV, 529.5 eV and 533.1 eV, revealing three different kinds of O chemical state in the as-prepared samples (Fig. 2f). The peak at 529.5 eV is ascribed to the lattice oxygen of SrTiO3/NiFe2O4, the peak at 531.2 eV is generally attributed to the chemisorbed oxygen caused by oxygen vacancies, and the peak at 533.1 eV is ascribed to the water molecules.38 The XPS result further confirms the coexistence of SrTiO3 and NiFe2O4 in the 15 wt% SrTiO3/NiFe2O4 nanocomposites.
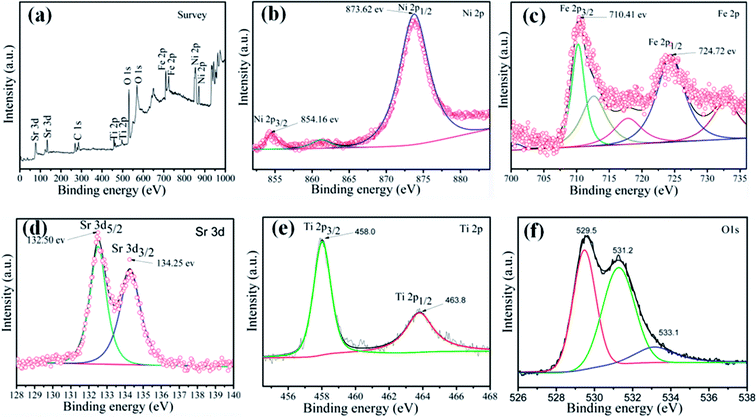 |
| | Fig. 2 XPS spectra of the 15 wt% SrTiO3/NiFe2O4 nanocomposites: the XPS survey spectrum (a), Ni 2p (b), Fe 2p (c), Sr 3d (d), Ti 2p (e) and O 1s (f). | |
3.3. SEM and TEM analysis
The particle size and morphology of the samples was investigated by means of SEM, as shown in Fig. 3. In Fig. 3a, it can be clearly observed that the pure NiFe2O4 is made up of polygon particles with average diameter size about 50 nm. Fig. 3b exhibits the pure SrTiO3 consists of spheroidal or spherical particles with diameters in the range of 300–800 nm. Fig. 2c illustrates that SrTiO3 spheroidal nanoparticles are adhered to the NiFe2O4 polygon, which would be benefit to form a heterojunction structure and promote the separation efficiency of photoinduced carriers. Furthermore, the as-synthesized 15 wt% SrTiO3/NiFe2O4 nanocomposites were analysed by EDS, as shown in Fig. 3d. The elements Fe, Ni, Ti, Sr and O are present in 15 wt% SrTiO3/NiFe2O4 nanocomposites, and the atomic ratio is the same as that of stoichiometric composition of the sample.
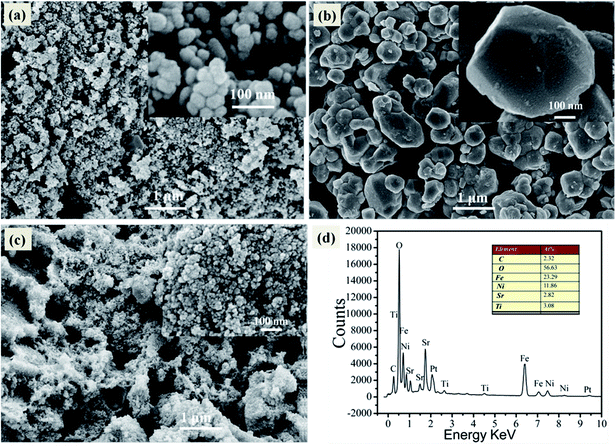 |
| | Fig. 3 SEM image of pure NiFe2O4 (a), pure SrTiO3 (b), 15 wt% SrTiO3/NiFe2O4 nanocomposites (c) and EDS spectrum of 15 wt% SrTiO3/NiFe2O4 nanocomposites (d). | |
To get more detailed insight into the microarchitectures of the two SrTiO3/NiFe2O4 composites, TEM analysis was further carried out. Fig. 4a shows the TEM image of SrTiO3/NiFe2O4 nanocomposites, from which one can see that NiFe2O4 particles are uniformly dispersed onto the SrTiO3 without any accumulation. Moreover, from the HRTEM image of SrTiO3/NiFe2O4 nanocomposites (Fig. 4c and d), it is clearly seen that SrTiO3 and NiFe2O4 nanoparticles are closely connected to each other. The lattice fringes with a lattice spacing of 0.275 nm and 0.256 nm from different regions could be corresponding to the (110) lattice planes of SrTiO3 and (311) lattice planes of NiFe2O4, respectively. The SAED pattern (Fig. 4e) contains two sets of diffraction rings, which further indicates the polycrystalline nature of the SrTiO3/NiFe2O4 nanocomposites. The first set of diffraction rings (bright circles) composed of bright spots are indexed to the (311), (400) and (440) of NiFe2O4, while another set (dusky circles) is indexed to the (110), (200) and (211) of SrTiO3. In addition, the elemental mappings are shown in Fig. 5a–f. It can be seen that the signals of Fe, Ni, Sr, Ti and O elements are the same in the spatial distribution. To prove that the SrTiO3/NiFe2O4 nanocomposites is a uniform mixture of SrTiO3 and NiFe2O4 nanoparticles, spot EDS scanning analysis was carried out further, as shown in Fig. 5g. Peaks corresponding to any impurities were found to be absent, peaks corresponding to C and Cu are observed due to the use of carbon coated Cu grids for the analysis.
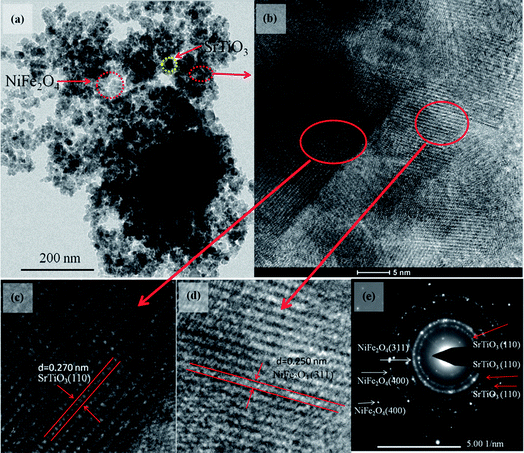 |
| | Fig. 4 TEM (a), HRTEM image (b–d) and the SAED pattern (e) for the SrTiO3/NiFe2O4 nanocomposites. | |
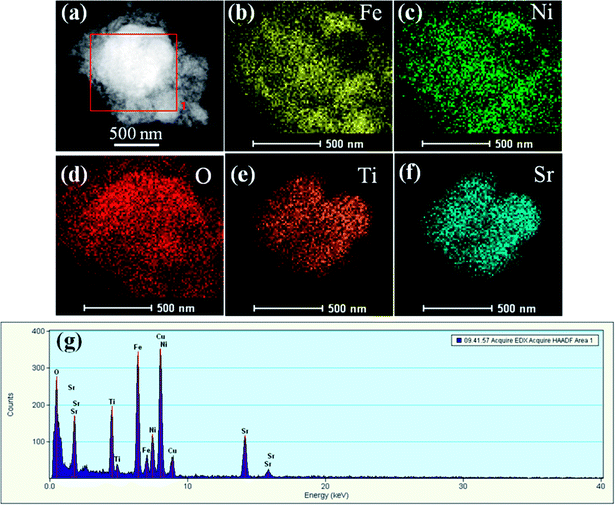 |
| | Fig. 5 The corresponding elemental mapping images (a–f) and spot EDS pattern (g) for the SrTiO3/NiFe2O4 nanocomposites. | |
3.4. UV-vis analysis
Fig. 6a shows the UV-vis diffuse reflectance spectra reflected (DRS) of the pure NiFe2O4, pure SrTiO3 and SrTiO3/NiFe2O4 nanocomposites to reveal their optical properties. The pure SrTiO3 exhibits a 385 nm absorption band-edge in the UV region, corresponding to band gap energy of 3.15 eV.39,40 The pure NiFe2O4 absorption band extends to the whole visible-light region and the absorption peak intensity is more stronger. We also observe that the 15 wt% SrTiO3/NiFe2O4 composite has the strongest absorption intensity, which suggests that the integration of SrTiO3 and NiFe2O4 could promote the photoabsorption ability. Based on the UV-vis DRS results, the bandgaps of the samples can be estimated using Tauc's equation:41where α, һ, ν, n and A are absorption coefficient, Plank constant, light frequency, the nature of transition and a constant, respectively. Since both SrTiO3 and NiFe2O4 have the indirect allowed transition, n = 2 is substituted in eqn (2). Thus, Eg value of the samples can be estimated from a plot (αһν)2 versus photon energy (һν). The intercept of the tangent to X axis would give an approximation of the band gap energy of the sample. From Fig. 6b, the band gap energy of pure SrTiO3, NiFe2O4 and 15 wt% SrTiO3/NiFe2O4 nanocomposites were about 3.15 eV, 1.82 eV and 1.42 eV, respectively, which basically conform to the previous studies.28,41 The narrowed band gap of 15 wt% SrTiO3/NiFe2O4 nanocomposites would enhanced absorption in UV and visible light regions.
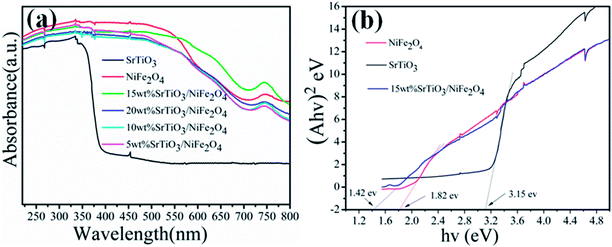 |
| | Fig. 6 UV-vis DRS (a) and band gap energy (Eg) (b) of the pure NiFe2O4, pureSrTiO3 and 15 wt% SrTiO3/NiFe2O4 nanocomposite. | |
3.5. Magnetic properties
Magnetic performance is also very important aspect for magnetic photocatalysts. So the hysteresis loops of pure NiFe2O4 and 15 wt% SrTiO3/NiFe2O4 nanocomposites are shown in Fig. 7. It is seen that the saturation magnetization (Ms) of pour NiFe2O4 is about 40 emu g−1. Owing to the presence of the non-magnetic SrTiO3, the Ms values for 15 wt% SrTiO3/NiFe2O4 nanocomposites, obtained as about 23.35 emu g−1, is lower than that of pure NiFe2O4. Even so, the 15 wt% SrTiO3/NiFe2O4 nanocomposites is adequate to collect and recycle the photocatalyst from the wastewater solution by an external magnetic filed, as shown in the inset of Fig. 6. The results suggest that the 15 wt% SrTiO3/NiFe2O4 nanocomposites is an excellent magnetic photocatalysts, which will play an important role in recycling of photocatalysts.
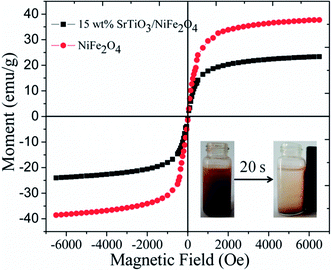 |
| | Fig. 7 The hysteresis loops of pure NiFe2O4 and 15 wt% SrTiO3/NiFe2O4 nanocomposite (inset: the magnetic separation of 15-NFO/BOI nanocomposites by a magnet). | |
3.6. Photocatalytic performance
RhB is a typical artificial aromatic compound dye with a molecular formula C28H31ClN2O3 and is commonly used as a colour additive in industry, but it is not easy to decompose by itself. RhB is highly toxic and probably causes cancer.42 So the degradation of RhB is used to evaluate the photocatalytic performance of the as-prepared pure NiFe2O4, pure SrTiO3 and SrTiO3/NiFe2O4 nanocomposites, as shown in Fig. 8a. It can be seen that the degradation percentage of the dye reaches 38.8%, 47.7%, 59.4%, 84.8%, 97.62%, 74.01% for NiFe2O4, SrTiO3, 5 wt% SrTiO3/NiFe2O4, 10 wt% SrTiO3/NiFe2O4, 15 wt% SrTiO3/NiFe2O4 and 20 wt% SrTiO3/NiFe2O4 under simulated solar light irradiation for 120 min, respectively. In addition, in the absence of photocatalysts, the RhB dye is very stable and its self-decomposition can be neglected. The photocatalytic efficiency of pure NiFe2O4 in the RhB solution is the lowest, only 38.8% of the dye is observed to be decolorized, which may be ascribed to the fast recombination of photo-generated carriers. These results clearly reveal that 15 wt% SrTiO3/NiFe2O4 nanocomposites exhibit the best photocatalytic performance as high as 97.62% under simulated solar light irradiation for 120 min, the photodegradation rate for 15 wt% SrTiO3/NiFe2O4 nanocomposites is approximately 2.5 times and 2 times higher than those for NiFe2O4 and SrTiO3, respectively, which is superior to the previous studies.43 The superior photocatalytic performance of 15 wt% SrTiO3/NiFe2O4 nanocomposites should be attributed to the strong adsorption abilities and great facilitation of the electron–hole pairs separation. UV-vis spectra are severally observed during degradation of RhB solution under simulated solar light irradiation, as shown in Fig. 8b, revealing the decomposition behaviours of RhB solution over the photocatalysis of 15 wt% SrTiO3/NiFe2O4 nanocomposites. The peak intensity of the characteristic absorption at about 554 nm is found to be decreased as reaction time goes on.
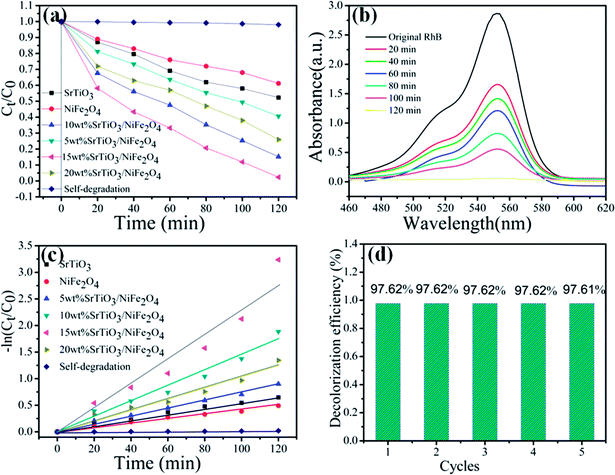 |
| | Fig. 8 Photocatalytic degradation of RhB for all samples under simulated solar light illumination (a), absorption spectra of RhB over 15 wt% SrTiO3/NiFe2O4 nanocomposites (b), −ln(Ct/C0) vs. time for photodegradation of RhB by different catalysts (c), cycling degradation rate (d) for RhB of 15 wt% SrTiO3/NiFe2O4 nanocomposites under simulated solar light illumination. | |
To reveal the reaction kinetics of the photo-degradation RhB on different photocatalysts, the degradation rates are calculated using the following pseudo-first-order kinetics (eqn (3))
where
C0,
Ct, and
Kapp stand for the initial concentration, the concentration at time
t, and the apparent pseudo-first-order rate constant, respectively.
44,45 Fig. 8c shows that −ln(
Ct/
C0) exhibits a good linear relationship with irradiation time and the photocatalytic reaction belongs to the pseudo-first-order reaction. The
Kapp46 value obtained for SrTiO
3, NiFe
2O
4, 5 wt% SrTiO
3/NiFe
2O
4, 10 wt% SrTiO
3/NiFe
2O
4, 15 wt% SrTiO
3/NiFe
2O
4 and 5 wt% SrTiO
3/NiFe
2O
4 are 5.4 × 10
−3, 4.1 × 10
−3, 7.5 × 10
−3, 1.45 × 10
−2, 2.29 × 10
−2 and 1.1 × 10
−2 min
−1, respectively. Among these composites, the 15 wt% SrTiO
3/NiFe
2O
4 nanocomposites display the maximum degradation rate constant.
47 As depicted in
Fig. 8d, the dye degradation over the 15 wt% SrTiO
3/NiFe
2O
4 nanocomposites show no obvious deterioration after the nanocomposites are reused five times, indicating the excellent stability of the 15 wt% SrTiO
3/NiFe
2O
4 nanocomposites photocatalysts.
48
3.7. Photocatalytic mechanism discussions
In order to better reveal the photocatalytic mechanism, we carried out the trapping experiments on the degradation of RhB under the same conditions. Iso-propyl alcohol (IPA), disodium ethylene-diaminetetraacetate (EDTA-2Na) and benzoquinone (BQ) were used as the scavengers of the hydroxyl radical (˙OH), holes and superoxide radical (˙O2˙−), respectively, as shown in Fig. 9. It is found that the addition of BQ or EDTA-2Na to the reaction solution has only a minor suppression on the degradation of RhB and the dye degradation still maintains a high level of 94.72% and 91.78% after 120 min of photocatalysis, respectively, indicating that h+ and ˙O2˙− are not the dominant reaction species in the photocatalysis. However, when adding IPA to the reaction solution, the dye degradation is significantly inhibited. Only 24% of the dye is observed to be decolorized on adding IPA, and the decolorization is mainly attributed to the adsorption effect. This implies that the dye degradation is highly correlated with ˙OH.49
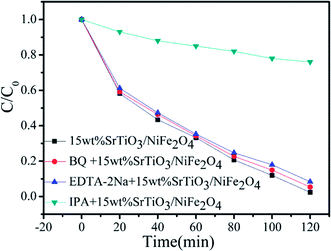 |
| | Fig. 9 Reactive species trapping experiments over 15 wt% SrTiO3/NiFe2O4 nanocomposites. | |
In order to investigate the migration and separation efficiency of photo-generated charge carriers in as-prepared samples, PL emission spectra for pure NiFe2O4 and 15 wt% SrTiO3/NiFe2O4 nanocomposites are shown in Fig. 10. For pure NiFe2O4, a strong emission peak at 441 nm is observed. A similar PL spectrum was obtained for 15 wt% SrTiO3/NiFe2O4 nanocomposites, but the overall emission intensity is apparently reduced compared to that of the pure NiFe2O4. In general, high PL intensity manifests a high electron–hole recombination rate and poor photocatalytic performance.50 Therefore, the weak emission intensity in 15 wt% SrTiO3/NiFe2O4 nanocomposites indicates the composition of SrTiO3 and NiFe2O4 was conducive to prevent the recombination of electrons and holes, which is beneficial for the improvement of photocatalytic performance.
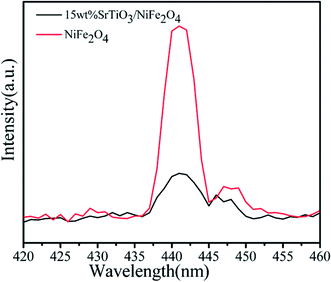 |
| | Fig. 10 PL spectra (excited at 325 nm) of pure NiFe2O4 and 15 wt% SrTiO3/NiFe2O4 nanocomposites. | |
In SrTiO3/NiFe2O4 nanocomposites, the band positions of SrTiO3 and NiFe2O4 play an important role in the generation, transference and recombination of photo-generated electron–hole pairs. The band positions of NiFe2O4 and SrTiO3 are theoretically calculated using the atom's Mulliken electronegativity definition (eqn (4) and (5)):51
where
EVB is the valence band (VB) potential,
ECB is the conduction band (CB) potential,
EC is the energy of free electrons on the hydrogen scale (
ca. 4.5 eV),
Eg is the band gap energy of the semiconductor, and
χ is the absolute electronegativity of the semiconductor.
52,53 Therefore, the
EVB and
ECB of NiFe
2O
4 are calculated to be 2.62 eV and 0.80 eV, respectively, whereas the
EVB and
ECB of SrTiO
3 are about 2.02 eV and −1.13 eV, respectively.
According to the above results, the possible photocatalytic mechanism of the SrTiO3/NiFe2O4 nanocomposites is illustrated in Fig. 11. When the photocatalyst was irradiation with simulated solar light, the electrons on the VB position are excited to the CB position for both SrTiO3 and NiFe2O4. The electrons in the CB of SrTiO3 move to the CB of NiFe2O4 and holes in the VB of NiFe2O4 transferred to the VB of SrTiO3, and therefore, the electrons–holes pairs get effective separation and avoid recombination. In addition, because the CB value of NiFe2O4 (0.8 eV) is more positive than the potential of O2/˙O2˙− (−0.33 eV vs. NHE),54 the photo-electrons at the CB of NiFe2O4 are trapped by O2 to form reactive ˙O2− on the photocatalyst surface. ˙O2˙− can react with h+ to form HO2˙ and H2O2, and the H2O2 reacts with HO2˙ to generate hydroxyl (˙OH) radicals, which cause the degradation of the RhB dye. Compared with the E0(˙OH/OH−) (1.99 eV vs. NHE),31,55 the VB potential of SrTiO3 (2.02 eV) and NiFe2O4 (2.62 eV) is more positive, which implies that holes can not react directly with RhB,56 but the VB holes of SrTiO3 can react with OH− to produce ˙OH radicals, ˙OH is a powerful oxidizing agent and can degrade most pollutants. Additionally, owing to the photo-Fenton reaction, photo-electrons at the CB of NiFe2O4 can react with H2O2 and Fe3+ to produce ˙OH for the oxidation of RhB.57,58 There action processes can be written as follows:
| | |
SrTiO3 + hv → SrTiO3(e−)CB + SrTiO3(h+)VB
| (6) |
| | |
NiFe2O4 + hv → NiFe2O4(e−)CB + NiFe2O4(h+)VB
| (7) |
| | |
SrTiO3(e−)CB + NiFe2O4 → SrTiO3 + NiFe2O4(e−)CB
| (8) |
| | |
NiFe2O4(e−)CB + O2 → ˙O−2
| (9) |
| | |
H2O2 + ˙O−2 → ˙OH + OH− + O2
| (12) |
| | |
SrTiO3(h+)VB + OH− → ˙OH
| (13) |
| | |
Fe3+ + H2O2 + hv → Fe2+ + ˙OH + H+
| (14) |
| | |
Fe2+ + H2O2 + hv → Fe3+ + ˙OH + OH−
| (15) |
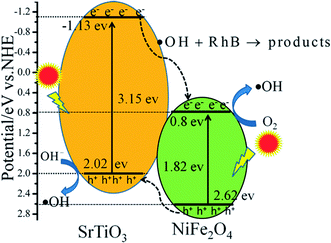 |
| | Fig. 11 Schematic illustration of excitation and separation of photoinduced electron–hole pairs for SrTiO3/NiFe2O4 heterojunction nanocomposites under simulated solar light irradiation. | |
4. Conclusion
In summary, novel multifunctional SrTiO3/NiFe2O4 nanocomposites were successfully fabricated by coupling SrTiO3 with NiFe2O4 through a two-step route. It demonstrates that the SrTiO3/NiFe2O4 heterojunction structure is composed of NiFe2O4 nanoparticles adhered to the SrTiO3 spheres. The heterojunction established in the composite material accelerates the process of electron–hole pair separation and boosts the photo-Fenton reaction. Among all the samples, the 15 wt% SrTiO3/NiFe2O4 nanocomposites exhibit a powerful light response, excellent room temperature ferromagnetism, and the best photoactivity for degradation of RhB organic pollutants under simulated solar light irradiation. Furthermore, according to experimental results, the possible mechanism of improved photocatalytic activity is also proposed.
Conflicts of interest
The authors declare no competing financial interest.
Acknowledgements
This work was supported by the National Natural Science Foundation of China (61107055) and the Specialized Research Fund for the Doctoral Program of Jiangsu University of Technology (KYY17011).
Notes and references
- J. Liu, Y. Liu, N. Y. Liu, Y. Z. Han, X. Zhang, H. Huang, Y. Lifshitz, S. T. Lee, J. Zhong and Z. H. Kang, Science, 2015, 347, 970–974 CrossRef CAS PubMed.
- M. A. Shannon, P. W. Bohn, M. Elimelech, J. G. Georgiadis, B. J. Marinas and A. M. Mayes, Nature, 2008, 452, 301–310 CrossRef CAS PubMed.
- A. Ahuja and K. M. Mosalam, Energy and Buildings, 2017, 153, 448–460 CrossRef.
- S. Piskunov, O. Lisovski, J. Begens, D. Bocharov, Y. F. Zhukovskii, M. Wessel and E. Spohr, J. Phys. Chem. C, 2015, 119, 18686–18696 CAS.
- C. T. Cherian, J. Sundaramurthy, M. V. Reddy, P. S. Kumar, K. Mani, D. Pliszka, C. H. Sow, S. Ramakrishna and B. V. R. Chowdari, ACS Appl. Mater. Interfaces, 2013, 5, 9957–9963 CAS.
- H. Song, L. P. Zhu, Y. G. Li, Z. R. Lou, M. Xiao and Z. Z. Ye, J. Mater. Chem. A, 2015, 3, 8353–8360 CAS.
- T. H. Yu, W. Y. Cheng, K. J. Chao and S. Y. Lu, Nanoscale, 2013, 5, 7356–7360 RSC.
- M. Dhiman, A. Goyal, V. Kumar and S. Singhal, New J. Chem., 2016, 40, 10418–10431 RSC.
- H. S. Kim, D. J. Kim, B. S. Kwak, G. B. Han, M. H. Um and M. Kang, Chem. Eng. J., 2014, 243, 272–279 CrossRef CAS.
- R. J. Elias and A. L. Waterhouse, Food Chem., 2010, 58(3), 1699–1707 CrossRef CAS PubMed.
- H. Y. Ji, X. C. Jing, Y. G. Xu, J. Yan, H. P. Li, Y. P. Li, L. Y. Huang, Q. Zhang, H. Xu and H. M. Li, RSC Adv., 2015, 5, 57960–57967 RSC.
- J. Zeng, T. Song, M. X. Lv, T. T. Wang, J. Y. Qin and H. P. Zeng, RSC Adv., 2016, 6, 54964–54975 RSC.
- D. D. Lv, D. F. Zhang, X. Y. Liu, Z. G. Liu, L. Y. Hu, X. P. Pu, H. Y. Ma and D. C. Li, Sep. Purif. Technol., 2016, 158, 302–307 CrossRef CAS.
- P. Xiong, Y. S. Fu, L. J. Wang and X. Wang, J. Chem. Eng., 2012, 195–196, 149–157 CrossRef CAS.
- H. Y. Zhu, R. Jiang, Y. Q. Fu, R. R. Li, J. Yao and S. T. Jiang, Appl. Surf. Sci., 2016, 369, 1–10 CrossRef CAS.
- L. Zhang and W. L. Jiao, J. Alloys Compd., 2013, 581, 11–15 CrossRef CAS.
- J. Zhou, L. Yin, K. Zha, H. R. Li, Z. Y. Liu, J. X. Wang, K. Duan and B. Feng, Appl. Surf. Sci., 2016, 367, 118–125 CrossRef CAS.
- M. N. Ha, F. Zhu, Z. F. Liu, L. C. Wang, L. Y. Liu, G. Z. Lu and Z. Zhao, RSC Adv., 2016, 6, 21111–21118 RSC.
- D. Yang, Y. Y. Sun, Z. W. Tong, Y. H. Nan and Z. Y. Jiang, J. Hazard. Mater., 2016, 312, 45–54 CrossRef CAS PubMed.
- O. Ruzimuradov, M. Hojamberdiev, C. Fasel and R. Riedel, J. Alloys Compd., 2017, 699, 144–150 CrossRef CAS.
- D. N. Bui, J. Mua, L. Wang, S. Z. Kang and X. Q. Li, Appl. Surf. Sci., 2013, 274, 328–333 CrossRef CAS.
- X. Chen, P. F. Tan, B. H. Zhou, H. G. Dong, J. Pan and X. Xiong, J. Alloys Compd., 2015, 647, 456–462 CrossRef CAS.
- S. Kumar, S. Tonda, A. Baruah, B. Kumarb and V. Shanker, Dalton Trans., 2014, 43, 16105–16114 RSC.
- B. Modak and S. K. Ghosh, J. Phys. Chem. C, 2015, 119, 7215–7224 CAS.
- J. J. Guo, S. X. Ouyang, P. Li, Y. J. Zhang, T. Kakoa and J. H. Ye, Appl. Catal., B, 2013, 134–135, 286–292 CrossRef CAS.
- T. Kanagaraj and S. Thiripuranthagan, Appl. Catal., B, 2017, 207, 218–232 CrossRef CAS.
- Q. Zhang, Y. Huang, S. Q. Peng, Y. F. Zhang, Z. X. Shen, J. J. Cao, W. K. Ho and S. C. Lee, Appl. Catal., B, 2017, 204, 346–357 CrossRef CAS.
- P. Jing, J. L. Du, J. B. Wang, W. Lan, L. N. Pan, J. N. Li, J. W. Wei, D. R. Cao, X. L. Zhang, C. B. Zhao and Q. F. Liu, Nanoscale, 2015, 7, 14738–14746 RSC.
- G. X. Tong, Y. Liu, T. Wu, C. L. Tong and F. F. Du, J. Mater. Chem. C, 2015, 3, 5506–5515 RSC.
- T. Kanagaraj and S. Thiripuranthagan, Appl. Catal., B, 2017, 207, 218–232 CrossRef CAS.
- Z. M. He, Y. M. Xia, B. Tang, X. F. Jiang and J. B. Su, Mater. Lett., 2016, 184, 148–151 CrossRef CAS.
- E. Y. Guo and L. W. Yin, J. Mater. Chem. A, 2015, 3, 13390–13401 CAS.
- H. Y. Zhu, R. Jiang, S. H. Huang, J. Yao, F. Q. Fu and J. B. Li, Ceram. Int., 2015, 41, 11625–11631 CrossRef CAS.
- P. Xiong, Y. Fu, L. Wang and X. Wang, Chem. Eng. J., 2012, 195–196, 149–157 CrossRef CAS.
- Z. Y. Yu, L. F. Chen and S. H. Yu, J. Mater. Chem. A, 2014, 2, 10889–10894 CAS.
- H. S. Kim, D. J. Kim, B. S. Kwak, G. B. Han, M. H. Um and M. Kang, Chem. Eng. J., 2014, 243, 272–279 CrossRef CAS.
- V. Subramanian, R. K. Roeder and E. E. Wolf, Ind. Eng. Chem. Res, 2006, 45, 2187–2193 CrossRef CAS.
- L. J. Di, H. Yang, T. Xian and X. J. Chen, Materials, 2017, 10(1118), 1–11 Search PubMed.
- O. Ruzimuradov and M. Hojamberdiev, J. Alloys Compd., 2017, 699, 144–150 CrossRef CAS.
- L. Wang, Z. J. Wang, D. H. Wang, X. C. Shi, H. Song and X. Q. Gao, Solid State Sci., 2014, 31, 85–90 CrossRef CAS.
- A. Ren, C. B. Liu, Y. Z. Hong, W. D. Shi, S. Lin and P. Li, Chem. Eng. J., 2014, 258, 301–308 CrossRef CAS.
- J. T. Deng, L. Liu, T. J. Niu and X. S. Sun, Appl. Surf. Sci., 2017, 403, 531–539 CrossRef CAS.
- X. Zhao, H. Yang, Z. Cui, R. Li and W. Feng, Mater. Technol., 2017, 32, 870–880 CrossRef.
- Y. Q. Wang, X. F. Cheng, X. T. Meng, H. W. Feng, S. G. Yang and C. Sun, J. Alloys Compd., 2015, 632, 445–449 CrossRef CAS.
- L. Zhang, X. Zhang, Y. Q. Huang, C. L. Pan, J. S. Hu and C. M. Hou, RSC Adv., 2015, 5, 30239–30247 RSC.
- S. F. Wang, H. Yang, T. Xian and X. Q. Liu, Catal. Commun., 2011, 12, 625–628 CrossRef CAS.
- H. Yang, J. X. Zhang, G. J. Lin, T. Xian and J. L. Jiang, Adv. Powder Technol., 2013, 24, 242–245 CrossRef CAS.
- M. Zhang, H. Yang, T. Xian, Z. Q. Wei, J. L. Jiang, Y. C. Feng and X. Q. Liu, J. Alloys Compd., 2011, 509, 809–812 CrossRef CAS.
- F. Wang, H. Yang and Y. C. Zhang, Mater. Sci. Semicond. Process., 2018, 73, 58–66 CrossRef CAS.
- R. He and C. H. Yin, Acta Biomater., 2017, 53, 355–366 CrossRef CAS PubMed.
- T. Xian, H. Yang, L. J. Di and J. F. Dai, J. Alloys Compd., 2015, 622, 1098–1104 CrossRef CAS.
- Q. Wang, Q. J. Guo, L. P. Wang and B. Li, Dalton Trans., 2016, 45, 17748–17758 RSC.
- C. M. Su, J. Hazard. Mater., 2017, 322, 48–84 CrossRef CAS PubMed.
- S. Maiti, S. Pal and K. K. Chattopadhyay, CrystEngComm, 2015, 17, 9264–9295 RSC.
- G. Y. He, J. J. Ding, J. G. Zhang, Q. L. Hao and H. Q. Chen, Ind. Eng. Chem. Res, 2015, 54, 2862–2867 CrossRef CAS.
- T. Xian, H. Yang, J. F. Dai, Z. Q. Wei, J. Y. Ma and W. J. Feng, Mater. Lett., 2011, 65, 1573–1575 CrossRef CAS.
- R. Sharma, S. Bansal and S. Singhal, RSC Adv., 2015, 5, 6006–6018 RSC.
- C. X. Zheng, H. Yang, Z. M. Cui, H. M. Zhang and X. X. Wang, Nanoscale Res. Lett., 2017, 12, 608 CrossRef PubMed.
|
| This journal is © The Royal Society of Chemistry 2018 |
Click here to see how this site uses Cookies. View our privacy policy here.  Open Access Article
 *b,
Yalin Lua,
Bin Tangc,
Shunping Suna,
Jiangbin Su
 c and
Xiaoping Lia


