 Open Access Article
Creative Commons Attribution 3.0 Unported Licence
Study on the corrosion behavior of steel Q315NS heat-affected zone in a HCl solution using electrochemical noise
S. Q. Zhanga,
H. Y. Zhaoa,
F. Y. Shu *a,
G. D. Wangab,
B. Liuc and
B. S. Xud
aShandong Provincial Key Lab of Special Welding Technology, Harbin Institute of Technology, Harbin 150001, China. E-mail: shufengyuanhit@163.com
bState Key Laboratory of Rolling and Automation, Northeastern University, Shenyang 110819, China
cSchool of Materials Science and Engineering, Jiangsu University of Science and Technology, Zhenjiang, 212003, China
dNational Key Laboratory for Remanufacturing, Academy of Armoured Forces Engineering, Beijing 100072, China
First published on 20th December 2017
Abstract
The microstructure and corrosion behavior of a base metal (BM) and heat-affected zone (HAZ) of Q315NS steel in 0.1 mol L−1 HCl solution at 60 °C were investigated with a thermal simulation technique, surface observation and electrochemical measurements. The transient characteristics, as well as the power spectral density (PSD) and wavelet transform, had been employed to analyze the electrochemical noise (EN) data. It was revealed that the microstructure of BM, the fine grained region (FGHAZ) and the inter critical region (ICHAZ) mainly consisted of ferrite and pearlite, while the coarse grained region (CGHAZ) mainly consisted of granular bainite. The corrosion processes of BM, FGHAZ and ICHAZ were similar and characterized by two stages. The first stage involved the metastable pitting process and the second stage corresponded to the pitting corrosion. On the CGHAZ electrode, metastable pitting occurred in the initial corrosion stage and then the corrosion process turned into uniform corrosion. With increasing corrosion time, the corrosion strength of all electrodes decreased significantly at first and then remained constant. The corrosion rate of CGHAZ was slightly lower than the other electrodes in the second corrosion stage, and there was no obvious difference in corrosion rate among BM, FGHAZ and ICHAZ.
1 Introduction
Metallic components in petrochemical and power industries are seriously corroded when corrosive gases (SO3, HCl, NO2, etc.) are cooled and converted to condensed acids on the metal surface, which is defined as dew point corrosion (DPC).1 Corrosion resistant steel Q315NS is much more appropriate for components serving in a DPC environment due to its excellent DPC resistance and low cost. Q315NS is produced by appropriate alloy design, in which Cu and Sb have a significant impact on improving the corrosion resistance.2–5 Cu is capable of enhancing the activity of the cathode, which will promote the passivation of the anode under certain conditions. Thereby the corrosion rate reduces due to the passivation of the anode. In addition, the enrichment of Cu in the corrosion product is able to greatly improve the corrosion protection performance. The Cu2S in the corrosion product can simultaneously prevent the corrosion process in the case of an appropriate amount Sb being contained in the steel. The Sb in steel can increase the electrode potential to inhibit the corrosion process, and the dense Cu2Sb film formed on the surface of the electrode also has an excellent corrosion inhibition performance. However, excessive Sb will reduce the processability of Q315NS because it is in the form of an impurity in the steel.6Q315NS is gradually being used for producing metallic components in electric, metallurgy and petrochemical equipment, such as economizers, air preheaters, chimneys, and furnace walls, etc.7,8 Welding is an essential procedure in the manufacture of metallic components and plays an important role on the microstructure evolution of the heat affected zone (HAZ) which is related to the corrosion process of the HAZ.9–13 The corrosion behavior of the HAZ of Q315NS in a DPC environment is very important to the reliability and safety of equipment which is made from Q315NS. Therefore, it is essential to investigate the corrosion behavior of the HAZ of Q315NS, which can provide an important foundation for optimizing the welding parameters of Q315NS.
H2SO4 corrosion and HCl corrosion are most common in DPC. The corrosion behavior of a base metal (BM) and the HAZ of Q315NS in a H2SO4 solution has been investigated.14 However, the corrosion behavior of Q315NS and the corresponding HAZ in HCl solution is lacking. In this paper, the corrosion behavior of the BM and HAZ of Q315NS in HCl solution was investigated. The electrochemical noise (EN) measurements of the Q315NS and the corresponding HAZ were performed in a 0.1 mol L−1 HCl solution at 60 °C, in coordination with potentiodynamic polarization, EIS and surface observation. The time domain analysis, frequency domain analysis, wavelet transform and noise resistance have been used to interpret the EN data. The HAZ specimens were prepared using the welding thermal simulation method, which is capable of preparing simulated HAZ specimens with a homogeneous microstructure. The aim of this paper is to survey the corrosion processes of the BM and HAZ of Q315NS steel and to reveal the influence of welding thermal cycles on the corrosion behaviors of Q315NS in a 0.1 mol L−1 HCL solution.
2 Experimental
2.1 Welding thermal simulation experiment
The Q315NS steel was used as the BM for the welding thermal simulation processing, which was carried out in a thermal-mechanical physical simulation Gleeble 3800 (Dynamic Systems Inc., USA). The chemical composition of the Q315NS steel, which was determined by the chemical analysis method, is shown in Table 1. The cuboid specimens, with the dimensions of 10 mm × 10 mm × 55 mm, were prepared for the welding thermal simulation experiments. The simulated specimens were heated to peak temperature at the rate of 150 °C s−1, held for 1 s at peak temperature and then cooled down to 300 °C within the given time. The HAZ specimens, including the coarse grained region (CGHAZ), the fine grained region (FGHAZ) and the inter critical region (ICHAZ) were simulated.| Element | C | Si | Mn | S | P | Ni | Mo | Cu | Sb | Fe |
| wt% | 0.06 | 0.27 | 0.87 | 0.02 | 0.01 | 0.11 | 0.10 | 0.31 | 0.09 | Bal. |
In general, the microstructure of the HAZ for steel mainly depends on the peak temperature and cooling rate. Complete austenite transformation occurs in CGHAZ when the peak temperature is significantly higher than the end temperature of austenite transformation (AC3). Complete austenite transformation also occurs in FGHAZ, though the peak temperature is slightly above the AC3. Incomplete austenite transformation occurs in ICHAZ because the specific peak temperature is between AC3 and the start temperature of austenite transformation (AC1).15–17 The AC3 and AC1 were 909 °C and 721 °C respectively, according to the following empirical equation proposed by Andrews:18
| AC1 = 732 − 10.7ωMn − 3.9ωNi + 29ωSi + 16.7ωCr + 290ωAs + 6.38ωW | (1) |
| AC3 = 910 – 230ωC0.5 − 15.2ωNi + 44.7ωSi + 104ωV + 31.5ωMo + 13.1ωW | (2) |
Thus, the peak temperatures of CGHAZ, FGHAZ and ICHAZ were set as 1320 °C, 930 °C and 830 °C, respectively. The heat input of 15 kJ cm−1, which was common in the real welding process, was selected and thus the T8/5 (cooling time from 800 °C to 500 °C) was set as 15 s according to the following empirical equation:19
| T8/5 = Q2δ2F(0.043 − 4.3 × 10⁻⁵ × T0)[1/(500 − T0)2 − 1/(800 − T0)2] | (3) |
After the welding thermal simulation experiments, the middle part of the simulated HAZ specimens were cut down to the size of 10 mm × 10 mm × 6 mm. They were then used as test electrodes in the following electrochemical experiments.
2.2 Electrochemical experiments
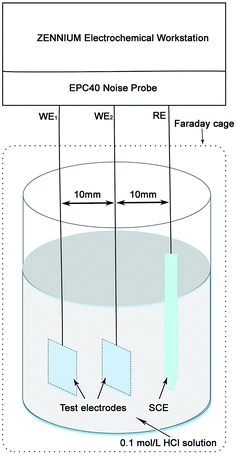
Following the electrical connection with the copper wire, the test electrodes were mounted in epoxy resin. All test electrodes for the electrochemical measurements were finished by grinding with 800 grit silicon carbide (SiC) abrasive paper. Fig. 1 shows the schematic diagram of the EN measurement system. The EN measurements were performed at the open circuit potential (OCP) in the Zennium electrochemistry work station equipped with an EPC40 noise probe set (Zahner elektrik GmbH & Co. KG, Germany). Two identical test electrodes including BM and a simulated HAZ of Q315NS were set as the working electrodes and a saturated calomel electrode (SCE) was set as the reference electrode in the EN measurement system. The EN signals were recorded with the step width of 0.049 s for 10 h. The potentiodynamic polarization and EIS measurements were performed in a Zennium electrochemistry work station with the conventional three electrode electrochemical system, in which BM and the simulated HAZ of Q315NS were set as the working electrodes, a Pt electrode was set as the auxiliary electrode and a SCE was set as the reference electrode. The potentiodynamic polarization curves were measured with the scan rate of 0.5 mV s−1, and the EIS measurements were carried out with the frequency range of 10−1–104 Hz. The area of all the working electrodes and the auxiliary electrode in the electrochemical measurements was 10 mm × 10 mm, and the electrolyte was a 0.1 mol L−1 HCl solution which was prepared by dilution of analytical reagent grade 38 wt% HCl with de-ionized water. All the electrochemical measurements were carried out at the temperature of 60 °C.2.3 Microstructure observation
The BM and simulated HAZ specimens of Q315NS were ground with SiC abrasive paper to 1200 grit and then polished for less than 3 min. All specimens were dried in cool air following ultrasonic cleaning for more than 5 min. The microstructure of the BM and simulated HAZ of Q315NS were observed by Merlin Compact field emission scanning electron microscope (FESEM, ZEISS, Germany) after being etched with an alcohol solution containing 4 vol% HNO3. In addition, the morphology of the BM and simulated HAZ after 10 h corrosion in 0.1 mol L−1 HCl solution were also were observed by FESEM.3 Results and discussion
3.1 Time domain analysis
The DC drift signals were included in the original EN records owing to the instability of the EN measurement system, which has been confirmed as one of the main reasons for analysis errors.20,21 Thus, the moving average (MAR) method proposed by Tan22–24 was used to remove the DC drift before the analysis of the EN records. The transients of EN records have the ability to characterize the corrosion process of electrodes in detail. The EN records of BM and the simulated HAZ electrodes after MAR including electrochemical potential noise (EPN) and electrochemical current noise (ECN) records are shown in Fig. 2 to 5.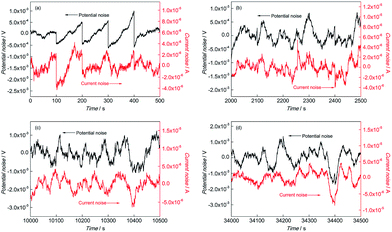 | ||
Fig. 2 EN records of BM during (a) 0–500 s, (b) 2000–2500 s, (c) 10![[thin space (1/6-em)]](https://www.rsc.org/images/entities/char_2009.gif) 000–10 000–10![[thin space (1/6-em)]](https://www.rsc.org/images/entities/char_2009.gif) 500 s and (d) 34 500 s and (d) 34![[thin space (1/6-em)]](https://www.rsc.org/images/entities/char_2009.gif) 000–34 000–34![[thin space (1/6-em)]](https://www.rsc.org/images/entities/char_2009.gif) 500 s in 0.1 mol L−1 HCl solution. 500 s in 0.1 mol L−1 HCl solution. | ||
In the initial corrosion stage of BM, the feature of sudden drop after slow rise could be found periodically in ECN and EPN as shown in Fig. 2(a). The fluctuation amplitudes of EPN and ECN were about 1 mV and 0.4 mA respectively, and the interval time of these fluctuations was about 100 s. It has been reported that the fluctuations of EPN reflect the charge and discharge of the electrode capacitance and the ECN can be considered as the indication of initiation and extinction of pits.25 The slow rise of the ECN and EPN corresponded to the initiation process of the pits and the sudden drop of ECN and EPN indicated the extinction of pits (repassivation). The coexistence of the sudden drop and the slow rise in EN records indicated the competition process of pitting and repassivation, which meant that the metastable pitting occurred on the BM electrode surface. At the later corrosion stage (after 1200 s), there was change in the characteristics of the EN records of BM. As shown in Fig. 2(b) to (d), the sudden drop in ECN and EPN disappeared in this stage, which indicated that the repassivation process no longer exists on the electrode. Instead, both the ECN and EPN were dominated by high frequency fluctuations and a number of large fluctuation, which revealed that the corrosion in this stage was mixed controlled by activation control and diffusion control.26 Generally, anodic dissolution and hydrogen evolution are undertaken on steel. Lots of high frequency fluctuations in ECN records reflected the constant occurrence of pitting, while the large fluctuation might be associated with the evolution of hydrogen. The generation of hydrogen bubbles occurred when hydrogen was adsorbed onto the electrode surface, which prevented the anodic dissolution of the electrode from the corrosive electrolyte. The adsorbed hydrogen bubbles led to the decrease of the anodic dissolution area, which was the cause of the abrupt drop of EN records. The sharp rise of EN records indicated the regression of the anodic dissolution area, which was caused by the desorption of these hydrogen bubbles when they grew up to a certain size. Therefore, the absorption and desorption of hydrogen bubbles caused the periodical transients characterized by sharp and large fluctuations in the EN records.
Fig. 3 shows the EN time records of CGHAZ. In the initial corrosion stage, the fluctuation of EN of CGHAZ showed a similar characteristic as compared with that of BM, as shown in Fig. 3(a). It was indicated that there was no obvious difference between the corrosion process of CGHAZ and BM in the initial corrosion stage. This pattern lasted for about 2100 s, and then the fluctuation characteristic changed: large fluctuations dominated the EN records of CGHAZ. It was implied that the corrosion process in this stage was mainly controlled by the absorption and desorption of hydrogen, which was a typical feature of uniform corrosion.23
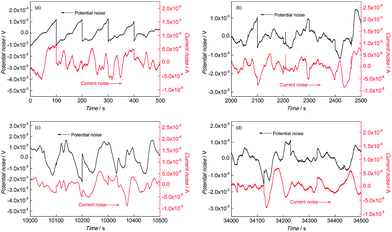 | ||
Fig. 3 EN records of CGHAZ during (a) 0–500 s, (b) 2000–2500 s, (c) 10![[thin space (1/6-em)]](https://www.rsc.org/images/entities/char_2009.gif) 000–10 000–10![[thin space (1/6-em)]](https://www.rsc.org/images/entities/char_2009.gif) 500 s and (d) 34 500 s and (d) 34![[thin space (1/6-em)]](https://www.rsc.org/images/entities/char_2009.gif) 000–34 000–34![[thin space (1/6-em)]](https://www.rsc.org/images/entities/char_2009.gif) 500 s in 0.1 mol L−1 HCl solution. 500 s in 0.1 mol L−1 HCl solution. | ||
Fig. 4 and 5 show the EN time records of FGHAZ and ICHAZ. It seemed that the pitting corrosion occurred after the metastable pitting, according to the transient characteristics of FGHAZ and ICHAZ, which was similar to BM.
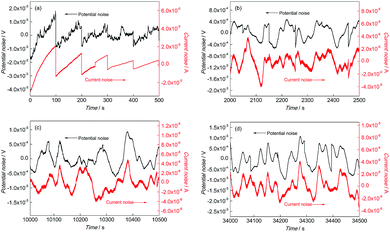 | ||
Fig. 4 EN records of FGHAZ during (a) 0–500 s, (b) 2000–2500 s, (c) 10![[thin space (1/6-em)]](https://www.rsc.org/images/entities/char_2009.gif) 000–10 000–10![[thin space (1/6-em)]](https://www.rsc.org/images/entities/char_2009.gif) 500 s and (d) 34 500 s and (d) 34![[thin space (1/6-em)]](https://www.rsc.org/images/entities/char_2009.gif) 000–34 000–34![[thin space (1/6-em)]](https://www.rsc.org/images/entities/char_2009.gif) 500 s in 0.1 mol L−1 HCl solution. 500 s in 0.1 mol L−1 HCl solution. | ||
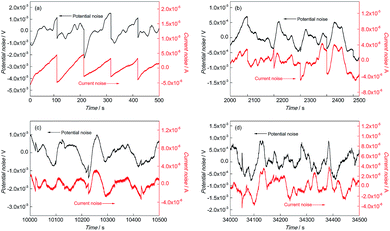 | ||
Fig. 5 EN records of ICHAZ during (a) 0–500 s, (b) 2000–2500 s, (c) 10![[thin space (1/6-em)]](https://www.rsc.org/images/entities/char_2009.gif) 000–10 000–10![[thin space (1/6-em)]](https://www.rsc.org/images/entities/char_2009.gif) 500 s and (d) 34 500 s and (d) 34![[thin space (1/6-em)]](https://www.rsc.org/images/entities/char_2009.gif) 000–34 000–34![[thin space (1/6-em)]](https://www.rsc.org/images/entities/char_2009.gif) 500 s in 0.1 mol L−1 HCl solution. 500 s in 0.1 mol L−1 HCl solution. | ||
3.2 Noise resistance
The noise resistance (Rn) is an important indicator to corrosion resistance. Generally, 1/Rn is proportional to the corrosion rate. Rn can be calculated according to eqn (4) as follows:27| Rn = σv/σi | (4) |
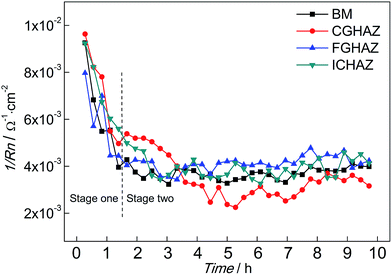
The variations of 1/Rn of BM and simulated HAZ electrodes immersed in 0.1 mol L−1 HCl solution are shown in Fig. 6. Each value of 1/Rn was obtained from calculating EN records of 15 minutes. At the beginning, the 1/Rn of BM exhibited the maximum value, which was about 9.1 × 10⁻³ Ω−1 cm−2. Then the 1/Rn of BM decreased rapidly. The decrease of 1/Rn lasted for about 1 h, then the 1/Rn of BM was almost constant around 4 × 10⁻³ Ω−1 cm−2. The variation of 1/Rn of BM indicated that the corrosion rate decreased firstly and then remained stable, which implied that the corrosion mechanism changed. The variation of 1/Rn of FGHAZ and ICHAZ was similar to that of BM, which indicated that similar corrosion processes occurred. The 1/Rn of CGHAZ also decreased rapidly and then approached a stable value (about 3 × 10⁻³ Ω−1 cm−2). However, there were some differences between CGHAZ and BM in the variation of 1/Rn. Firstly, the falling period of 1/Rn of CGHAZ was longer than that of BM. Secondly, the 1/Rn of FGHAZ was at a slightly lower level than that of BM in the stable period, which meant that the corrosion rate of CGHAZ was lower than BM. It could be presumed that the corrosion process could be divided into two stages: stage one corresponded to the metastable pitting and stage two corresponded to the following pitting corrosion (BM, FGHAZ and ICHAZ) or uniform corrosion (CGHAZ).
3.3 Frequency domain analysis
As one of the most useful frequency domain analysis methods to EN data, the noise power spectral density (PSD) is able to reveal the corrosion mechanism of the electrode. The PSD can be obtained by fast Fourier transform (FFT) and the PSD of EPN is calculated as follows:28
log![[thin space (1/6-em)]](https://www.rsc.org/images/entities/char_2009.gif) PSD = A + K PSD = A + K![[thin space (1/6-em)]](https://www.rsc.org/images/entities/char_2009.gif) log log![[thin space (1/6-em)]](https://www.rsc.org/images/entities/char_2009.gif) f f
| (5) |
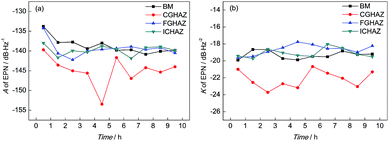
The parameters of the PSD plots including A and K are related to the corrosion process: the more positive the value of K indicates the greater probability to pitting corrosion; the higher the value of A represents more serious corrosion. In other words, the parameters of PSD plots have been proposed as indicators of the corrosion type and the corrosion rate.29,30 The PSD plots of test electrodes after 10 h corrosion are shown in Fig. 7 and the variations of PSD parameters of the test electrodes are shown in Fig. 8.
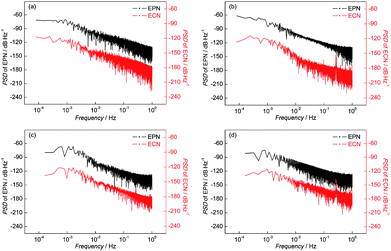 | ||
| Fig. 7 PSD plots of (a) BM, (b) CGHAZ, (c) FGHAZ and (d) ICHAZ after 9 h corrosion in a 0.1 mol L−1 HCl solution. | ||
It can be found from Fig. 8 that the value of A of BM decreased slightly and then remained stable, which indicated that the corrosion strength of BM in the initial corrosion stage was the highest and then approached a stable level. In addition, the value of K of BM was steady with increasing time indicating that the probability of pitting corrosion on BM didn't change significantly. The parameters of the PSD plots of FGHAZ and ICHAZ were similar to that of BM, which indicated that the FGHAZ and ICHAZ underwent a similar corrosion process to BM.
On the CGHAZ electrode, the value of A of CGHAZ decreased firstly and then showed small fluctuations around a certain value, which indicated that the corrosion strength of CGHAZ approached stability after the decrease in the initial corrosion stage. Then K of CGHAZ fluctuated around a certain value. More importantly, the value of K of CGHAZ was smaller than that of BM, which meant that the probability of pitting corrosion of CGHAZ was lower than that of BM.
The indices including Se and Sg were proposed by Zhang31,32 to evaluate corrosion behavior and deduced by dimensional analysis of the PSD parameters. The indices Se and Sg can be calculated according to the equations as follows:
| Se = fc2K1/2 | (6) |
| Sg = Wfc−1K−1 | (7) |
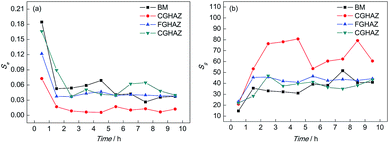
Table 2 shows the PSD parameters of the test electrodes after different corrosion times while Fig. 9 shows the variations of Se and Sg with time when immersed in a 0.1 mol L−1 HCl solution. It can be found that the Se of the BM electrode decreased considerably firstly and then became stable. The variation of Se for BM indicated that the pitting strength was the greatest at the beginning, then reduced and remained stable. Meanwhile, the Sg of the BM electrode increased in the first 1 h and then remained steady, which meant that the strength of the slow corrosion process increased in the initial corrosion stage. It could be implied that the pitting strength of CGHAZ reduced in the initial corrosion stage and then remained stable according to the variation of Se of CGHAZ. However, the value of Se for BM was higher than CGHAZ throughout the corrosion process, which meant that the pitting corrosion strength of BM was stronger. The Sg value of CGHAZ presented a larger fluctuation. Much of the instability seemed to result from the discontinuity of the adsorption and deposition. In addition, the value of Sg for CGHAZ was obviously higher than that of BM, which indicated that the strength of the slow corrosion process was greater than that of BM.
| Electrodes | Time (h) | fc (dB/Hz) | K (dB/Hz2) | W (dB/Hz) | Sg | Se |
|---|---|---|---|---|---|---|
| BM | 0 | 0.2034 | 19.92 | 59.80 | 0.1846 | 14.76 |
| 3 | 0.1154 | 19.72 | 73.51 | 0.0591 | 32.31 | |
| 6 | 0.0978 | 19.52 | 73.01 | 0.0423 | 38.23 | |
| 9 | 0.0926 | 19.20 | 72.97 | 0.0376 | 41.06 | |
| CGHAZ | 0 | 0.1259 | 21.00 | 55.56 | 0.0726 | 21.02 |
| 3 | 0.0368 | 22.71 | 65.33 | 0.0065 | 78.14 | |
| 6 | 0.0477 | 21.46 | 61.91 | 0.0106 | 60.44 | |
| 9 | 0.0518 | 21.31 | 66.78 | 0.0124 | 60.51 | |
| FGHAZ | 0 | 0.1656 | 19.61 | 75.99 | 0.1217 | 23.37 |
| 3 | 0.1006 | 18.45 | 78.11 | 0.0434 | 42.10 | |
| 6 | 0.0972 | 18.56 | 76.78 | 0.0407 | 42.58 | |
| 9 | 0.0946 | 18.24 | 76.51 | 0.0383 | 44.32 | |
| ICHAZ | 0 | 0.1942 | 19.43 | 83.34 | 0.1662 | 22.09 |
| 3 | 0.1077 | 19.05 | 77.11 | 0.0507 | 37.56 | |
| 6 | 0.1210 | 18.04 | 79.40 | 0.0622 | 36.37 | |
| 9 | 0.0953 | 19.51 | 80.66 | 0.0401 | 43.40 |
3.4 Wavelet transform
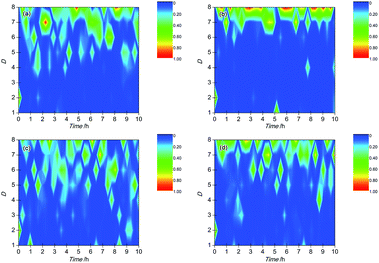
Wavelet transform (WT) is a mathematical method to discriminate and classify continuous signals and has been widely employed to analyze EN signals recently due to its ability to reveal information on the dominant corrosion process.33,34 The independent corrosion events in the corrosion process are reflected by a series of wavelet energy, which contained the feature information about the time scale of the corrosion events: a smaller time scale of corrosion event corresponded to a faster corrosion process. Therefore, the greatest energy distribution in an energy distribution plot (EDP) represented the dominant corrosion events. In general, the energy distribution in crystals D1–D3, D4–D6 and D7–D8 reflects the corrosion information about the metastable pitting, pitting and slow frequency process when the crystals are ranged from D1 to D8.35–38 For steel, the slow frequency process is usually related to oxygen diffusion and adsorption of hydrogen, which is an important feature of uniform corrosion. The EDPs of BM and the simulated HAZ specimens are shown in Fig. 10.As shown in Fig. 10(a), it can be concluded that the wavelet energy was mainly dominated by the fast frequency energy (in the crystal D1) on the BM electrode at the beginning of corrosion, which meant that the metastable pitting mainly dominated the corrosion process of BM in this corrosion stage. About 0.5 h later, the wavelet energy was mainly accumulated in the crystals D4–D8, which might reflect the coexistence of the pitting corrosion and slow frequency process. It was indicated that the pitting and diffusion/adsorption occurred at the same time on the BM electrode. Fig. 10(b) shows the EDP of CGHAZ. It can be observed that the wavelet energy distribution was mainly accumulated in the crystal of D1 at the beginning and then changed into the crystals of D7–D8. It could be expected that the electrode surface of CGHAZ was mainly dominated by metastable pitting at the beginning and then turned into a slow frequency process. It could be demonstrated that the metastable pitting occurred on the surface of CGHAZ at first and then turned into uniform corrosion. FGHAZ and ICHAZ underwent a similar corrosion process to BM as indicated by the similar wavelet energy distribution to BM as shown in Fig. 10(c) and (d).
3.5 Potentiodynamic polarization and EIS
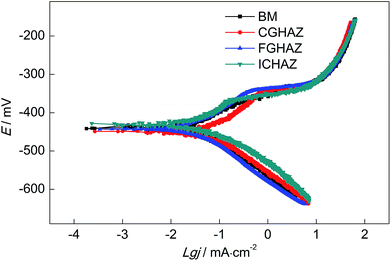
It has been reported that the EN technique is a very useful method to analyze the corrosion behavior, in particular when it is used in coordination with other electrochemical techniques such as potentiodynamic polarization, EIS and so on.39–42 cathode polarization curves of all test electrodes, which indicated that all the electrodes underwent a similar cathodic polarization process. The anode current density decreased continuously with the increasing of potential, which Fig. 11 shows the potentiodynamic polarization curves of BM, CGHAZ, FGHAZ and ICHAZ in a 0.1 mol L−1 HCl solution. It can be seen that there were no significant differences in the reflected the active dissolution of electrode. All the anodic polarization curves showed no characteristics of passivation. However, the slope of anodic polarization curves of CGHAZ, FGHAZ and ICHAZ were bigger than that of BM, which implied that the welding thermal cycle affected the anodic polarization process.The electrochemical parameters of the potentiodynamic polarization curves including corrosion potential Ecorr, corrosion current density icorr, anodic Tafel slopes βa, cathodic Tafel slopes βc and corrosion rate V are shown in Table 3, which were calculated by the Tafel Curve Fitting method proposed by Cao.43 It can be found that the Ecorr of CGHAZ was the lowest and the CGHAZ has the highest icorr, while the Ecorr and icorr of the other electrodes were almost at the same level. This might be due to the difference in the anodic polarization process between CGHAZ and the others. The CGHAZ showed the lowest corrosion rate while the corrosion rate of the others were almost the same according to the electrochemical parameters as presented in Table 3.
| Electrodes | Ecorr (mV) | icorr (μA cm−2) | βa (mV dec−1) | βc (mV dec−1) | V (mm per year) |
|---|---|---|---|---|---|
| BM | −432 | 33.7 | 42.6 | 93.6 | 0.393 |
| CGHAZ | −446 | 29.7 | 67.5 | 92.2 | 0.346 |
| FGHAZ | −437 | 37.2 | 57.8 | 93.4 | 0.434 |
| ICHAZ | −427 | 35.4 | 49.6 | 93.9 | 0.413 |
Fig. 12 shows the Nyquist plots of the test electrodes after different corrosion times in a 0.1 mol L−1 HCl solution. It can be observed that the Nyquist plots of all test electrodes showed one capacitive arc in a high frequency region, which suggested that the corrosion rate was mainly determined by the charge transfer process. The diameter of Nyquist plots of all test electrodes increased with increasing corrosion time, which implied that the corrosion resistance increased over time. In addition, the Nyquist plots of the CGHAZ electrode showed the greatest diameter, which meant that the corrosion resistance of CGHAZ was the greatest. The diameters of Nyquist plots of BM, FGHAZ and ICHAZ were almost at the same value indicating that corrosion resistance of these electrodes was nearly the same.
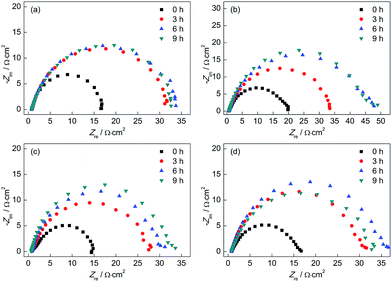 | ||
| Fig. 12 Nyquist plots of (a) BM, (b) CGHAZ, (c) FGHAZ and (d) ICHAZ after different corrosion times in a 0.1 mol L−1 HCl solution. | ||
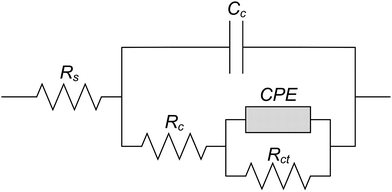
Fig. 13 shows the equivalent circuit to simulate the liquid/solid interface. Rct, Rc and Rs represents the charge transfer resistance, the resistance to corrosion product and the solution resistance, respectively. Cc represented the corrosion product capacitance while the Constant Phase Element (CPE) referred to the double layer at the interface of the electrolyte and electrode.44–47 Table 4 shows the parameters calculated by EIS based on the equivalent circuit as shown in Fig. 13. The Rct of all the test electrodes was higher than Rc and Rs, which suggested that the corrosion processes of all test electrodes were mainly controlled by the charge transfer process in the 0.1 mol L−1 HCl solution.47,48 The Rct of all the test electrodes increased in the first 3 h and then showed no obvious change in the later corrosion stage, which meant the inhibiting effect on the charge transfer was enhanced in the initial corrosion stage and then became steady. It was implied that there might be differences in the corrosion process between the initial corrosion stage and later corrosion stage on the test electrodes. In addition, the Rct of CGHAZ was larger than that of the other electrodes. It could be presumed that the CGHAZ electrode showed a larger charge transfer resistance than the other electrodes.
| Electrodes | Corrosion time (h) | Rs (Ω cm2) | Cc (μF) | Rc (Ω cm2) | CPE | Rct (Ω cm2) | |
|---|---|---|---|---|---|---|---|
| Y (S sn cm−2) | N | ||||||
| BM | 0 | 0.7942 | 417.1 | 0.5753 | 1.464 × 10⁻³ | 0.823 | 15.66 |
| 3 | 0.8181 | 124.6 | 0.5760 | 1.001 × 10⁻³ | 0.777 | 30.88 | |
| 6 | 0.7327 | 137.3 | 0.4751 | 1.254 × 10⁻³ | 0.748 | 34.50 | |
| 9 | 0.7998 | 178.2 | 0.8595 | 1.313 × 10⁻³ | 0.753 | 32.66 | |
| CGHAZ | 0 | 0.7050 | 147.7 | 0.9751 | 1.514 × 10⁻³ | 0.736 | 18.16 |
| 3 | 0.7323 | 136.7 | 0.4779 | 1.218 × 10⁻³ | 0.753 | 33.85 | |
| 6 | 0.6848 | 139.1 | 0.9208 | 1.153 × 10⁻³ | 0.737 | 45.68 | |
| 9 | 0.6948 | 138.1 | 1.0192 | 1.010 × 10⁻³ | 0.752 | 44.92 | |
| FGHAZ | 0 | 0.8594 | 193.2 | 1.1869 | 3.245 × 10⁻³ | 0.787 | 12.96 |
| 3 | 0.8450 | 161.3 | 0.9572 | 1.574 × 10⁻³ | 0.754 | 25.44 | |
| 6 | 0.8025 | 265.3 | 1.0612 | 1.349 × 10⁻³ | 0.788 | 27.78 | |
| 9 | 0.6889 | 312.1 | 0.9087 | 1.015 × 10⁻³ | 0.811 | 29.85 | |
| ICHAZ | 0 | 0.8095 | 225.4 | 0.8838 | 3.045 × 10⁻³ | 0.713 | 14.64 |
| 3 | 0.7528 | 195.7 | 1.0755 | 1.055 × 10⁻³ | 0.776 | 29.19 | |
| 6 | 0.7506 | 168.2 | 1.2441 | 9.078 × 10⁻⁴ | 0.776 | 33.95 | |
| 9 | 0.7614 | 132.9 | 1.1039 | 1.349 × 10⁻³ | 0.749 | 31.45 | |
3.6 Surface observation
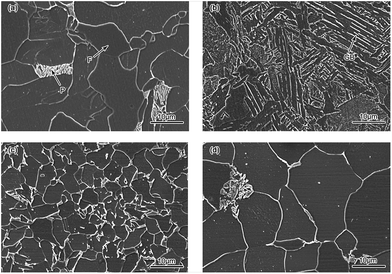
Fig. 14 shows the SEM images of BM, CGHAZ, FGHAZ and ICHAZ of Q315NS. It can be observed from Fig. 14(a) that the BM of Q315NS mainly consisted of a polygonal ferrite (F) phase and pearlite (P) phase. The granular bainite (GB) with coarse grain boundaries could been found in the CGHAZ as shown in Fig. 14(b). The microstructure of GB consisted of bainitic ferrite matrix and the martensite/austenite phase (as the second phase).49 Both FGHAZ and ICHAZ consisted of F and P. During the heating process of FGHAZ and ICHAZ, austenite transformation occurred when the HAZ was heated to AC1. Then the austenite was transformed to F and P in the cooling process, which resulted in the microstructure of FGHAZ and ICHAZ as shown in Fig. 14(c) and (d).It could be found that the grain size of CGHAZ was larger than that of BM, FGHAZ and ICHAZ. Usually the austenite grain size increases with peak temperature because the higher temperature will bring about a larger diffusion rate.50 As a result, the CGHAZ had the largest grain size due to the highest peak temperature. The grain of FGHAZ was further refined due to the fast cooling rate when the austenite transformed to F and P. Thus, the grain size of FGHAZ was smaller than that of BM while the grain size of ICHAZ was similar to that of BM.
The SEM images of BM and simulated HAZ after 10 h corrosion in a 0.1 mol L−1 HCl solution are shown in Fig. 15. It can be found that some pits appeared mainly on the pearlite region of BM as shown in Fig. 15(a), which demonstrated that the pitting corrosion occurred. However, there were no obvious pits on the ferrite region, which might be because the pearlite was corroded prior to this. Eventually, the pitting corrosion mainly occurred on the pearlite region of BM. The FGHAZ and ICHAZ seemed to undergo the similar corrosion process to BM according to the similar corrosion morphologies, which are shown in Fig. 15(c) and (d), respectively. As shown in Fig. 15(b), there were no obvious pits formed on the surface of CGHAZ, which showed typical uniform corrosion. This might be due to the homogeneity of the microstructure of CGHAZ. There was no obvious oxide film formed on the surface of all test electrodes, which indicated that no passivation occurred. From the surface corrosion morphology of the test electrodes as shown in Fig. 15, we arrived at the conclusion that pitting corrosion occurred at BM, FGHAZ and ICHAZ, while CGHAZ was mainly dominated by uniform corrosion.
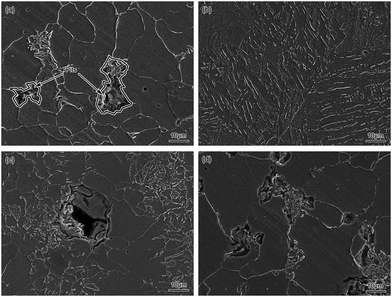 | ||
| Fig. 15 SEM images of (a) BM, (b) CGHAZ, (c) FGHAZ and (d) ICHAZ after 10 h corrosion in a 0.1 mol L−1 HCl solution. | ||
4 Conclusion
The corrosion processes of BM and the simulated HAZ of Q315NS steel in a 0.1 mol L−1 HCl solution at 60 °C were investigated by EN, potentiodynamic polarization, EIS and surface observation. The main conclusions are as follows:(1) The corrosion process of BM of Q315NS could be divided into two stages: the initial metastable pitting stage and the following pitting corrosion stage. The pitting corrosion was owing to the existence of pearlite which was corroded previously. The FGHAZ and ICHAZ of Q315NS showed nearly the same corrosion process as BM due to the similar microstructure.
(2) Two corrosion stages could be clearly distinguished as the initial metastable pitting stage and the uniform corrosion stage in the corrosion process of CGHAZ. The corrosion process of CGHAZ was mainly dominated by oxygen diffusion and adsorption of hydrogen in the uniform corrosion stage.
(3) With increasing time, the corrosion strength of BM, CGHAZ, FGHAZ and ICHAZ of Q315NS remained constant after a significant decrease. The corrosion rate of CGHAZ was slightly lower than that of the other electrodes, and there was no obvious difference in the corrosion rate among BM, FGHAZ and ICHAZ.
Conflicts of interest
There are no conflicts to declare.Acknowledgements
The authors are grateful for the financial support of the Natural Scientific Research Innovation Foundation in the Harbin Institute of Technology (No. HIT.NSRIF.201703) and the Shandong Provincial Natural Science Foundation of China (No. ZR2016EEQ03).References
- Y. G. Yang, T. Zhang, Y. W. Shao, G. Z. Meng and F. H. Wang, Corros. Sci., 2013, 71, 62–71 CrossRef CAS.
- D. P. Le, W. S. Ji, J. G. Kim, K. J. Jeong and S. H. Lee, Corros. Sci., 2008, 50, 1195–1204 CrossRef CAS.
- W. Zhang, Y. P. Ma and Y. G. Liu, Anhui Metall., 2009, 3, 25–27 Search PubMed.
- I. Matsushima, Low Alloy Corrosion Resistant Steel-A History of Development Application and Research, Metallurgical Industry Press, Beijing, 2004 Search PubMed.
- X. X. Ye, C. Zhou and C. Zhang, Corros. Sci. Prot. Technol., 2015, 27, 135–140 Search PubMed.
- Y. H. Qian, Z. G. Li and A. N. Yang, Spec. Steel, 2005, 26, 30–34 Search PubMed.
- Z. Y. Liang and Q. X. Zhao, Eng. Failure Anal., 2013, 28, 208–214 CrossRef CAS.
- H. Cai, Ind. Boil., 2005, 5, 22–25 Search PubMed.
- J. Verma and R. V. Taiwade, J. Manuf. Process, 2016, 14, 1–10 Search PubMed.
- J. S. Wei, Y. C. Qi, Z. L. Tian and Y. Peng, J. Iron Steel Res. Int., 2016, 23, 955–962 CrossRef.
- L. J. Dong, Q. J. Peng, E. H. Han, W. Ke and L. Wang, Corros. Sci., 2016, 107, 172–181 CrossRef CAS.
- H. L. Ming, Z. M. Zhang, P. Y. Xiu, J. Q. Wang, E. H. Han, W. Ke and M. X. Su, Acta Metall. Sin., 2016, 26, 848–858 CrossRef.
- S. R. Reza, Opt. Laser Technol., 2016, 82, 113–120 Search PubMed.
- S. Q. Zhang, H. Y. Zhao, F. Y. Shu, W. X. He and G. D. Wang, Metals, 2017, 7, 194–206 CrossRef.
- X. H. Yu, J. L. Caron, S. S. Babu, J. C. Lippold, D. Isheim and D. N. Seidman, Acta Mater., 2010, 58, 5596–5609 CrossRef CAS.
- J. Hu, L. X. Du, H. Xie, F. T. Dong and R. D. K. Misra, Mater. Des., 2014, 60, 302–309 CrossRef CAS.
- Y. Y. Wang, R. Kannan and L. J. Li, Mater. Charact., 2016, 118, 225–234 CrossRef CAS.
- F. Hayat and H. Uzun, J. Iron Steel Res. Int., 2011, 18, 65–72 CrossRef CAS.
- W. Y. Zhang, Welding Metallurgy (Basic Principle), China Machine Press, Beijing, 2014 Search PubMed.
- R. A. Cottis, Corrosion, 2001, 57, 265–285 CrossRef CAS.
- W. Liu, G. W. Sun, C. B. Li, X. F. Li, R. Liu, Q. Qiu and W. Yang, Corros. Prot., 2016, 37, 609–612 Search PubMed.
- Y. J. Tan, S. Bailey and B. Kinsella, Corros. Sci., 1996, 38, 1681–1695 CrossRef CAS.
- F. Mansfeld, Z. Sun and C. H. Hsu, Electrochim. Acta, 2001, 46, 3651–3664 CrossRef CAS.
- U. Bertocci, F. Huet, P. Rousseau and R. P. Nogueira, Corrosion, 2002, 58, 337–347 CrossRef CAS.
- Y. F. Cheng, M. Wilmott and J. L. Luo, Corros. Sci., 1999, 41, 1245–1256 CrossRef CAS.
- M. J. Bahrami, M. Shahidi and S. M. A. Hosseini, Electrochim. Acta, 2014, 148, 127–144 CrossRef CAS.
- J. F. Chen and W. F. Bogaerts, Corros. Sci., 1995, 37, 1839–1842 CrossRef CAS.
- L. Liu, Y. Li and F. H. Wang, Electrochim. Acta, 2008, 54, 768–780 CrossRef CAS.
- Y. F. Cheng, B. R. Rairdan and J. L. Luo, J. Appl. Electrochem., 1998, 28, 1371–1375 CrossRef CAS.
- Z. Zhang, J. Q. Zhang, J. M. Wang and N. C. Chu, Chin. J. of Nonferrous Met., 2001, 11, 284–287 CAS.
- Y. Y. Shi, Z. Zhang, F. H. Cao and J. Q. Zhang, Electrochim. Acta, 2008, 53, 2688–26987 CrossRef CAS.
- Z. Zhang, J. Q. Zhang, J. F. Li, J. M. Wang and C. N. Cao, Acta Phys.-Chim. Sin., 2001, 17, 651–654 CAS.
- A. Aballe, M. Bethencourt, F. J. Botana and M. Marcos, Electrochim. Acta, 1999, 44, 4805–4816 CrossRef CAS.
- P. Planinsic and A. Petek, Electrochim. Acta, 2008, 53, 5206–5214 CrossRef CAS.
- A. M. Homborg, T. Tinga, X. Zhang, E. P. M. V. Westing, P. J. Oonincx, G. M. Ferrari, J. H. W. D. Wit and J. M. C. Mol, Electrochim. Acta, 2013, 104, 84–93 CrossRef CAS.
- M. J. Bahrami, M. Shahidi and S. M. A. Hosseini, Electrochim. Acta, 2014, 148, 127–144 CrossRef CAS.
- F. H. Cao, Z. Zhang, J. X. Su, Y. Y. Shi and J. Q. Zhang, Electrochim. Acta, 2006, 51, 1359–1364 CrossRef CAS.
- L. J. Zhang, Z. Zhang and J. Q. Zhang, Acta Phys.-Chim. Sin., 2008, 24, 1831–1838 CAS.
- H. A. Sorkhabi, D. Seifzadeh and M. R. Boroujeni, Arabian J. Chem., 2016, 9, S1320–S1327 CrossRef.
- J. Mojica, E. García, F. J. Rodríguez and J. Genescá, Prog. Org. Coat., 2001, 42, 218–225 CrossRef CAS.
- M. G. Pujar, N. Parvathavarthini, R. K. Dayal and S. Thirunavukkarasu, Corros. Sci., 2009, 51, 1707–1713 CrossRef CAS.
- A. Ehsani, M. G. Mahjani, M. Hosseini, R. Safaria, R. Moshrefi and H. M. Shiri, J. Colloid Interface Sci., 2017, 490, 444–451 CrossRef CAS PubMed.
- C. N. Cao, Principles of Electrochemistry of Corrosion, Chemical Industry Press, Beijing, 3rd edn, 2008 Search PubMed.
- X. X. Wang, Y. M. Gao, K. Li, J. B. Yan, Y. F. Li and J. B. Feng, Corros. Sci., 2013, 69, 369–375 CrossRef CAS.
- X. X. Wang, Y. M. Gao, Y. F. Li and T. Yang, Corros. Sci., 2014, 87, 211–217 CrossRef CAS.
- K. Jüttner, Electrochim. Acta, 1990, 35, 1501–1508 CrossRef.
- Q. B. Zhang and Y. X. Hua, Electrochim. Acta, 2009, 54, 1881–1887 CrossRef CAS.
- M. E. Achouri, S. Kertit, H. M. Gouttaya, B. Nciri, Y. Bensouda, L. Perez, M. R. Infante and K. Elkacemi, Prog. Org. Coat., 2001, 43, 267–273 CrossRef.
- Z. Q. Cui and B. X. Liu, Metallurgy and Treatment Theory, Harbin Institute of Technology Press, Harbin, 3rd edn, 2007 Search PubMed.
- J. Moon, J. Lee and C. Lee, Mater. Sci. Eng., A, 2007, 459, 40–46 CrossRef.
| This journal is © The Royal Society of Chemistry 2018 |

