 Open Access Article
A rapid and simple UPLC-MS/MS method using collagen marker peptides for identification of porcine gelatin
Shangwei Guoab,
Xiaobing Xua,
Xiangshan Zhoub and
Yaqin Huang *a
*a
aBeijing Laboratory of Biomedical Materials, Beijing University of Chemical Technology, Beijing 100029, China. E-mail: huangyq@mail.buct.edu.cn
bDong'e E-jiao Co., Ltd, National Engineering Research Center for Gelatine TCM, Liaocheng 252201, China
First published on 19th January 2018
Abstract
Gelatin, which is mainly derived from bovine and porcine sources, has been used in many foods and pharmaceutical products. To ensure the compliance of food products with halal regulations, reliable analytical methods are very much required. In this study, one unique marker peptide for porcine gelatins was selected to develop an UPLC-MS/MS multiple reaction monitoring method. The capability of this method to identify porcine materials was demonstrated by analyzing in-house-made gelatins containing different amounts of porcine gelatins and commercial gelatin products. The adulteration of porcine gelatin could be sensitively detected at a low level of 0.04%. When combined with HPLC and mass spectrometry, this method is an accurate and sensitive quantitative method to identify porcine gelatins. Thus, the strategy can be used to verify halal authenticity of gelatin.
Introduction
Gelatin is a mixture of polypeptides obtained by the selective hydrolysis of collagen, which is the main protein in the skin, hides, white connective tissues, and bones of animals. Gelatin is widely used in food, cosmetic and pharmaceutical industries because of its distinctive advantages, such as biodegradability, non-toxicity, biocompatibility and low cost.1–3 And gelatin can be used as an additive in innumerable food products, such as gummy candies, canned ham, various luncheon meals, corned beef, chicken rolls, jellied beef, margarine, sour cream and cottage cheese.4,5Porcine gelatin is the most widely used ingredient in production of processed foods. But in Islamic countries, porcine gelatin is forbidden.6,7 However, the food industry and mass market globalization might allow for cheaper or prohibited ingredients to be used and consequently mislabeling, fraudulent substitution or deceptive labeling can occur.8 The best way to ensure the “Muslim” of the final food products is to control the raw materials of food processing. To ensure the compliance of food products with halal regulations and the quality and safety of food, a sensitive and reliable analytical approach is urgently needed to identify and distinguish the animal source of gelatin.
The large similarity in structure and properties of gelatin from different origins makes it difficult to distinguish them by conventional spectroscopic methods. Immunochemical methods have been used to identify the species origin of gelatins.8 However, the immunochemical method may be affected by the degree of proline hydroxylation, which is important in determining the antigenicity of collagen.9,10 With high sensitivity and high taxonomic specificity, polymerase chain reaction (PCR), which is associated with DNA, has been commonly used to track the source of an animal product or detect the possible contamination of other animal tissues.11,12 Yet DNA integrity is destroyed during gelatin processing.13,14
In contrast to DNA, the amino acid sequence of protein is highly consistent in the processing of gelatin. The characteristic amino acid sequence of collagen is a repeating G–X–Y sequence, where G is glycine, and X and Y mostly are proline and hydroxyproline, respectively.15 This characteristic amino acid sequence has been used for identification of the animal source for gelatin by mass spectrometric detection of marker peptides after trypsin digestion.16,17 For example, collagen marker peptides, combined with sequence search, can distinguish bovine and porcine gelatin.18,19 In addition, Grundy et al.20 reported a method for determining the species of origin of gelatin in foods and pharmaceutical products using LC-MS/MS technique. Sarah et al.21 found four peptides (EVTEFAK, LVVITAGAR, FVIER and TVLGNFAAFVQK) were consistently detected in cooked pork meat using MRM techniques. Yilmaz et al.22 presented a novel nanoUPLC-ESI-qTOF-MSE workflow technique that has the potential to identify the origin of gelatin in some dairy products such as yoghurt, cheese and ice cream. However, an accurate and sensitive method is necessary to not only identify but also quantify porcine gelatins to solve the problems like mislabeling the source and content of porcine gelatins. Sha et al.23 established a method by combining trypsin-catalyzed 18O labeling and high-resolution mass spectrometry to quantify the bovine or porcine gelatins.
To make the analytical method simple and precise, in this study, we use marker peptides detected by UPLC-MS/MS in MRM mode to develop a new analytical method that allowed us to identify and quantify porcine gelatin content. Moreover, in-house-made and commercial gelatins were analyzed for the selected marker porcine peptide. Our results clearly demonstrated that this method is a very useful and effective technique for halal authentication of commercial pure gelatin and gelatin-containing processed food products.
Experimental method
Chemicals and reagents
Trypsin (sequencing grade) was obtained from Promega (Fitchburg, WI, USA). Formic acid, acetonitrile (Ultra-performance liquid chromatography [UPLC]-grade), were purchased from Thermo Fisher Scientific (Waltham, MA, USA). Ultra high purity water was prepared using a Milli-Q water purification system (Millipore Corporation, Bedford, MA). Syringe filters (0.22 μm) were purchased from Millipore (Billerica, MA, USA). All other chemicals and reagents were of the highest grade available. Porcine marker peptide standards were synthesized by Jill Biochemical Co., Ltd. (Shanghai, People's Republic of China). Gelatin samples were prepared in the laboratory.Sample preparation
First, 50 mg of the gelatin standard was dissolved in 25 mL of a 1% NH4HCO3 solution (pH 8.0). The solution was filtered through a 0.22 μm syringe filter. Then, 200 μL of the gelatin solution was drawn, and 10 μL of trypsin solution (1 mg mL−1 in 1% NH4HCO3, pH 8.0) was added. The mixture was incubated at 37 °C for 12 h.Chromatographic separation
The UPLC analysis was performed using a Agilent 1290 Infinity Ultra Performance LC system. Chromatographic separation was carried out on an ACQUITY UPLC BEH C18 column (100 mm × 2.1 mm, 1.7 μm) at a column temperature of 45 °C. The mobile phase consisted of solvent A (0.1% formic acid in acetonitrile, v/v) and solvent B (0.1% formic acid in water, v/v). The optimized UPLC elution conditions were as follows: 0.0–25.0 min, 5–17% B; 25.0–26.0 min, 17–99% B; 26–35 min, 99% B → 99% B; 35–36 min, 99% B → 2% B; 36–45 min, 2% B. The flow rate was set at 300 μL min−1. The injection volume was 5 μL.Mass spectrometry
Mass spectrometry was performed on a Thermo Scientific™ TSQ Quantum Access Max Triple Quadrupole Mass Spectrometer (with Electrospray Ionization Source HESI). The MS scan were performed over m/z ranges of 200–1500. For positive electrospray modes, the spray voltage was set at 3.2 kV. The pressure of the sheath gas (N2), auxiliary gas (Aux gas, N2) and collision (Ar) were set to 40 au (arbitrary units), 5 au and 1.5 mTorr. The temperature of transmission capillary was set to 300 °C.MRM analysis of marker peptides
Marker peptides were monitored by LC-MS/MS in MRM mode. The sample solution was loaded onto an BEH C18 column (100 mm × 2.1 mm, 1.7 μm) at a flow rate of 300 μL min−1. Mobile phase A was 0.1% formic acid in acetonitrile, and mobile phase B was 0.1% formic acid in water. Quantitations were performed in multiple reaction monitoring (MRM) mode at 3.2 kV multiplier voltage, and the following MRM transitions of [M + 2H]2+ precursor ions → product ions were selected for the marker peptides and the relative collision energies optimized by the Quantum Tune Master® software:| m/z 473.0 → 586.1 + 717.2 (collision energy, 26 eV) |
| m/z 774.3 → 977.8 + 809.3 (collision energy, 30 eV) |
| m/z 926.0 → 833.1 + 1012.5 (collision energy, 35 eV) |
Database searching
Collagen sequences, including both COL1A1 and COL1A2 from horse, cattle, sheep, tilapia and pig, were downloaded from the National Center for Biotechnology Information (NCBI) website (https://www.ncbi.nlm.nih.gov/protein/, GI: 953866084, 149705490, 75775290, 151555719, 965959815, 426227338, 359804080, 359804082, 1159729721 and 1159729723), which constituted the database we built. The protein sequences from different animal species were compared using the BioEdit Sequence Alignment Editor software.Results and discussion
Study design
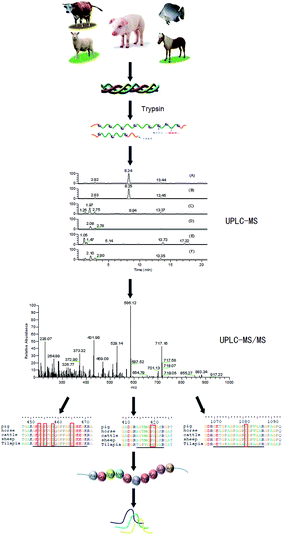
A highly sensitive UPLC-MS/MS multiple reaction monitoring strategy was developed, as presented in Fig. 1. First, a variety of gelatins on trypsin digestion were detected by mass spectrometry. Next, marker peptides representing porcine gelatin was selected. Then the suitability for identifying porcine gelatins and detecting possible adulteration was evaluated by MRM.UPLC-MS analysis of the digested gelatins
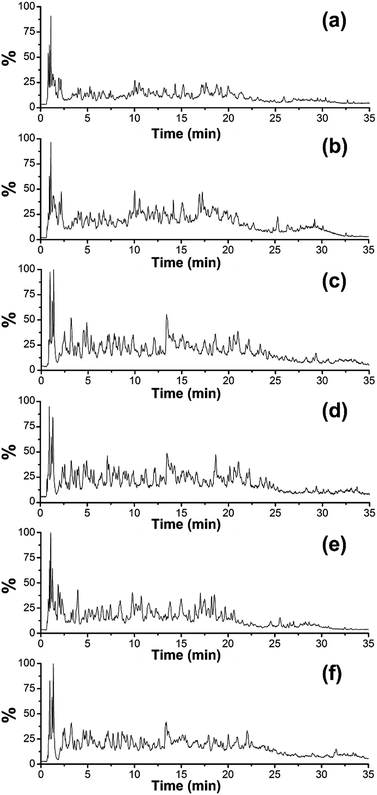
Fig. 2 shows the total ion chromatograms (TIC) of the five gelatins digested at 37 °C for 12 h with scan range of m/z 200–1500. The elution profiles indicate that the retention time scale of the peptides in the digested porcine gelatins are similar to that of the peptides in the other digested gelatins. This might result from the high protein homology among the herbivorous mammals. Peptides in the digested samples generally show similar hydrophobicity/hydrophilicity due to the high content of glycine and proline.10,19 It is difficult to distinguish each gelatin by visual observation of their chromatograms, therefore, we get EIC (Extracted Ion Chromatogram) from scan range of m/z 200–1500 to further analysis.Selection of the marker peptide
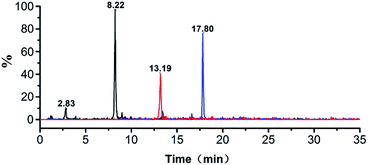
The ion, m/z 473.0, 774.0 and 926.0, were found in the digested the porcine gelatins (Fig. 3). Its MS/MS spectrum corresponded to the sequence, AGVMGPOGSR (O indicates Hyp, Fig. 4a), GETGPAGPAGPVGPVGAR (Fig. 4b), GEOGPTGVQGPOGPAG EEGK (O indicates Hyp, Fig. 4c), respectively. The sequence located in the a2(I) chain of porcine collagen. These peptides were not found neither in the digested other four gelatins, nor by searching against collagens from all five animal species. The ions with m/z values corresponding to marker peptides were extracted from each LC-MS/MS run, and their m/z values, charge states, and retention times are summarized in Table 1. The marker peptides for skin were selected based on three criteria.17 First, the peptide can be detected consistently during multiple repetitive runs. Second, the ideal length of the peptide should range from 7 to 15 amino acid residues, making it feasible for the MRM method. Third, the most intensive signal of peptide should be selected in order to simplify the method. Thus, the most abundant peptide, AGVMGPOGSR, in the digested porcine gelatin was used to develop the quantitation method. Our peptide is complete different from the marker peptide sequences (GIpGEFGLpGPAGPR) Kleinnijenhuis et al.24 found. By blast search, AGVMGPOGSR is only found in pigs and some other animals that not can be used as raw materials for gelatin so that the porcine marker peptide AGVMGPOGSR has a higher exclusivity for the detection of porcine gelatin.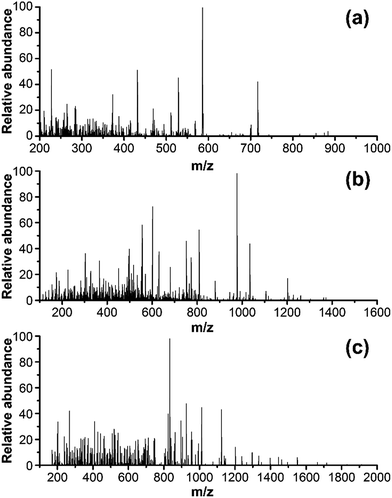 | ||
| Fig. 4 MS/MS spectra of one marker peptide for porcine gelatins: (a) peptide PM1, m/z = 473.0, doubly charged; (b) peptide PM2, m/z = 774.3, doubly charged; and (c) peptide PM3, m/z = 926.0. | ||
| Marker peptide | Sequence | Protein | Charge state | m/z | Precursor mass |
|---|---|---|---|---|---|
| PM1 | 414AGVMGPOGSR423 | COL1A2 | 2 | 473.0 | 944.08 |
| PM2 | 1069GETGPAGPAGPVGPVGAR1086 | COL1A1 | 2 | 774.3 | 1546.70 |
| PM3 | 451GEOGPTGVQGPOGPAGEEGK470 | COL1A1 | 2 | 926.0 | 1849.93 |
Development of the MRM quantitation method for marker peptides
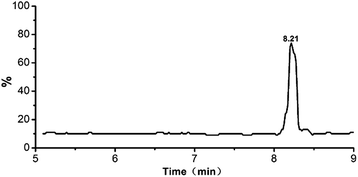
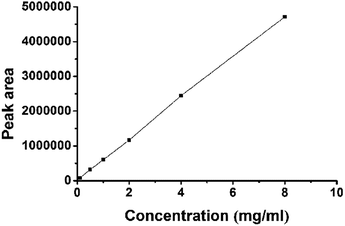
MRM experiments were performed on a triple-quadrupole mass spectrometer. Typically, multiple transitions are required to quantify a peptide from complex samples, whereas a single transition may be sufficient for monitoring peptides from particular proteins with high abundance. Collagen is the dominant protein in animal skins and bones. Three or more transitions were tested for each marker peptide and the most abundant ones were selected in order to simplify the method. Transitions 473.0 → 586.1, 774.3 → 977.8, 926.0 → 833.1 were tested for monitoring PM1, PM2 and PM3, and 473.0 → 586.1 exhibited the most intensive signal. The MRM chromatograms of gelatins prepared from pig shown in Fig. 3. The marker peptides PM1 was eluted at 8.22 min. The identity of porcine gelatins was revealed unambiguously by the presence of corresponding marker peptides. The limit of quantitation was 0.10 pg (Fig. 5).Next, this marker peptide was synthesized to develop a quantitation method. Solutions of the peptide with various concentrations, ranging from 0.1 μg mL−1 to 8 μg mL−1, were prepared. The concentrations were analyzed in triplicate, and 2 μL of sample was injected for LC-MS/MS MRM run. As shown in Fig. 6, standard curve was plotted using the MRM peak area against the amount of sample injected. Good linearity was obtained, and R2 value was greater than 0.999.
Marker peptide detection in gelatins
To demonstrate the ability of this MRM method to identify porcine gelatins in gelatins, the horse-hide gelatin was mixed with 1%, 5%, 40% of porcine gelatins, respectively. Sample preparation was simplified to adapt this method for use in routine applications. Triplicates were analyzed for each sample, and the representative MRM chromatograms are shown in Fig. 7a–c. When porcine gelatin was added, the marker peptide for porcine gelatin was observed. The addition of porcine gelatins was easily detected at an amount over 1% of the total weight in repetitive runs. These results suggest that this method is highly sensitive and is able to detect a trace amount of porcine gelatins added.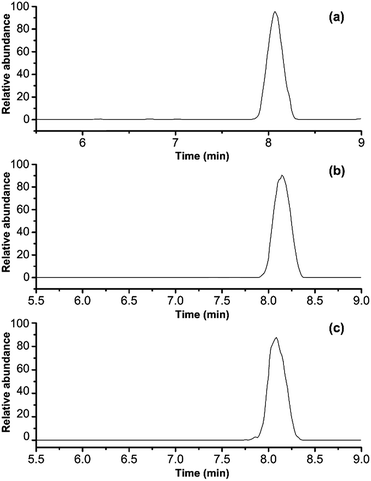 | ||
| Fig. 7 MRM chromatograms of porcine gelatins in different concentration: (a) 1 wt%, (b) 5 wt%, and (c) 40 wt%. | ||
Optimization of enzymolysis time
In order to separate all of characteristic polypeptide by enzymolysis, detected the samples at 0, 4, 6, 8, 9, 12, 14 h after added trypsin for finding out how much time the enzymatic process took. The results showed the peak area under ion pair 473.0 → 586.1 was almost no change between 8–14 hours. The data indicates that the characteristic polypeptides are completely separated by trypsin solution after 8 hours. The suitable testing conditions including enzyme, enzymatic hydrolysis ability and enzymatic time are key points for pretreatment. Consequently, the enzymolysis time of gelatin with trypsin solution can be set to 8 hours or more.Conclusions
A UPLC-MS/MS multiple reaction monitoring method with highly sensitive has been successfully used to distinguish porcine gelatins in different products. The UPLC-MS/MS detection coupled with MRM can profile details of the samples so that important markers of porcine gelatin can be measured even at low concentration levels. The marker peptides of gelatins can be used to identify porcine gelatins in a mixture. As a result, the strategy can be used to verify halal authenticity of gelatin.Conflicts of interest
There are no conflicts to declare.Acknowledgements
Financial supported from the Fundamental Research Funds for the Central Universities (No. PYBZ710) is gratefully appreciated.References
- G. Li, S. Fukunaga, K. Takenouchi and F. Nakamura, Int. J. Cosmet. Sci., 2005, 27, 101–106 CrossRef CAS PubMed.
- M. Hamidi, A. Azadi and P. Rafiei, Adv. Drug Delivery Rev., 2008, 60, 1638–1649 CrossRef CAS PubMed.
- Y. Liu and M. B. Chan-Park, Biomaterials, 2009, 30, 196–207 CrossRef PubMed.
- T. Tasara, S. Schumacher and R. Stephan, J. Food Prot., 2005, 68, 2420–2426 CrossRef CAS PubMed.
- M. Czerner, L. A. Fasce, J. F. Martucci, R. Ruseckaite and P. M. Frontini, Food Hydrocolloids, 2016, 60, 299–307 CrossRef CAS.
- H. I. A. Amqizal, H. A. Al-Kahtani, E. A. Ismail, K. Hayat and I. Jaswir, Food Control, 2017, 78, 297–303 CrossRef.
- A. Karim and R. Bhat, Trends Food Sci. Technol., 2008, 19, 644–656 CrossRef CAS.
- R. S. Sawhney, Cell Biol. Int., 2005, 29, 133–137 CrossRef CAS PubMed.
- A. Venien and D. Levieux, J. Pharm. Biomed. Anal., 2005, 39, 418–424 CrossRef CAS PubMed.
- X.-L. Cheng, F. Wei, X.-Y. Xiao, Y.-Y. Zhao, Y. Shi, W. Liu, P. Zhang, S.-C. Ma, S.-S. Tian and R.-C. Lin, J. Pharm. Biomed. Anal., 2012, 62, 191–195 CrossRef CAS PubMed.
- O. Fumière, M. Dubois, V. Baeten, C. von Holst and G. Berben, Anal. Bioanal. Chem., 2006, 385, 1045 CrossRef PubMed.
- J. S. Amaral, G. Santos, M. B. P. Oliveira and I. Mafra, Food Control, 2017, 72, 53–61 CrossRef CAS.
- M. Merheb, S. Vaiedelich, T. Maniguet and C. Hänni, Mitochondrial DNA, Part A, 2016, 27, 355–359 CrossRef CAS PubMed.
- K. Tasanen, R. Palatsi and A. Oikarinen, Br. J. Dermatol., 1998, 139, 23–26 CrossRef CAS PubMed.
- K. Pawelec, S. M. Best and R. Cameron, J. Mater. Chem. B, 2016, 4, 6484–6496 RSC.
- G. Zhang, A. Sun, W. Li, T. Liu and Z. Su, J. Chromatogr. A, 2006, 1114, 274–277 CrossRef CAS PubMed.
- X. Li, F. Shi, L. Gong, B. Hang, D. Li and L. Chi, Int. J. Nanomed., 2017, 12, 4443 CrossRef PubMed.
- G. Zhang, T. Liu, Q. Wang, L. Chen, J. Lei, J. Luo, G. Ma and Z. Su, Food Hydrocolloids, 2009, 23, 2001–2007 CrossRef CAS.
- M. Nemati, M. Oveisi, H. Abdollahi and O. Sabzevari, J. Pharm. Biomed. Anal., 2004, 34, 485–492 CrossRef CAS PubMed.
- H. H. Grundy, P. Reece, M. Buckley, C. M. Solazzo, A. A. Dowle, D. Ashford, A. J. Charlton, M. K. Wadsley and M. J. Collins, Food Chem., 2016, 190, 276–284 CrossRef CAS PubMed.
- S. A. Sarah, W. N. Faradalila, M. S. Salwani, I. Amin, S. A. Karsani and A. Q. Sazili, Food Chem., 2016, 199, 157–164 CrossRef CAS PubMed.
- M. T. Yilmaz, Z. Kesmen, B. Baykal, O. Sagdic, O. Kulen, O. Kacar, H. Yetim and A. T. Baykal, Food Chem., 2013, 141, 2450–2458 CrossRef CAS PubMed.
- X. M. Sha, Z. C. Tu, H. Wang, T. Huang, D. L. Duan, N. He, D. J. Li and H. Xiao, J. Agric. Food Chem., 2014, 62, 11840–11853 CrossRef CAS PubMed.
- A. J. Kleinnijenhuis, F. L. van Holthoon and G. Herregods, Food Chem., 2018, 243, 461–467 CrossRef CAS PubMed.
| This journal is © The Royal Society of Chemistry 2018 |

