 Open Access Article
Fabrication of magnetically separable NiFe2O4/BiOI nanocomposites with enhanced photocatalytic performance under visible-light irradiation
Yongmei Xiaa,
Zuming He *b,
Jiangbin Suc,
Bin Tangc,
Kejun Hua,
Yaling Lua,
Shunping Suna and
Xiaoping Lia
aJiangsu Key Laboratory of Advanced Material Design and Additive Manufacturing, School of Materials and Engineering, Jiangsu University of Technology, Changzhou 213001, China
bHuaide College, Changzhou University, Jingjiang 214500, China. E-mail: hzm432928@cczu.edu.cn
cSchool of Mathematics and Physics, Changzhou University, Changzhou 213164, China
First published on 24th January 2018
Abstract
A series of novel flower-like NiFe2O4/BiOI (NFO/BOI) nanocomposites have been synthesized via a facile solvothermal method. The structure, morphology and magnetic, optical and visible-light photocatalytic properties of the as-prepared nanocomposite were respectively characterized by X-ray diffraction, field-emission scanning electron microscopy, energy dispersive X-ray spectroscopy, transmission electron microscopy, X-ray photoelectron spectroscopy, photoluminescence spectroscopy, vibrating sample magnetometry and UV-visible diffuse reflectance spectroscopy. Experimental results revealed that the weight percent of NiFe2O4 has a considerable effect on the photodegradation of rhodamine B, methylene blue and crystal violet under visible-light irradiation. Compared with pure NiFe2O4 and BiOI, all the heterogeneous NFO/BOI nanocomposites exhibited significantly enhanced photocatalytic efficiency. Among these prepared samples, the NiFe2O4/BiOI nanocomposite with 15% wt NiFe2O4 displayed the best photocatalytic activity. The enhanced photocatalytic performance was mainly ascribed to the efficient separation of photo-induced electron–hole pairs and the formation of highly active species, superoxide radicals (˙O2˙−), in the NFO/BOI photocatalytic oxidation system. Furthermore, the NFO/BOI nanocomposites could be easily separated and recycled from contaminant solution using a magnet, which exhibited great potential application in the treatment of various pollutants in wastewater by utilizing solar energy effectively.
1. Introduction
With the development of the world economy and the acceleration of social activities, human consumption of energy has been increasing. More and more harmful dye pollutants have been released into the environment. The energy and environmental problems are increasingly prominent, which have become two major issues urgently needing to be solved.1–3 Solar energy is the cleanest and safest source of energy among all kinds of energy sources. Therefore, research on photocatalysis technology using the solar energy degradation of organic pollutants has been become one of the hottest research topics with regard to energy and environment.4–6 The main advantage of this photocatalytic degradation technology is complete degradation of organic pollutants to CO2, H2O and other inorganic constituents with solar energy as an endless energy source,7–10 using catalysts such as TiO2 (ref. 11 and 12) and ZnO.13,14 However, these catalysts only absorb 4% of the solar spectrum energy due to their wide band gap.15 In the last decade, Bi-based compounds like BiOX (X = Cl, Br and I) have attracted much attention because of their unique tetragonal matlockite structures.16–18 In the bismuth oxyhalides, the band gap of BiOI is the narrowest [Eg = 1.7–1.9] with its absorption band edge extending to 680 nm and light absorption range covering almost all the visible light range (390–760 nm). Therefore, BiOI has a good visible-light response and may be a promising photocatalyst. Unfortunately, as a photocatalyst, pure BiOI has some shortcomings such as facile electron–hole pairs recombination under visible-light irradiation, difficult separation and recycling from wastewater, and easy secondary pollution, which would greatly limit its practical application. To improve its photocatalytic activity, some effort has been made to find other efficient semiconductors to form BiOI-based composites such as Fe3O4/BiOI19 and BiOI/TiO2 (ref. 20) to enhance the charge separation. These composites were demonstrated to show higher photocatalytic properties.NiFe2O4 is a narrow band gap semiconductor material, which has magnetic separability, chemical stability and photocatalytic property.21–23 It thus has wide applications in the field of catalysis, magnetic devices, lithium ion batteries and water treatment24–27 and has attracted much attention of researchers. In particular, due to its photocatalytic activity and easy recovery of magnetic properties, NiFe2O4 has a broad application prospect in sewage treatment. Unsatisfactorily, under visible-light irradiation, pure NiFe2O4 exhibits lower photocatalytic activity because of a fast recombination of photoelectron–hole pairs. Considering their own characteristics of the BiOI and NiFe2O4, once NiFe2O4 is introduced to BiOI, they may overcome the above defects. To our best knowledge, preparation of magnetically separable photocatalyst through coupling BiOI to NiFe2O4 has not been reported yet. Hence, we expect that it is meaningful to attempt to add NiFe2O4 to BiOI photocatalyst and there is a wide range of application of the NiFe2O4/BiOI (NFO/BOI) nanocomposites.
In this paper, we successfully prepared magnetically separable NFO/BOI nanocomposites by a facile two-step route. Then the photocatalytic performance of as-synthesized NFO/BOI nanocomposites was investigated by degradation three kinds of dyes under visible-light irradiation. Finally, the possible photocatalytic mechanism was also proposed.
2. Experimental
2.1. Materials
Bismuth nitrate (Bi(NO3)3·5H2O), iron chloride hexahydrate (FeCl3·6H2O), sodium hydroxide (NaOH), ethylene glycol (C2H6O2), nickel chloride hexahydrate (NiCl2·6H2O) and potassium iodide (KI) were purchased from Aladdin Industrial Co., Ltd (Shanghai, China). All the reagents were of analytical grade and used without any further purification.2.2. Preparation of NFO/BOI nanocomposites
The NFO/BOI nanocomposites were synthesized by a two-step method, combining NiFe2O4 and BiOI fabrication by solvothermal method route. The specific preparation process is as follows:2.3. Structure characterization
The phases and crystalline structure were studied by X-ray diffraction (XRD) with Cu Kα (λ = 0.15418 nm) radiation (D/max-2500, Rigaku) of synthesized catalysts. Morphologies and particle sizes were investigated using a field-emission scanning electron microscope (FE-SEM, SUAPR55, Germany Zeiss) with energy-disperse X-ray spectroscopy (EDS). Valence states of element were detected by X-ray Photoelectron Spectroscopy of synthesized catalysts (XPS, ESCALAB 250Xi, Thermo Fisher Scientific, USA). The transmission electron microscopy (TEM) analysis was performed in a JEOL JEM-200CX microscope, operating at 200 kV. The UV-vis diffuse reflectance spectra (DRS) were obtained using a UV-vis spectrophotometer (UV-2450, Shimadzu). The photoluminescence (PL) spectra were measured using a fluorescence spectrophotometer of the samples (FLs980, Edinburgh, UK). The magnetic measurement was conducted with vibrating sample magnetometer (VSM). Electrochemical measurement was conducted with electrochemical analyzer (CHI660C Instruments, Shanghai, China) in a conventional three electrode cell, using an Ag/AgCl electrode (3 M KCl) as the reference electrode and a Pt plate as the counter electrode.2.4. Photocatalytic evaluation studies
The performance of photocatalysis of as-fabricated samples was evaluated by removing rhodamine B (RhB), crystal violet (CV) and methylene blue (MB) under visible-light irradiation. A 500 W xenon lamp equipped with UV cut-off filters (λ > 420 nm) was used as a visible light source, and a light intensity of 0.4 mW cm−2 was ensured. 100 mg of as-prepared sample was put into 100 mL (20 mg L−1) dye solution. Prior to irradiation, the dye solution was stirred for 30 min in the dark. During each photocatalytic experiment, 3 mL of the dye solution was withdrawn every 20 minutes and magnetically separated remove catalyst for analysis. The concentration of the dye solution was measured by UV-vis spectroscopy at its maximum absorption.3. Results and discussion
3.1. XRD analysis
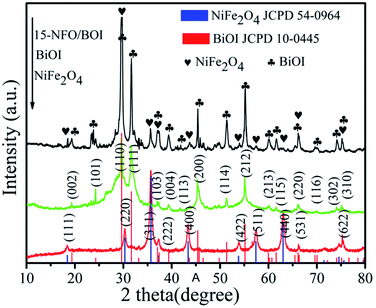
The XRD patterns of as-synthesized samples are presented in Fig. 1. The (111), (220), (311), (222), (400), (422), (511), (400) and (533) crystal planes of spinel NiFe2O4 (JCPD no. 54-0964) can be indexed to the diffraction peaks at the 2θ values of 18.39°, 30.28°, 35.68°, 37.33°, 43.32°, 53.83°, 57.26°, 62.90° and 74.64°, respectively.28 Besides, no other impurity peak is found. The exhibited diffraction peaks at 19.36°, 24.29°, 31.65°, 33.16°, 37.05°, 39.36°, 43.64°, 45.37°, 51.34°, 55.15°, 59.18°, 60.20°, 66.12°, 70.04°, 74.09° and 75.13° are conforming to the (002), (101), (110), (111), (103), (004), (113), (200), (114), (212), (213), (115), (220), (116), (302) and (310) crystal planes of BiOI (JCPD No. 10-0445), respectively. The XRD pattern of the 15-NFO/BOI nanocomposites displayed that all the peaks can be well indexed to spinel structure of NiFe2O4 and tetragonal phase of BiOI. There is no obvious peaks of impurity observed, indicating that the NFO/BOI nanocomposites were indeed two-phase hybrids.3.2. XPS analysis
To investigate the elemental composition and chemical states of the as-prepared samples, XPS measurement was carried out to characterize the 15-NFO/BOI nanocomposites, and the results are displayed in Fig. 2. The XPS survey scan spectrum of NiFe2O4/BiOI nanocomposites is shown in Fig. 2a, which revealed the existence of Ni, Fe, Bi, I and O elements in the composites. All the obtained binding energies were referenced to the C 1s (284.82 eV). In Fig. 2b, the two peaks at 854.16 eV and 873.62 eV were corresponding to the banding energies of Ni 2p3/2 and Ni 2p1/2 respectively, which suggests the typical banding energy of Ni2+.29 In Fig. 2c, the peak at 710.41 eV is corresponding to the binding energy of Fe 2p3/2, and the other peak at 724.72 eV is corresponding to Fe 2p1/2 signal. It indicates that the Fe element exists in the form of Fe3+ ion.30 In Fig. 2d, the two strong peaks at 158.72 and 164.07 eV are assigned to Bi 4f7/2 and Bi 4f5/2 peaks of Bi3+ in the NFO/BOI nanocomposites with a peak difference of 5.35 eV. In Fig. 2e, we can observe two strong peaks at 618.71 and 630.22 eV, corresponding to I 3d5/2 and I 3d3/2 respectively. In addition, the peaks at 529.68 eV and 532.82 eV in Fig. 2f were attributed to O 1s. These two peaks indicate the different types of oxygen molecule such as lattice oxygen and surface oxygen. The XPS result further confirmed the formation of 15-NFO/BOI nanocomposites and intimate integration has been achieved, which agrees well with the XRD results.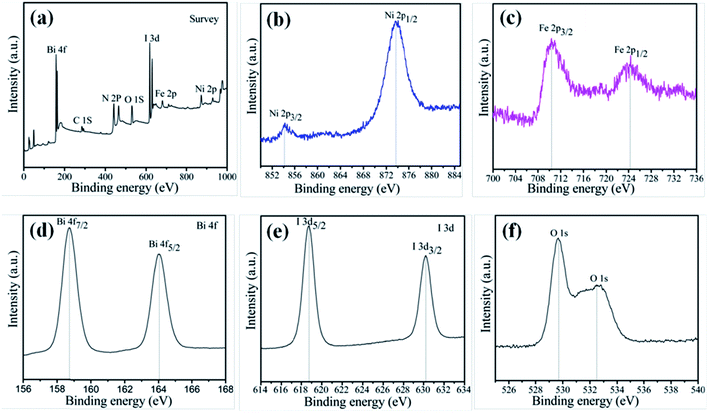 | ||
| Fig. 2 XPS patterns of 15-NFO/BOI nanocomposites (a) survey; (b) Ni 2p; (c) Fe 2p; (d) Bi 4f; (e) I 3d; and (f) O 1s. | ||
3.3. SEM and TEM analysis
The surface morphologies and nanostructures of pure NiFe2O4, BiOI and 15-NFO/BOI nanocomposites were observed by FE-SEM. Fig. 3a displays the pure NiFe2O4 nanoparticles with grain sizes of 30–80 nm. It is observed that the NiFe2O4 nanoparticles appears a little aggregated together to some extent. From Fig. 3b, as-prepared pure BiOI is composed of cauliflower-like nanosheets with a range of diameter about 50–200 nm and an average thickness about 45 nm Fig. 3c demonstrated that NiFe2O4 nanoparticles adhered to the BiOI nanosheet in the 15-NFO/BOI nanocomposites, which would promote the separation efficiency of photoinduced carriers. Furthermore, the result of EDS analysis (Fig. 3d) is in accord with the elements of 15-NFO/BOI nanocomposites. The elements Fe, Ni, Bi, I and O are present in 15-NFO/BOI composites, and the atomic ratio is the same as that of stoichiometric composition of the sample.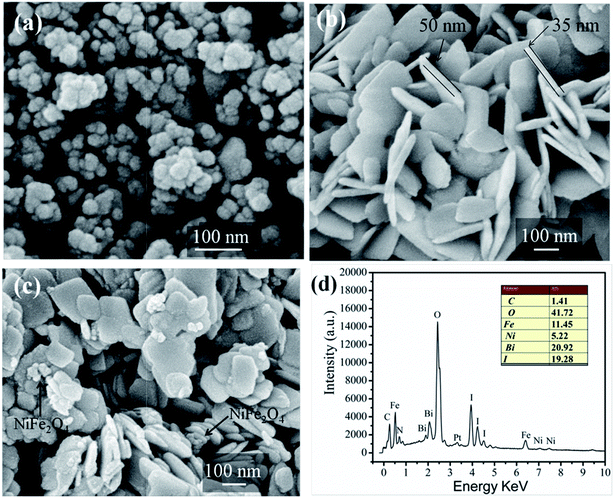 | ||
| Fig. 3 SEM images of NiFe2O4 (a), BiOI (b) and 15-NFO/BOI nanocomposites (c) and EDS results of 15-NFO/BOI nanocomposites (d). | ||
Fig. 4a shows the TEM image of NFO/BiOI nanocomposites, which are uniformly dispersed onto the BiOI without any accumulation. Moreover, in the HRTEM image of NFO/BiOI nanocomposites (Fig. 4c and d), the lattice fringes with a d-spacing of 0.286 nm and 0.295 nm from different regions could be corresponding to the (311) lattice planes of BiOI and (220) lattice planes of NiFe2O4, respectively. In addition, the elemental mappings are shown in Fig. 4e–j. It can be seen that the signals of Fe, Ni, Bi, I and O elements are the same in the spatial distribution.
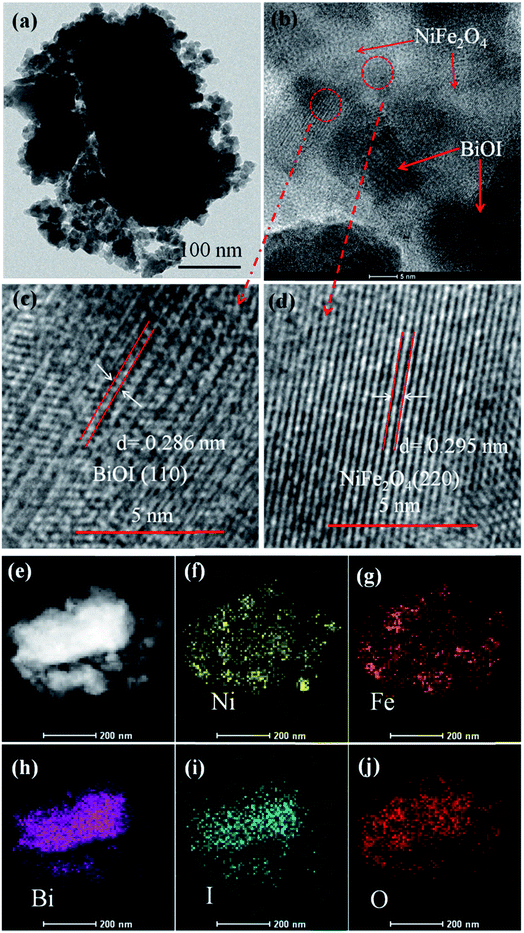 | ||
| Fig. 4 TEM image (a), HRTEM image (b–d) and the corresponding elemental mapping images (e–j) of 15-NFO/BOI nanocomposites. | ||
3.4. Optical properties analysis
As we known, photocatalytic activity of semiconducting photo-catalysts is closely related to the optical absorption ability and the optical properties play a vital role in determining the photocatalytic performance. Thus, UV-vis DRS was used to show the photoabsorption ability of the prepared samples and the results are displayed in Fig. 5a. It was found that BiOI showed a weak absorption in the range of wavelength around 580 nm. However, with the increase of NiFe2O4 (from 5 wt% to 20 wt%), the ability of NFO/BOI nanocomposites for absorption in the visible range became considerably stronger and exhibited a blue shift in the visible-light region compared with pure BiOI. The enhanced light absorption may accelerate the production of electron–hole pairs, thus improve the photocatalytic performance. Fig. 5b shows the band gap energy (Eg) of the pure NiFe2O4, BiOI and 15-NFO/BOI nanocomposites, they were calculated by the following formula based on the UV-vis DRS results:31| αhν = A(hν − Eg)n/2 | (1) |
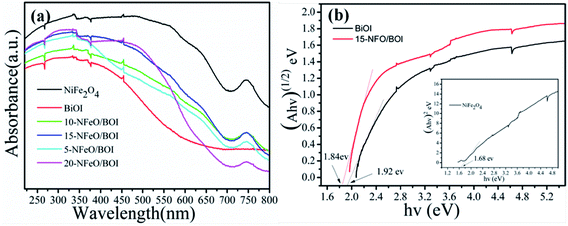 | ||
| Fig. 5 (a) UV-vis diffuse reflectance spectra (DRS) of as-prepared samples, (b) band gap energies of BiOI, 15-NFO/BOI and NiFe2O4. | ||
3.5. Magnetic hysteresis loops analysis
The magnetic hysteresis loops of the 15-NFO/BOI and pure NiFe2O4 under an applied magnetic field of ±2 T at room temperature were shown in Fig. 6. The pure NiFe2O4 nanoparticles exhibited a typical ferromagnetic behavior, and its saturation magnetization (Ms) is about 38.54 emu g−1. The Ms of 15-NFO/BOI nanocomposites was about 25.35 emu g−1, which still had higher Ms compared with other magnetic photocatalyst reported earlier.37 The ferromagnetic property of as-synthesized 15-NFO/BOI catalysts ensures the convenient magnetic separation after used. As shown in the inset of Fig. 6, the 15-NFO/BOI nanocomposites could be easily separated from the wastewater with a common magnet and quickly collected on the side of the glass vial for 10 s, which indicates that 15-NFO/BOI nanocomposites might be easily recycled from wastewater by external magnetic field.38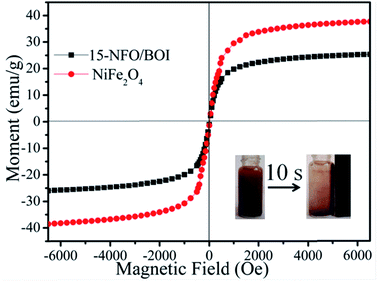 | ||
| Fig. 6 Magnetic hysteresis loops of 15-NFO/BOI nanocomposites and NiFe2O4 (inset: the magnetic separation of 15-NFO/BOI nanocomposites by a magnet). | ||
3.6. Photocatalytic activity
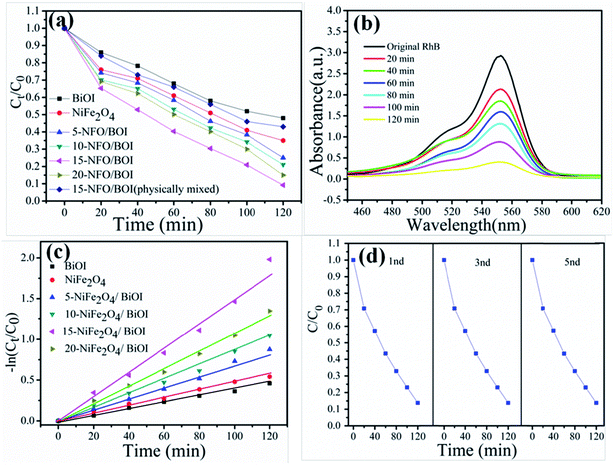
RhB is a typical artificial aromatic compound dye with a molecular formula C28H31ClN2O3 and commonly used as a colour additive in industry although it is not easy to decompose, highly toxic and probably causes cancer.39 The degradation of RhB was used here to evaluate the photocatalytic performance of the as-prepared all samples under visible-light irradiation at room temperature, as shown in Fig. 7a. Obviously, the pure NiFe2O4 and BiOI possessed poor photocatalytic ability, which are consistent with the reported values.40,41 The photocatalytic activities of the NFO/BOI nanocomposites increased firstly and then decreased with the increase of NiFe2O4 content from 5% to 20%. Among all proportions 15-NFO/BOI showed the best photocatalytic efficiency of approximately 91.6% under visible-light irradiation for 120 min. It is clearly evident that the weight percent of NiFe2O4 has a substantial influence on the degradation RhB reaction and could improve the photocatalytic activity. Moreover, the degradation of RhB was used to evaluate the photocatalytic performance of the 15-NFO/BOI physically mixed under the same condition. It was found that photocatalytic activity was nearly the same as that of NiFe2O4. UV-vis spectra were severally observed during degradation of RhB solution under visible-light irradiation. Fig. 7b shows that the intensity of the characteristic absorption peaks of RhB catalyzed by 15-NFO/BOI nanocomposites. It decreased as reaction time went on and molecules of RhB were almost completely degraded after the light irradiation for 120 min. The results disclosed that the 15-NFO/BOI nanocomposites possessed a powerful photo-oxidizing ability and could be utilized as a photocatalyst for practical applications.To reveals the reaction kinetics of the photo-degradation of RhB on different photocatalysts, the degradation rates were computed using the following pseudo-first-order kinetics (eqn (2))
| ln(C0/Ct) = Kappt | (2) |
For the purpose of testing the recyclability and stability of the 15-NFO/BOI photocatalysts, multiple cycle degradation experiments were carried out. The experiments were performed under the identical condition. After the completion of each experiment, the photocatalyst could be quickly collected by an external magnet from the dye solution, washed, dried, and then applied in the next run. As shown in Fig. 7d, their catalytic activity shows no notable decrease even after the fifth recycle. Consequently, the as-synthesized 15-NFO/BOI nanocomposites can work as effective photocatalysts for dye degradation with good stability.
Furthermore, the phase and morphology changes of the 15-NFO/BOI nanocomposites were characterized after cycling light irradiation. The 15-NFO/BOI nanocomposites was examined by XRD and no detectable difference was observed between the as-prepared and the used samples (Fig. 8a). Hence, the 15-NFO/BOI nanocomposites had excellent photostability. SEM images in Fig. 8(b and c) show the 15-NFO/BOI nanocomposites before and after the photocatalytic degradation reaction. Fig. 8b shows the morphology of the catalyst before the photocatalytic reaction, in which distinct NiFe2O4 aggregates were attached to the edge and surface of the BiOI sample. After the photocatalytic degradation reaction, as shown in Fig. 8c, the surface structure and morphology of the 15-NFO/BOI nanocomposites remained intact, further indicating the structural stability of the 15-NFO/BOI sample.
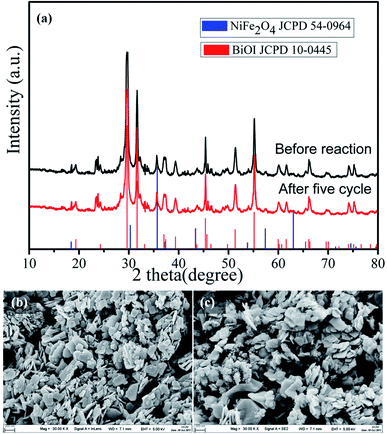 | ||
| Fig. 8 (a) XRD patterns, (b) and (c) SEM images before reaction and after five cycle of 15-NFO/BOI nanocomposites. | ||
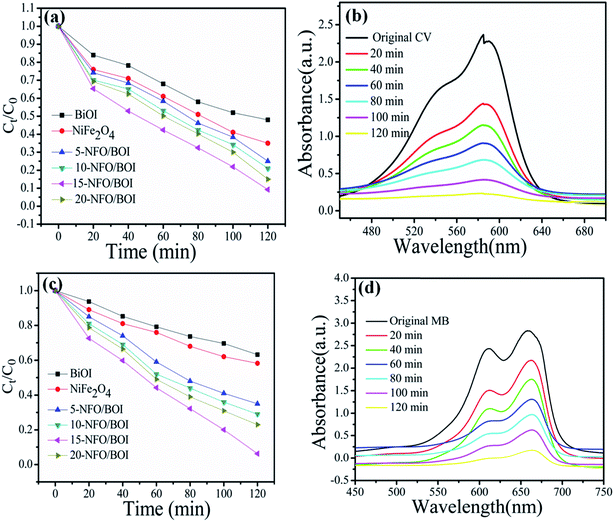
In order to investigate whether the 15-NFO/BOI nanocomposites are of wide applications or not, they have been further tested the photocatalytic performance of CV and MB under the same conditions. Fig. 9a and c show the photocatalytic performances of the as-prepared all samples. The 15-NFO/BOI nanocomposites exhibited the best photocatalytic ability for CV and MB removal. Furthermore, about 92.5% CV and 96% MB were degraded within 120 min, respectively. UV-vis spectra were severally observed during degradation of CV solution and MB solution under visible-light irradiation, respectively, as shown in Fig. 9b and d. The decomposed behaviours of CV solution and MB solution over the photocatalyst of 15-NFO/BOI nanocomposites. It was obvious that the peak intensity of the characteristic absorption at about 585 nm and 658 nm were found to be decreased as reaction time went on, respectively. The results indicate that the 15-NFO/BOI nanocomposites was efficient in catalyzing degradation of dyes under visible-light irradiation.
3.7. Photocatalytic mechanism discussion
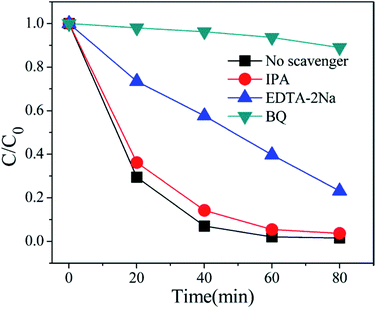
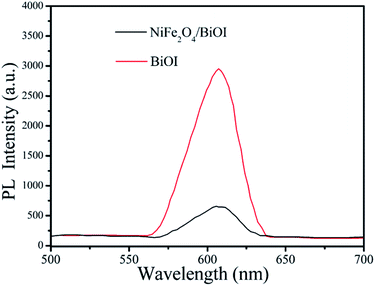
In order to better reveal the photocatalytic mechanism, we carried out the trapping experiments, iso-propyl alcohol (IPA), disodium ethylene-diaminetetraacetate (EDTA-2Na) and benzoquinone (BQ) were used as the scavengers of the hydroxyl radical (˙OH), holes and superoxide radical (˙O2˙−), respectively. As shown in Fig. 10, addition of IPA had almost no effect on RhB degradation for NFO/BOI nanocomposites, indicating that no ˙OH radicals were generated. Nevertheless, a significant decrease was observed after the addition of BQ and EDTA-2Na, demonstrating that ˙O2˙− and holes were involved in the RhB decomposition process.In order to investigate the migration and separation efficiencies of photo-generated charge carriers in pure BiOI and 15-NFO/BOI nanocomposites, a room-temperature PL emission spectrum were measured, as shown in Fig. 11. For pure BiOI a strong emission peak at 607 nm were observed. The similar PL spectra was obtained for 15-NFO/BOI nanocomposites. It could be seen that the peak intensity of the spectrum for the 15-NFO/BOI nanocomposites is lower than that of the pure BiOI sample. As we known, intensity of the PL spectrum of a semiconductor mainly results from the recombination of electrons–holes pairs. Hence, there is a strong correlation between PL emission intensity and separation of the photo-generated charge carriers. For this reason, the weakened emission intensity in 15-NFO/BOI nanocomposites indicates inhibition of electron–hole recombination due to the co-catalytic effect of NiFe2O4, which lengthens the lifetime of charge carriers and is beneficial for the improvement of photocatalytic activity.
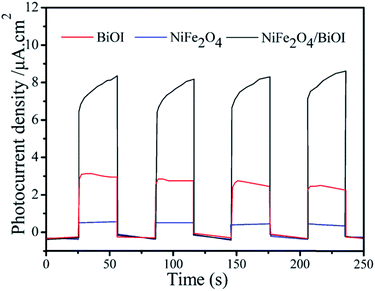
Photocurrent measurements were performed to further investigate the generation and transfer of photoexcited charge carriers in the photocatalytic process. As shown in Fig. 12, 15-NFO/BOI nanocomposites exhibited enhanced photocurrent responses compared to the pure BiOI and NiFe2O4. These photocurrent efficiencies are consistent with the degrees of photocatalytic activity. Therefore, in the 15-NFO/BOI nanocomposites, the separation and transfer efficiency of the photoinduced electrons–holes pairs was improved by the interfacial interactions between NiFe2O4 and BiOI.
To describe mechanism of the enhanced photocatalytic activity of the NFO/BOI nanocomposites under visible-light irradiation, the corresponding conduction band (CB) and valence band (VB) positions for NiFe2O4 and BiOI were theoretically computed using the atom's Mulliken electronegativity definition (eqn (3) and (4)):
| EVB = χ − Ec + 0.5Eg | (3) |
| ECB = EVB − Eg | (4) |
According to the above results, the possible photocatalytic mechanisms of the NFO/BOI nanocomposites were illustrated in Fig. 13. Under visible-light irradiation (λ > 420 nm), the electrons of BiOI and NiFe2O4 can be excited and then transit from the VB position to the position of CB. Then the electrons on the CB of NiFe2O4 jumped to inject into the more positive CB of the surrounding BiOI, while the same amount of holes in the VB of BiOI migrated to the more negative VB edge position of NiFe2O4, leading to the rapid separation of the photoinduced electrons and holes. Because of the CB potentials of BiOI (0.718 eV) are more positive than that of O2/˙O2˙− (−0.33 eV vs. NHE),45 the oxygen (O2) in the solution was trapped by the electrons to form ˙O2˙− on the NFO4/BOI surface, then ˙O2˙− further oxidized the organic contaminants to H2O and CO2 as final products. However, the photo-induced holes accumulated on NiFe2O4 cannot oxidize surface-bound water or hydroxyl group into ˙OH (2.38 V vs. NHE),46 due to the more negative VB potential of NiFe2O4, indicating that photogenerated holes of such catalyst have strong oxidation ability than ˙OH and H2O2. Therefore, photogenerated holes react directly with adsorbed molecules of RhB to produce degradation products. As a result, both of the ˙O2˙− and holes play important roles in degradation of organic pollutants.
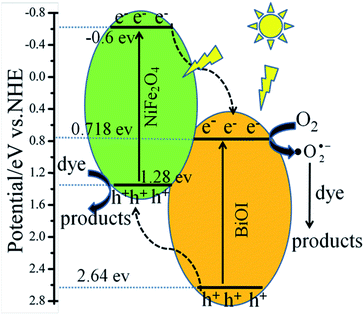 | ||
| Fig. 13 Schematic illustration of excitation and separation of photoinduced electron–hole pairs for NFO4/BOI nanocomposites under visible light irradiation. | ||
4. Conclusions
In this work, novel multifunctional NFO/BOI nanocomposites were fabricated through the hybridization of NiFe2O4 and BiOI. For the heterogeneous materials, the optimal content was achieved to be the 15-NFO/BOI, which exhibited excellent capacity for the degradation of RhB, CV and MB under visible-light irradiation. The enhanced photodegradation performance can be attributed to the promoted separation and inhibited recombination of electron–holes pairs in the heterostructures of NFO/BOI nanocomposites. Moreover, the excellent room temperature ferromagnetism and stability of NFO/BOI nanocomposites ensure the convenient magnetic separation. Since the unique NFO/BOI material with high activity and recyclable magnetic separation, it have potential applications in organic pollutant removal and environmental remediation.Conflicts of interest
The authors declare no competing financial interest.Acknowledgements
This work was supported by the National Natural Science Foundation of China (61107055) and the Specialized Research Fund for the Doctoral Program of Jiangsu University of Technology (KYY17011).References
- C. W. Kim, S. P. Suh, M. J. Choi, Y. S. Kang and Y. S. Kang, J. Mater. Chem. A, 2013, 1, 11820–11827 CAS.
- J. J. Xu, Y. M. Hu, C. Zeng, Y. H. Zhang and H. W. Huang, J. Colloid Interface Sci., 2017, 505, 719–727 CrossRef CAS PubMed.
- J. Z. Y. Tan, N. M. Nursam, F. Xia, M. A. Sani, W. Li, X. D. Wang and R. A. Caruso, ACS Appl. Mater. Interfaces, 2017, 9, 4540–4547 CAS.
- W. Subramonian, T. Y. Wu and S. P. Chai, J. Environ. Manage., 2017, 187, 298–310 CrossRef CAS PubMed.
- F. Chen, D. Li, B. Luo, M. Chen and W. Shi, J. Alloys Compd., 2017, 694, 193–200 CrossRef CAS.
- W. Li, D. H. Chen, F. Xia, J. Z. Y. Tan, P. P Huang, W. G. Song, N. M. Nursam and R. A. Caruso, Environ. Sci.: Nano, 2016, 3, 94–106 RSC.
- J. Wen, J. Xie, X. Chen and X. Li, Appl. Surf. Sci., 2017, 391, 72–123 CrossRef CAS.
- A. I. Borhan, P. Samoila, V. Hulea, A. R. Iordan and M. N. Palamaru, J. Taiwan Inst. Chem. Eng., 2014, 45, 1655–1660 CrossRef CAS.
- Y. Bu and Z. Chen, Electrochim. Acta, 2014, 144, 42–49 CrossRef CAS.
- I. K. Konstantinou and T. A. Albanis, Appl. Catal., B, 2004, 49, 1–14 CrossRef CAS.
- X. Chen and S. S. Mao, Chem. Rev., 2007, 107, 2891–2959 CrossRef CAS PubMed.
- F. Niu, L. S Zhang, C. Q. Chen, W. Li, L. Li, W. G. Song and L. Jiang, Nanoscale, 2010, 2, 1480–1484 RSC.
- Z. M. He, Y. M. Xia, B. Tang, X. F. Jiang and J. B. Su, Mater. Lett., 2016, 184, 148–151 CrossRef CAS.
- K. Ji, H. Dai, J. Deng, H. Zang, H. Arandiyan, S. Xie and H. Yang, Appl. Catal., B, 2015, 168–169, 274–282 CrossRef CAS.
- W. Cui, W. An, L. Liu, J. Hu and Y. Liang, J. Hazard. Mater., 2014, 280, 417–427 CrossRef CAS PubMed.
- H. Huang, X. Han, X. Li, S. Wang, P. K. Chu and Y. Zhang, ACS Appl. Mater. Interfaces, 2015, 7, 482–492 CAS.
- F. Chen, C. Niu, Q. Yang, X. Li and G. Zeng, Ceram. Int., 2016, 42, 2515–2525 CrossRef CAS.
- Y. Yu, C. Y. Cao, H. Liu, P. Li, F. F Wei, Y. Jiang and W. G. Song, J. Mater. Chem. A, 2014, 2, 1677–1681 CAS.
- X. Li, C. Niu, D. Huang, X. Wang, X. Zhang, G. Zeng and Q. Niu, Appl. Surf. Sci., 2013, 286, 40–46 CrossRef CAS.
- X. Zhang, L. Zhang, T. Xie and D. Wang, J. Phys. Chem. C, 2009, 113, 7371–7378 CAS.
- S. Balaji, R. K. Selvan, L. J. Berchmans, S. Angappan, K. Subramanian and C. O. Augustin, Mater. Sci. Eng., B, 2005, 119, 119–124 CrossRef.
- S. Gautam, P. Shandilya, V. P. Sing, P. Raizada and P. Singh, Journal of Water Process Engineering, 2016, 14, 86–100 CrossRef.
- P. Chen, X. Xing, H. F. Xie, Q. Sheng and H. X. Qu, Chem. Phys. Lett., 2016, 660, 176–181 CrossRef CAS.
- C. T. Cherian, J. Sundaramurthy, M. V. Reddy, P. S. Kumar, K. Mani, D. Pliszka, C. H. Sow, S. Ramakrishna and B. V. R. Chowdari, ACS Appl. Mater. Interfaces, 2013, 5, 9957–9963 CAS.
- H. Song, L. P. Zhu, Y. G. Li, Z. R. Lou, M. Xiao and Z. Z. Ye, J. Mater. Chem. A, 2015, 3, 8353–8360 CAS.
- T. H. Yu, W. Y. Cheng, K. J. Chao and S. Y. Lu, Nanoscale, 2013, 5, 7356–7360 RSC.
- M. Dhiman, A. Goyal, V. Kumar and S. Singhal, New J. Chem., 2016, 40, 10418–10431 RSC.
- J. Henle, P. Simon, A. Frenzel, S. Scholz and S. Kaskel, Chem. Mater., 2007, 19, 366–373 CrossRef CAS.
- H. Y. Ji, X. C. Jing, Y. G. Xu, J. Yan, H. P. Li, Y. P. Li, L. Y. Huang, Q. Zhang, H. Xu and H. M. Li, RSC Adv., 2015, 5, 57960–57967 RSC.
- H. S. Kim, D. J. Kim, B. S. Kwak, G. B. Han, M. H. Um and M. Kang, Chem. Eng. J., 2014, 243, 272–279 CrossRef CAS.
- A. Murphy, Sol. Energy Mater. Sol. Cells, 2007, 91, 1326–1337 CrossRef CAS.
- Y. Ohko, K. Hashimoto and A. Fujishima, J. Phys. Chem. A, 1997, 101, 8057–8062 CrossRef CAS.
- N. M. Nursam, J. Z. Y. Tan, X. D. Wang, W. Li and F. Xia, ChemistrySelect, 2016, 1, 4868–4878 CrossRef CAS.
- Z. H. Shah, Y. z. Ge, W. Y. Ye, X. J. Lin, S. F. Zhang and R. W. Lu, Mater. Chem. Phys., 2017, 198, 73–82 CrossRef CAS.
- X. w. Li, L. Wang, L. Zhang and S. p. Zhuo, Appl. Surf. Sci., 2017, 419, 586–594 CrossRef CAS.
- Y. W. Zhou, S. S. Fang, M. Zhou, G. Q. Wang, S. Xue, Z. Y. Li, S. Xu and C. Yao, J. Alloys Compd., 2017, 696, 353–361 CrossRef CAS.
- H. S. Kim, D. J. Kim, B. S. Kwak, G. B. Han, M. H. Um and M. Kang, J. Chem. Eng., 2014, 243(27), 2–9 Search PubMed.
- D. D. Lv, D. F. Zhang, X. Y. Liu, Z. R. Liu, L. J. Hu, X. P. Pu, H. Y. Ma, D. C. Li and J. M. Dou, Sep. Purif. Technol., 2016, 158, 302–307 CrossRef CAS.
- J. T. Deng, L. Liu, T. J. Niu and X. S. Sun, Appl. Surf. Sci., 2017, 403, 531–539 CrossRef CAS.
- Z. M. He, Y. M. Xia, B. Tang and J. B. Su, Mater. Res. Express, 2017, 4, 095501–095508 CrossRef.
- Y. Guan, H. Qian, J. Q. Guo, S. G. Yang, X. Wang, S. M. Wang and Y. S. Fu, Appl. Clay Sci., 2015, 114, 124–132 CrossRef CAS.
- Y. Q. Wang, X. F. Cheng, X. T. Meng, H. W. Feng, S. G. Yang and C. Sun, J. Alloys Compd., 2015, 632, 445–449 CrossRef CAS.
- L. Zhang, X. Zhang, Y. Q. Huang, C. L. Pan, J. S. Hu and C. M. Hou, RSC Adv., 2015, 5, 30239–30247 RSC.
- L. Cao, D. H. Chen, W. Li and R. A. Caruso, ACS Appl. Mater. Interfaces, 2014, 6, 13129–13137 CAS.
- J. Kim, C. W. Lee and W. Choi, Environ. Sci. Technol., 2010, 44, 6849–6854 CrossRef CAS PubMed.
- W. Li, C. Y. Cao, L. Y. Wu, M. F. Ge and W. G. Song, J. Hazard. Mater., 2011, 198, 143–150 CrossRef CAS PubMed.
| This journal is © The Royal Society of Chemistry 2018 |

