 Open Access Article
Hydroalkylation modification of naphthene-based aromatic-rich fraction and its influences on mesophase development
Ming Li a,
Dong Liu*b,
Bin Loub,
Yadong Zhangb,
Shitao Yu*a and
Jnuwei Ding*a
aCollege of Chemical Engineering, Qingdao University of Science and Technology, Qingdao, China 266042. E-mail: yushitaoqust@126.com; djw1970@163.com; Fax: +86 0532 84022782; Tel: +86 0532 84022782
bState Key Laboratory of Heavy Oil Processing, China University of Petroleum, Qingdao, China 266580. E-mail: ldongupc@vip.sina.com; Fax: +86 0532 86984629; Tel: +86 0532 86984629
First published on 19th January 2018
Abstract
Naphthene-based aromatic-rich fraction was modified by tetrahydronaphthalene and polyethylene glycol to obtain modified materials which were selected to prepare mesophase pitches by a direct condensation method. The structural composition of modified materials were characterized by simulated distillation (SIMDIS), elemental analysis, Fourier transform infrared spectrometry (FTIR) and 1H nuclear magnetic resonance (1H NMR) spectroscopy. Influences of the naphthenic structures and alkyl chains in modified materials on the formation and development of mesophase structures were investigated by analyzing variations in optical texture, softening point, carbon residue, molecular and microcrystal structure of mesophase pitch. Results showed that the alkyl structures in modified materials treated by tetrahydronaphthalene and polyethylene glycol were mainly naphthenic structures and alkyl chains, respectively. The existence of alkyl structures in modified materials was beneficial for the formation of mesophase with high quality. Moreover, the naphthenic structures had a better improving effect than alkyl chains. Abundant naphthenic structures or an appropriate amount of alkyl chains in feedstock contributed to the preparation of mesophase pitch with large domain structure, low softening point, high carbon residue and ordered microcrystal structure.
1. Introduction
Mesophase pitch is widely recognized as an excellent precursor for making high quality carbon materials.1 Mesophase pitch based carbon material has great exploitation potential and broad application prospects in the field of new carbon materials due to its relatively low price, high strength, good electric performance, and environmental friendliness etc.1–4 Naphthenic base oil which contains a high content of aromatic fractions can be used for the preparation of high-quality mesophase pitch; moreover, the naphthenic vacuum residue is abundant in source and cheap in price.5,6 Therefore, research on the preparation and formation mechanism of petroleum based mesophase pitch are a hotspot and focus in the field of carbon materials at home and abroad.7–9As previously reported, the number of alkyl groups in the raw material was one of the most important factors to control the solubility and the anisotropic content of mesophase pitch.8–11 The effect of the alkyl groups on the formation of mesophase pitch has been studied. Some research has indicated that the alkylation method was quite an effective method to improve the properties of mesophase pitch.11–15 Miyake et al. have tried to assess the effects of alkyl groups on the formation of anisotropic texture.15 In their work, a mesophase pitch, which contained only a few alkyl groups per molecule, was treated by reductive alkylation (methyl and ethyl) to study the effects of reductive alkyl groups on anisotropic texture formation. When the alkylated pitch was carbonized, the anisotropic content varied depending on the number and steric size of introduced alkyl groups. After studying the preparation of naphthalane and methyl naphthalane mesophase pitches, Mochida et al. found that hydromodification of the feedstock is effective method to convert quinoline insolubles of pitches into graphitizable carbon.16–18 Furthermore, Korai et al. suggested that the content of methyl in the mesophase molecule is the main influence factor of mesogen molecules stacking.19 Yoon et al. also proposed that the number of methyl groups have an influence on the properties of the mesophase pitch. In conclusion, the influences of the alkyl side chain and naphthenic group on the optical texture and molecular structure of mesophase pitch are worth to be studied comprehensively.20
In this paper, the naphthene-based aromatic-rich fraction were subjected to the hydroalkylation treatment by reacting with tetrahydronaphthalene and polyethylene glycol, and then the modified materials were treated by direct condensation method to study the influences of hydromodification of feedstocks on the development of mesophase structure. In addition, the influences of the naphthenic structures and alkyl chains in modified materials on the formation of mesophase pitches were investigated, and the mechanism of carbonization was discussed.
2. Experimental section
2.1 Materials
The aromatic-rich fraction (named F) was derived from the naphthene-based vacuum residue provided by CNOOC Company. The additives tetrahydronaphthalene and polyethylene glycol are supplied by Aladdin Industrial Corporation, and the average molecular weight (Mn) of polyethylene glycol is about 400. Table 1 listed the properties of the feedstock. The F was characterized with high content of carbon and low contents of sulphur and nitrogen. Additionally, the aromatics were enriched in F, while no asphaltene was detected.| Sample | Elemental composition/wt% | Mn | Group composition/wt% | ||||||
|---|---|---|---|---|---|---|---|---|---|
| C | H | N | S | Saturates | Aromatics | Resin | Asphaltene | ||
| F | 90.22 | 9.64 | 0.09 | 0.04 | 410.12 | 14.47 | 56.40 | 30.15 | 0 |
2.2 Hydromodification and thermal treatment
The feedstock F together with additives (tetrahydronaphthalene or polyethylene glycol) were heated in the 300 ml high-pressure agitated autoclave after replacing air the reaction system by nitrogen for 3 times. When the hydroalkylation reaction was carried out under autogenic pressure at 400 °C for 2 hours, the unreacted additives were purged from the reaction system by nitrogen and the modified materials were generated at the bottom of autoclave. Then the modified materials were heated in to 430 °C with a rate of less than 5 °C min−1. The reaction was conducted under the pressure of 2 MPa for 9 hours and the mesophase pitch were obtained.2.3 Analysis
The simulated distillation technology was used to determine the IBP (initial boiling point) and FBP (final boiling point) of modified material on a CP3800 gas chromatograph made by America Varian Company according to ASTM D-2887. The elemental composition of modified material was determined by a PE-2400 Series HCSN elemental analyzer. The functional groups in aromatic compounds were characterized by FTIR analysis using a Nicolet S-215 spectrometer. The optical texture of mesophase pitch was observed and photographed on a XP-4030 polarized microscope made by Shanghai Milite Precise Instrument Co. Ltd, China. The penetrometer method was used to measure the softening point (SP) of mesophase pitch.21 The carbon residue of the carbonized product was analyzed in accordance with ASTM D4530. The modified materials and the pyridine-soluble fractions of mesophase pitches were characterized by 1H NMR on a Bruker Avance DMX-500 NMR spectrometer using deuterated pyridine as the solvent. The crystal structure of the mesophase pitch was characterized by a PANalyitcal X'Pert PRO MPD X-ray diffraction (XRD) with a Cu Kα radiation (λ = 0.15418 nm). The Raman spectra of products were obtained in a Labram 10 Raman spectrometer (Jobin Yvon Company) using a He–Ne laser as excitation source giving a monochromatic red light (λ = 632.8 nm) at 1 mW.3. Results and discussion
3.1 Characterization of modified materials
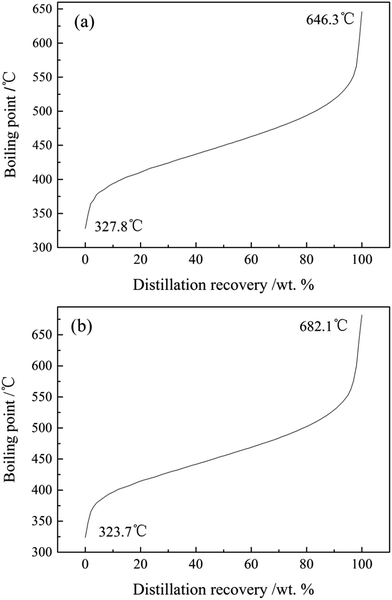
As shown in the SIMDIS characteristic curves of T4 and E4 (Fig. 1), the IBP (327.8 °C) of T4 was higher than the boiling point (207.2 °C) of its modifying agent (tetrahydronaphthalene), and the IBP (323.7 °C) of E4 was below the boiling point (280 °C) of polyethylene glycol. This meant that there no modifying agents left in the modified materials after the hydromodification of feedstocks.8
Table 2 listed the elemental components of modified materials. Owing to the hydromodification of feedstock, the n(H)/n(C) ratios of modified materials (T1, T2, T3, T4, E1, E2, E3 and E4) were all higher than F. In addition, the oxygen mass percents of modified materials were all below 0.02‰, which demonstrated that there was little oxygenic functional group contained in the modified materials.8 Therefore, it was ignored that the influence of oxygen during the following thermal reaction.
| Sample | Elemental component/wt% | n(H)/n(C) | ||
|---|---|---|---|---|
| H | C | O | ||
| a Note: n(H)/n(C), molar ratio of hydrogen atom to carbon atom. | ||||
| F | 8.37 | 89.84 | 0.001 | 1.1180 |
| T1 | 8.45 | 89.96 | 0.001 | 1.1272 |
| T2 | 8.72 | 89.90 | 0.001 | 1.1640 |
| T3 | 8.80 | 89.86 | 0.001 | 1.1752 |
| T4 | 8.93 | 89.85 | 0.001 | 1.1927 |
| E1 | 8.46 | 90.12 | 0.002 | 1.1265 |
| E2 | 8.59 | 90.03 | 0.002 | 1.1450 |
| E3 | 8.71 | 89.98 | 0.002 | 1.1616 |
| E4 | 8.35 | 90.87 | 0.002 | 1.1027 |
| Sample | F | T1 | T2 | T3 | T4 | E1 | E2 | E3 | E4 |
|---|---|---|---|---|---|---|---|---|---|
| fa | 0.36 | 0.33 | 0.31 | 0.30 | 0.29 | 0.34 | 0.33 | 0.31 | 0.30 |
| R | 1.75 | 1.96 | 2.01 | 2.11 | 2.14 | 1.89 | 1.92 | 1.99 | 2.02 |
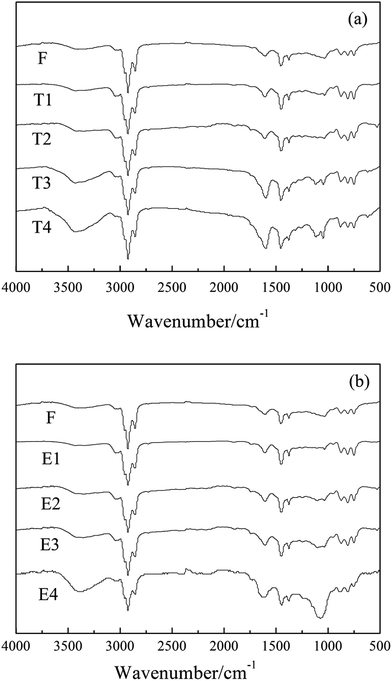
As the amount of tetrahydronaphthalene increased, the aromaticity (fa) of F, T1, T2, T3 and T4 decreased successively. Analogously, the fa of F, E1, E2, E3 and E4 decreased with the adding of polyethylene glycol (presented in Table 3). This implied that the alkyl structures (include naphthenic structures and alkyl chains) contained in modified materials increased with raising amount of modifying agents.8 In addition, the molar ratios (r) of –CH2– to –CH3 of F, T1, T2, T3 and T4 increased in sequence, and those of F, E1, E2, E3 and E4 increased in a similar way. It meant the increase of naphthenic structures or alkyl chains contained in modified materials with the increase of modifying agents.
| Sample | Hydrogen contents/% | RN | ||||
|---|---|---|---|---|---|---|
| Har | Hα | Hβ | Hγ | Hn | ||
| a Note: Har, aromatic hydrogens (δ = 9.0–6.0 ppm); Hα, aliphatic hydrogens in methyl or methylene groups in α-position to an aromatic ring (δ = 3.3–2.0 ppm); Hβ, aliphatic hydrogens in methyl or methylene groups in β-position to an aromatic ring (δ = 1.4–1.0 ppm); Hγ, aliphatic hydrogens in methyl or methylene groups in γ-position to an aromatic ring (δ = 1.0–0.5 ppm); Hn, naphthenic hydrogen (δ = 2.0–1.4 ppm); RN, the number of naphthenic rings.8 | ||||||
| F | 42.87 | 30.31 | 11.97 | 4.54 | 10.31 | 0.84 |
| T4 | 34.66 | 30.55 | 5.24 | 5.38 | 24.17 | 2.45 |
| E4 | 32.90 | 29.95 | 18.33 | 7.59 | 11.23 | 0.91 |
Compared with F, the percent of Har hydrogens in T4 and E3 decreased, witch implied that the aliphatic hydrocarbons increased. The percent of Hβ in T4 decreased sharply, while that in E4 increased obviously compared with F, meanwhile, the percent of Hγ changed little. It suggested that the modified material T4 contained less alkyl chains than F, while E4 possessed more than F.10 In addition, the percent of Hn in T4 and E4 were higher than that of F, and T4 contained more Hn than E4 obviously, which meant that the increase of naphthenic structures in T4 and E4 due to the treatment of tetrahydronaphthalene and polyethylene glycol, and T4 contained more naphthenic structures than E4.8 This was consistent with the computed results of the naphthenic rings (RN). As shown in Table 4, the naphthenic rings of E4 was much more than F and E4, while the RN of E4 changed little compared to F. It indicated that there were more naphthenic structures in T4 than E4.11,22 In consideration of the result of the FTIR analysis, the increased methylene structures in T4 were mainly existed in the form of naphthenic structures, while those in E4 were largely alkyl chains. In conclusion, the increased alkyl structures in modified materials resulted from the modification of tetrahydronaphthalene were mainly naphthenic structures, while those in modified materials treated by polyethylene glycol were largely alkyl chains considering the analyses of FTIR and 1H NMR.
3.2 Optical texture analysis of mesophase pitch
The optical textures of mesophase pitches prepared by F, T1, T2, T3, T4, E1, E2, E3 and E4 (named F-MP, T1-MP, T2-MP, T3-MP, T4-MP, E1-MP, E2-MP, E3-MP and E4-MP, respectively) are presented in Fig. 4.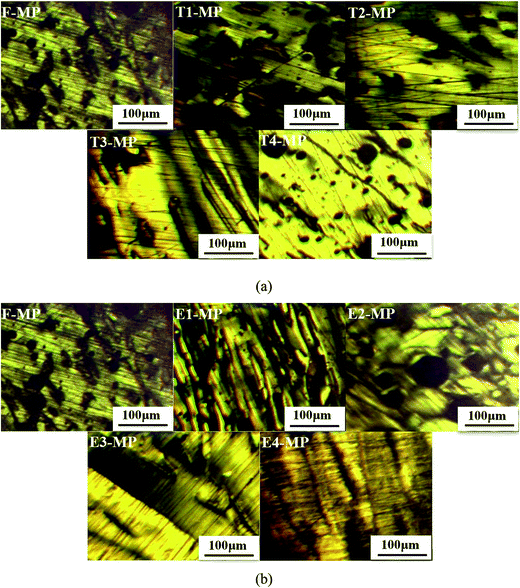 | ||
| Fig. 4 Optical textures of mesophase pitches: (a) F-MP, T1-MP, T2-MP, T3-MP and T4-MP; (b) F-MP, E1-MP, E2-MP, E3-MP and E4-MP. | ||
As shown in Fig. 4(1), the medium domain structure with a diameter in the range of 100–200 μm was generated in the optical micrograph of F-MP.27 The size of anisotropic unit developed with the adding of tetrahydronaphthalene. When the additive amount was 30 wt%, the large domain structure with a size larger than 200 μm was appeared in T4-MP. This behavior could be explained by the increase of naphthenic structures in modified materials. Hydrogen transfer reactions of naphthenic structures occurred during the pyrolysis process, which could moderate the violence of the reaction, maintain the flowability of the reaction system, and improve the solubility of mesophase pitch.8 Then the development of mesophase pitch undergoes a relative smooth process, and a mesophase pitch with large domain structure was easily formed.
From Fig. 4(2), the optical texture of mesophase pitches (E1-MP, E2-MP, and E3-MP) developed and the diameter of anisotropic units grew larger with the increase of polyethylene glycol. However, when the amount of polyethylene glycol rose to 30 wt%, the mosaic structure with a size smaller than 50 μm was appeared in E4-MP. This phenomenon was ascribed to the overabundance of alkyl chains which would produce more free radicals at high temperature. The free radicals could accelerate the carbonizing rate, so the aromatic molecules had no enough time to coalesce and be arranged orderly.8 As a result, the development of anisotropic structure was restricted and the formation of mesophase pitch was hindered. Although the modified materials treated by polyethylene glycol also contained some naphthenic structures which could moderate the carbonized reaction. But if there was an excess of alkyl chains, it would play leading roles during the thermal treatment, while the influence of naphthenic structures would be covered.24,25 So the mesophase pitch E4-MP presented an optical texture of mosaic structure. In conclusion, the optical texture of T4-MP were more ordered than that of E3-MP, although T4-MP and E3-MP all displayed large domain structure, which indicated the better performance of tetrahydronaphthalene in modifying the feedstock compared to polyethylene glycol.
3.3 Softening point and carbon residue analyses of mesophase pitch
Table 5 listed the softening points and carbon residues of F-MP, T1-MP, T2-MP, T3-MP, T4-MP, E1-MP, E2-MP, E3-MP and E4-MP.| Sample | Softening point/°C | Carbon residue/wt% |
|---|---|---|
| F-MP | 259 | 73.68 |
| T1-MP | 235 | 74.05 |
| T2-MP | 226 | 83.57 |
| T3-MP | 219 | 84.12 |
| T4-MP | 218 | 85.57 |
| E1-MP | 245 | 75.85 |
| E2-MP | 233 | 79.68 |
| E3-MP | 226 | 83.76 |
| E4-MP | 239 | 80.24 |
With the increase of tetrahydronaphthalene, the softening points of mesophase pitches decreased, while the carbon residues increased. This behavior could be explained by the hydrogen radicals generated by the modified materials with naphthenic structures during the polycondensation process.8,16 The hydrogen transfer reaction caused by the hydrogen radicals could alleviate the carbonization reaction and reduce the viscosity, so the reaction system maintained good fluidity. As a result, the softening points of mesophase pitches decreased with the increase of naphthenic structures. Meanwhile, the low molecular weight radicals produced during the pyrolysis process were easily to form polycyclic aromatic compounds with large molecular at low viscosity, which could reduce the spillage of components with low boiling points. So the carbon residues increased.
However, with the adding of polyethylene glycol, the softening points of mesophase pitches decrease first and then increased, while the variation tendency of the carbon residues was just opposite to that of softening points. This phenomenon was due to the superabundance of alkyl chains in modified materials (when the amount of polyethylene glycol was 30 wt%), which accelerated the carbonized reaction. The fast reaction rate led to the excessive condensation, and then the softening points increased and the carbon residues decreased.
3.4 FTIR analysis of mesophase pitch
Fig. 5 presents the FTIR spectra of mesophase pitches (F-MP, T1-MP, T2-MP, T3-MP, T4-MP, E1-MP, E2-MP, E3-MP and E4-MP).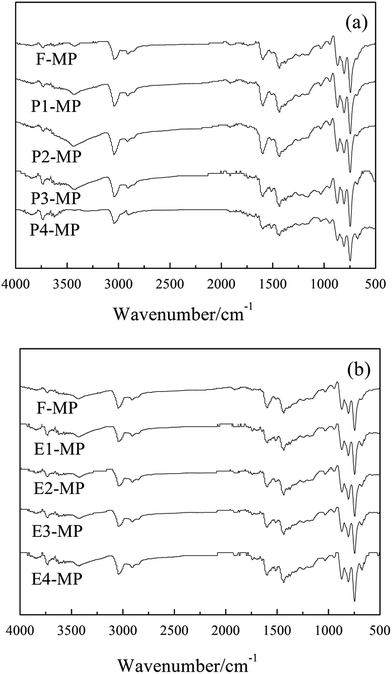 | ||
| Fig. 5 FTIR spectra of mesophase pitches: (a) F-MP, T1-MP, T2-MP, T3-MP and T4-MP; (b) F-MP, E1-MP, E2-MP, E3-MP and E4-MP. | ||
The absorption peaks of methyl –CH3 (at 1380 cm−1), alkyl C–H (at 2920 cm−1) and aromatic C–H (at 3040 cm−1) were presented in the spectra of mesophase pitches, which indicated that there were a certain amount of alkyl structures contained in mesophase pitches.8 The peak intensity ratio of isolated aromatic C–H to aromatic C![[double bond, length as m-dash]](https://www.rsc.org/images/entities/char_e001.gif) C reflected the condensation degrees of polycyclic aromatic hydrocarbons (PAH) was denoted as Abs880/Abs1600, and the aromatic index (Iar) of mesophase pitch was defined as the formula: Abs3040/(Abs3040 + Abs2920).22 The calculated results suggested that Abs880/Abs1600 and Iar of mesophase pitch decreased with the adding of tetrahydronaphthalene (showed in Table 6), which implied that the alkyl structures in mesophase pitches rose with the raising amount of tetrahydronaphthalene. However, with the increase of polyethylene glycol, the two parameters decreased first and then increased, which meant that the alkyl structures contained in mesophase pitches increased first and then decreased with the adding of polyethylene glycol.
C reflected the condensation degrees of polycyclic aromatic hydrocarbons (PAH) was denoted as Abs880/Abs1600, and the aromatic index (Iar) of mesophase pitch was defined as the formula: Abs3040/(Abs3040 + Abs2920).22 The calculated results suggested that Abs880/Abs1600 and Iar of mesophase pitch decreased with the adding of tetrahydronaphthalene (showed in Table 6), which implied that the alkyl structures in mesophase pitches rose with the raising amount of tetrahydronaphthalene. However, with the increase of polyethylene glycol, the two parameters decreased first and then increased, which meant that the alkyl structures contained in mesophase pitches increased first and then decreased with the adding of polyethylene glycol.
| Sample | Abs880/Abs1600 | Iar | Ios |
|---|---|---|---|
| F-MP | 1.548 | 0.851 | 0.391 |
| T1-MP | 1.508 | 0.780 | 0.425 |
| T2-MP | 1.484 | 0.745 | 0.457 |
| T3-MP | 1.267 | 0.725 | 0.472 |
| T4-MP | 1.039 | 0.720 | 0.483 |
| E1-MP | 1.537 | 0.823 | 0.406 |
| E2-MP | 1.289 | 0.769 | 0.441 |
| E3-MP | 1.126 | 0.741 | 0.469 |
| E4-MP | 1.520 | 0.837 | 0.389 |
The ortho-substitution index (Ios), represented the relative size of aromatic molecules, was calculated according to the formula: Abs750/(Abs750 + Abs815 + Abs880). The results of Ios of mesophase pitches are listed in Table 6. The date suggested that the relative sizes of mesophase molecules increased with the raising amount of tetrahydronaphthalene, while it increased first and then decreased with the adding of polyethylene glycol. This phenomenon could be explained by the increase of alkyl structures in modified materials. The existence of an abundant of naphthenic structure or a certain amount of alkyl chains could help to maintain good fluidity of the reaction system, which was beneficial for the growth of aromatic molecules, so the relative sizes of mesophase molecules increased with the raising amount additives. But if there was an excess of alkyl chains (the amount of polyethylene glycol was 30 wt%), the high reaction rate and poor fluidity hindered the development of mesophase molecules. Therefore, the ortho-substitution index of E4-MP decreased.
3.5 1H NMR analysis of mesophase pitch
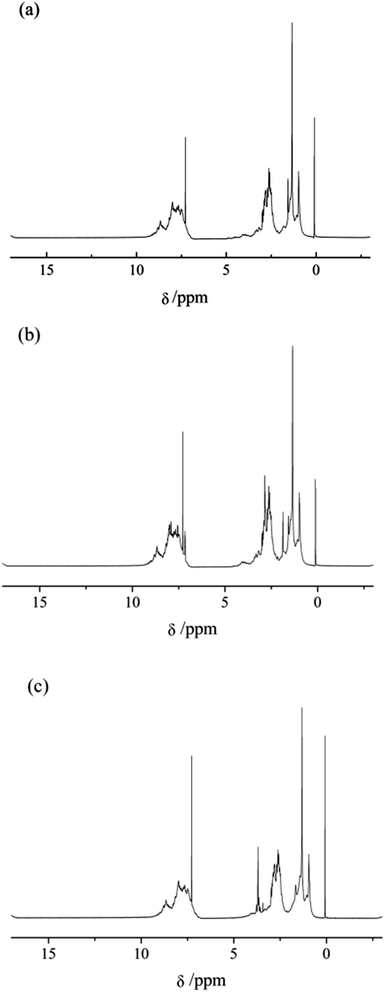
The excellent mesophase pitches T4-MP and E3-MP were chosen to be analyzed by 1H NMR. Fig. 6 present the 1H NMR spectra of the pyridine-soluble fractions of F-MP, T4-MP and E3-MP (labeled as F-MP-PS, T4-MP-PS and E3-MP-PS, respectively) and Table 7 summarized the hydrogen distribution.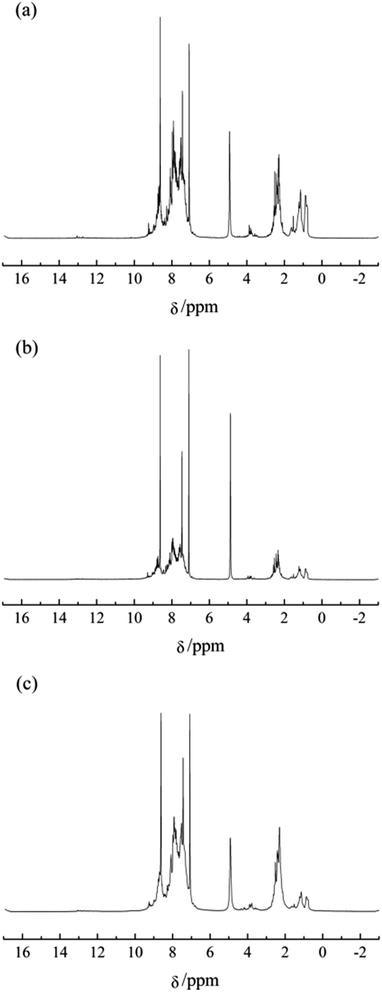 | ||
| Fig. 6 1H NMR spectra of pyridine-soluble fractions of mesophase pitches. (a) F-MP-PS, (b) T4-MP-PS and (c) E3-MP-PS. | ||
| Sample | Hydrogen contents/% | ||||
|---|---|---|---|---|---|
| Har | Hα | Hβ | Hγ | Hn | |
| F-MP-PS | 79.85 | 17.01 | 0.77 | 0.92 | 1.45 |
| T4-MP-PS | 74.32 | 14.34 | 0.64 | 0.86 | 9.84 |
| E3-MP-PS | 74.16 | 16.16 | 4.25 | 3.58 | 1.85 |
As shown in Table 7, the percent of Har hydrogens in T4-MP-PS and E3-MP-PS were higher than that in F-MP-PS obviously, which indicated that T4-MP-PS and E3-MP-PS possessed more alkyl structures than F-MP-PS. In contrast with F-MP-PS, the percent of Hα, Hβ and Hγ in T4-MP-PS decreased, while the percent of Hn increased significantly, which demonstrated that the added alkyl structures in T4-MP-PS were almost naphthenic structures. Additionally, the percent of Hα and Hn in E3-MP-PS changed little compared with F-MP-PS, while the percent of Hβ and Hγ increased. It implied that the incremental alkyl structures in E3-MP-PS were mainly alkyl chains. In conclusion, the naphthenic structure and alkyl chains contained in the modified materials partly remained in the mesophase pitches after the process of polymerization. Furthermore, considering the results of both optical texture and 1H NMR analyses of mesophase pitch, T4-MP possessed more ordered optical texture than E3-MP, that is to say, the modification effect of the naphthenic structure was superior to that of alkyl chain.
3.6 XRD analysis of mesophase pitch
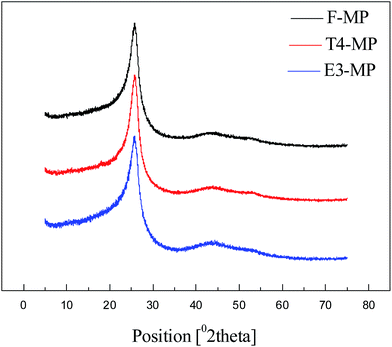
The X-ray diffraction patterns of the mesophase pitches F-MP, T4-MP and E3-MP are displayed in Fig. 7, and the microcrystalline parameters calculated from the XRD spectra are summarized in Table 8.| Sample | d002/Å | Lc/nm | n | Og |
|---|---|---|---|---|
| a Note: d002, interlayer spacings; Lc, stacking heights; n, layer numbers; Og, orientation degrees. | ||||
| F-MP | 3.72 | 2.28 | 7.69 | 0.902 |
| T4-MP | 3.47 | 3.07 | 10.87 | 0.967 |
| E3-MP | 3.56 | 2.76 | 9.01 | 0.943 |
As shown in Fig. 7, the peaks of aromatic layers (at 2θ ≈ 25.6) and crystal plane (at 2θ ≈ 43.0) were exhibited in the patterns,28 which suggested that the mesophase pitches F-MP, T4-MP and E3-MP were all well crystallized. Compared with F-MP, the interlayer spacings (d002) of T4-MP and E3-MP were narrower, the stacking heights (Lc) were higher, the layer numbers (n) became larger, and the orientation degrees (Og) were improved (shown in Table 8), which suggested that the mesophase pitches prepared by the modified materials became highly crystallized. Furthermore, the mesophase pitch T4-MP possessed better crystal structure than E3-MP: narrower interlayer spacing, higher stacking height, more aromatic molecular layers and improved orientation degree. This phenomenon implied that the feedstock modified by tetrahydronaphthalene was more beneficial to the preparation of mesophase pitch with ordered crystal structure compared to polyethylene glycol. It meant that the naphthenic structures in modified materials had a better effect in improving the crystal structure than alkyl chains.
3.7 Raman analysis of mesophase pitch
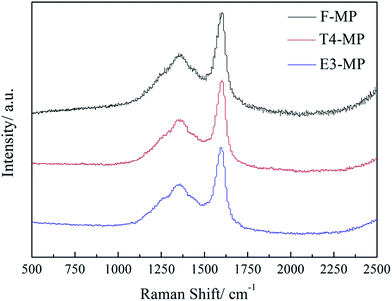
Fig. 8 exhibits the Raman spectra of mesophase pitches F-MP, T4-MP and E3-MP, and Table 9 lists the Raman parameters.| Sample | D/cm−1 | ID/IG | La (×10−2) |
|---|---|---|---|
| a Note: D, half-peak breadth; ID/IG, intensity ratio of D peak to G peak; La, crystal size. | |||
| F-MP | 55 | 0.4561 | 1.2059 |
| T4-MP | 41 | 0.4001 | 1.3728 |
| E3-MP | 45 | 0.4092 | 1.3452 |
As shown in Fig. 8, the D peak (near 1360 cm−1) and G peak (near 1580 cm−1) represented the disordered carbon and the typical graphite lattices were displayed in the spectra of F-MP, T4-MP and E3-MP. In contrast to F-MP, the half-peak breadth (D) of T4-MP and E3-MP were narrower, and the ID/IG ratio became lower, which demonstrated that the crystalline imperfection of the mesophase pitches generated by modified materials decreased.8,26 Meanwhile, the crystal sizes (La) became larger, indicating the improvement of incipient graphitization degrees. This phenomenon could be explained by the increase of alkyl structures in the mesophase pitches. As previously stated, the presence of naphthenic structures and alkyl chains could reduce viscosity and improve rheological property of the reaction system, so the aromatic molecules had enough time to coalesce and be arranged orderly. As a result, the crystal structure of mesophase pitches T4-MP and E3-MP were more ordered than that of F-MP. Furthermore, the mesophase pitch T4-MP possessed less crystalline imperfection and higher incipient graphitization degree than E3-MP, suggesting that the naphthenic structure were more helpful to improving the microcrystal structures of mesophase pitch compared to alkyl chains. It was consistent with the result of optical texture and XRD analyses.
In conclusion, the existence of an abundant of naphthenic structure or an appropriate amount of alkyl chains in the modified material contributed to the preparation of high quality mesophase pitch with large domain structure; low softening point, high carbon residue and ordered microcrystal structure.
4. Conclusion
The structural composition of feedstock has played a vital role in preparing mesophase pitch with high quality. The alkyl structures in modified materials treated by tetrahydronaphthalene and polyethylene glycol were mainly naphthenic structures and alkyl chains, respectively. Meanwhile, the mount of naphthenic structures and alkyl chains increased with the adding of modifying agents. Additionally, the mesophase pitches from modified materials possessed larger domain structure, lower softening point, higher carbon residue and more ordered microcrystal structure compared to the mesophase without treatment. Moreover, the improving effect of naphthenic structures in modified materials on the formation of mesophase was superior to that of alkyl chains. In short, an abundant of naphthenic structures or an appropriate amount of alkyl chains in the modified materials was helpful to the generation of mesophase pitch with high quality.Conflicts of interest
There are no conflicts to declare.Acknowledgements
This work was supported by the China National Petroleum Corporation Key Project of Research and Development [grant number: PRIKY16066], the Key R&D Project of Shandong [grant number: 2016GGX102017, 2016GGX107001, 2015GSF116008] and the Taishan Scholars Projects of Shandong [grant number: ts201511033].References
- K. Tate, H. Yoshida and K. Yanagida, Pitch for production of carbon fibers, US Pat. 4670129, 1987.
- B. Fathollahi, P. C. Chau and J. L. White, Injection and stabilization of mesophase pitch in the fabrication of carbon–carbon composites. Part I. Injection process, Carbon, 2005, 43, 125–133 CrossRef CAS.
- B. Fathollahi, P. C. Chau and J. L. White, Injection and stabilization of mesophase pitch in the fabrication of carbon-carbon composites: part II. Stabilization process, Carbon, 2005, 43, 131–141 Search PubMed.
- B. Fathollahi, B. Jones, P. C. Chau and J. L. White, Injection and stabilization of mesophase pitch in the fabrication of carbon-carbon composites. Part III: mesophase stabilization at low temperatures and elevated oxidation pressures, Carbon, 2005, 43, 143–151 CrossRef CAS.
- D. Liu, M. Li, F. J. Qu, R. Yu, B. Lou, C. C. Wu, J. P. Niu and G. K. Chang, Investigation on preparation of mesophase pitch by the co-carbonization of naphthenic pitch and polystyrene, Energy Fuels, 2016, 30, 2066–2075 CrossRef CAS.
- S. Kumar, M. Srivastava, S. Kumar and M. Srivastava, Catalyzing mesophase formation by transition metals, J. Anal. Appl. Pyrolysis, 2015, 112, 192–200 CrossRef CAS.
- C. Zeng, Q. L. Lin, C. Q. Fang, D. W. Xu and Z. C. Ma, Preparation and characterization of high surface area activated carbons from co-pyrolysis product of coal-tar pitch and rosin, J. Anal. Appl. Pyrolysis, 2013, 104, 372–377 CrossRef CAS.
- M. Li, D. Liu, B. Lou, X. L. Hou and P. Chen, Relationship between structural modification of aromatic-rich fraction from heavy oil and the development of mesophase microstructure in thermal polymerization process, Energy Fuels, 2016, 30, 8177–8184 CrossRef CAS.
- B. Lou, D. Liu, M. Li, X. L. Hou, W. Q. Ma and R. Q. Lv, Modified effects of additives to petroleum pitch on the mesophase development of the carbonized solid products, Energy Fuels, 2016, 30, 796–804 CrossRef CAS.
- M. Li, D. Liu, R. Q. Lv, J. S. Ye and H. Du, Preparation of the mesophase pitch by hydrocracking tail oil from a naphthenic vacuum residue, Energy Fuels, 2015, 29, 4193–4200 CrossRef CAS.
- M. Li, D. Liu, H. Du, Q. Y. Li, X. L. Hou and J. S. Ye, Preparation of mesophase pitch by aromatics-rich distillate of naphthenic vacuum gas oil, Appl. Petrochem. Res., 2015, 5, 339–346 CrossRef CAS PubMed.
- A. G. Alvasey, M. Martínez-Escandell, M. Molina-Sabio and F. Rodríguez-Reimoso, Pyrolysis of petroleum residues: Analysis of demicokes by X-ray diffraction, Carbon, 1999, 37, 1627–1637 CrossRef.
- P. Torregrosa-Rodríguez, M. Martínez-Escandell, F. Rodríguez-Reinoso, H. Marsh, C. Gómez-de-Salazar and E. R. Palazón, Pyrolysis of petroleum residuum II: Chemistry of pyrolysis, Carbon, 2000, 38, 535–546 CrossRef.
- S. Shin, J. Jang, S. H. Yoon and I. Mochida, A study on the effect of heat treatment on functional groups of pitch based activated carbon fiber using FTIR, Carbon, 1997, 35, 1739–1743 CrossRef CAS.
- M. Miyake, T. Ida, H. Yoshida, S. Wakisaka, M. Nomure and T. Nishizawa, Effects of reductively introduced alkyl groups and hydrogen to mesophase pitch on carbonization properties, Carbon, 1993, 705–714 CrossRef CAS.
- I. Mochida, Y. Korai, C. H. Ku, F. Watanabe and Y. Sakai, Chemistry of synthesis, structure, preparation and application of aromatic-derived mesophase pitch, Carbon, 2000, 38, 305–328 CrossRef CAS.
- Y. Korai, S. Ishida, S. H. Yoon, Y. G. Wang, I. Mochida, Y. Nakagawa, C. Yamaguchi, Y. Matsumura and M. Komatu, Preparation of mesocarbon microbeads by dispersing mesophase pitch in isotropic pitches, Carbon, 1997, 35, 1503–1515 CrossRef CAS.
- K. S. Yang, Y. A. Kim, K. H. An, S. H. Yoon, T. W. Son and I. Mochida, Modification of naphthalene-derived mesophase pitch with benzoquinone, Carbon, 1997, 35, 923–928 CrossRef CAS.
- Y. Korai and I. Mochida, Molecular assembly of mesophase and isotropic pitches at their fused states, Carbon, 1992, 30, 1019–1024 CrossRef CAS.
- K. E. Yoon, E. S. Lee, Y. Korai, I. Mochda, K. Yanagida and K. Take, Comparision of mesophase pitches derived from C8 and C9 aromatic hydrocarbons, Carbon, 1994, 32, 453–459 CrossRef CAS.
- Y. Q. Liu, X. E. Wang, A. B. Li, Z. Z. Liu and J. A. Liu, The simple method was to measure the softening point and the spinnability of pitch by penetrometer method, New Carbon Mater., 1994, 3, 30–31 Search PubMed.
- W. J. Liang, G. H. Que, C. G. Liu and Q. S. Yang, Petroleum chemistry, China university of petroleum press, ShanDong, 2009, vol. 106–109, pp. 54–78 Search PubMed.
- M. D. Guillen, M. J. Iglesias, A. Dominguez and C. G. Blanco, Semi-quantitative FTIR analysis of a coal tar pitch and its extracts and residues in several organic solvents, Energy Fuels, 1992, 6, 518–525 CrossRef CAS.
- P. Alvarez, N. Diez, C. Blanco, R. Santamaria, R. Menendez and M. Granda, An insight into the polymerization of anthracene oil to produce pitch using nuclear magnetic resonance, Fuel, 2013, 105, 471–476 CrossRef CAS.
- T. J. Morgan, P. Alvarez-Rodriguez, A. George, A. A. Herod and R. Kandiyoti, Characterization of Maya crude oil maltenes and asphaltenes in terms of structural parameters calculated from nuclear magnetic resonance (NMR) spectroscopy and laser desorption-mass spectroscopy (LD-MS), Energy Fuels, 2010, 24, 3977–3989 CrossRef CAS.
- T. J. Morgan and R. Kandiyoti, Pyrolysis of coals and biomass: Analysis of thermal breakdown and its products, Chem. Rev., 2014, 114, 1547–1607 CrossRef CAS PubMed.
- S. Kundu and A. A. Ogale, Microstructural effects on the dynamic rheology of a discotic mesophase pitch, Rheol. Acta, 2007, 46, 1211–1222 CrossRef CAS.
- S. Kundu, A. K. Naskar, A. A. Ogale, D. P. Anderson and J. R. Arnold, Observations on a low-angle X-ray diffraction peak for AR-HP mesophase pitch, Carbon, 2008, 46, 1166–1169 CrossRef CAS.
| This journal is © The Royal Society of Chemistry 2018 |

