 Open Access Article
A TPE–benzothiazole piezochromic and acidichromic molecular switch with high solid state luminescent efficiency†
Chunping Ma‡
ab,
Jiajun He‡c,
Bingjia Xud,
Gaoyi Xie *ef,
Zongliang Xiec,
Zhu Maoc and
Zhenguo Chi
 *c
*c
aKey Laboratory of Light Metal Materials Processing Technology of Guizhou Province, Guizhou Institute of Technology, Guiyang 550003, China
bSchool of Materials and Metallurgical Engineering, Guizhou Institute of Technology, Guiyang 550003, China
cPCFM Lab, GDHPPC Lab, Guangdong Engineering Technology Research Center for High-performance Organic and Polymer Photoelectric Functional Films, State Key Laboratory of OEMT, School of Chemistry and Chemical Engineering, Sun Yat-sen University, Guangzhou 510275, China. E-mail: chizhg@mail.sysu.edu.cn
dKey Laboratory of Theoretical Chemistry of Environment, Ministry of Education, School of Chemistry and Environment, South China Normal University, Guangzhou 510006, China
eCollege of Chemical Engineering, Guizhou Institute of Technology, Guiyang 550003, China. E-mail: xiegaoyi@126.com
fGuizhou Material Industry Technology Research Institute, Guiyang 550014, China. E-mail: xiegaoyi@126.com
First published on 7th February 2018
Abstract
A new organic compound, namely B-TPEAN, was constructed by using tetraphenylethylene, acrylonitrile and benzothiazole as building blocks. Herein, results of single crystal structure analysis and theoretical calculation for the as-synthesized compound were presented. Photophysical properties, including UV-visible absorption, photoluminescence and fluorescent quantum yield, were also well studied. B-TPEAN was found to show excellent aggregation-induced emission (AIE) properties and high quantum yield (up to 85%) in the solid-state. These results should be attributed to the positive effect of a combination of two typical AIE moieties in one molecule. Upon grinding, the emission color of the pristine sample for B-TPEAN changed from bluish green (λem,max = 497 nm) to yellow (λem,max = 567 nm), exhibiting a remarkable piezochromism. Moreover, by fuming with acid vapor, both of the pristine and the ground samples of B-TPEAN showed dramatic decreases in fluorescence quantum yields and large bathochromic shifts in PL maxima up to 53 nm and 80 nm, respectively, indicating a success in achieving multi-stimuli-responsive luminophore with high contrast in both emission intensity and color. Further investigation revealed that the acidifluorochormism of the samples was caused by the protonation of the benzothiazole moiety, leading to an enhancement of ICT effect in the protonated molecules.
1. Introduction
Fluorescent materials which can change their color upon exposure to different environmental stimuli, such as light,1 acids/bases,2–4 electricity,5 mechanical force6–8 etc., are of great importance for their potential applications in sensors, memory devices and switches. To achieve the above applications, strong emission of fluorescent materials in the solid state is required. Unfortunately, most of the organic dyes quench or weaken their fluorescence in the aggregation state, due to the notorious aggregation caused quenching (ACQ) effect.9,10 For example, Li et al.11 reported that an imide dye based on tetrahydro[5]helicene skeleton exhibited remarkable and reversible acid/base stimulated fluorescence switching properties in both solution and solid state. However, the quantum yield of the compound in solid state (7.4%) was much lower than that in solution (75.2% in cyclohexane and 72.6% in toluene). A strategy to overcome the ACQ effect is to let the aggregation play positive instead of negative roles in enhancing the efficiency in molecule emission.12 The substances with anti-ACQ property are called aggregation-induced emission (AIE) compounds. A class of AIE azobenzene derivatives prepared by Han et al.3 could turn their emission from a twisted intramolecular charge transfer (TICT) state to a locally excited (LE) state upon alkali treatment. The spectral change could be rehabilitated through thermal treatment. Unfortunately, the quantum yields (2.4–6.7%) of the azobenzene derivatives were still low.Tetraphenylethylene (TPE), due to its propeller-shaped molecular structure, is non-emissive in solution but becomes highly emissive in aggregated state.13 Therefore, TPE derivatives with varied optical properties have been hotly investigated.14–17 Recently, we have also presented a TPE-base luminophore, i.e. TPENSOH, which contains a functional group of 6-hydroxybenzothiazole. This new compound showed a remarkable and reversible four-color switch based on the piezo and protonation–deprotonation control in the solid state.18 Although TPENSOH exhibited stronger luminescence in comparison with most of the acid/base-stimuli-responsive emitters, its fluorescence quantum yield (around 0.3) remain moderate among the whole AIEgen family. As reported previously,1,17,19,20 aromatic-substituted acrylonitrile derivatives have been proved to be AIE-active and possess a strong fluorescence emission in solid-state. Furthermore, combining two AIE moieties in a single molecule probably can endow the luminophore with stronger fluorescence emission. Accordingly, an acrylonitrile group was introduced to link a TPE and a benzothiazole fragments to create a novel molecule of B-TPEAN, which contains two typical AIE moieties. It is expected that the well-designed compound could show multi-color fluorescent switch with even higher quantum yield. The molecular structure of B-TPEAN was fully characterized by 1H NMR, 13C NMR, FT-IR, mass spectra and single-crystal X-ray diffraction analysis. The optical properties of B-TPEAN were measured by UV-visible absorption spectroscopy and fluorescence spectroscopy. The piezochromism of B-TPEAN was discussed based on the results of PXRD and DSC measurements, which were also used to characterize the changes of aggregation structures.
2. Materials and methods
2.1 Material
1-Bromo-1,2,2-triphenylethene (P3Br), 4-formylphenylboronic acid, tetrabutyl ammonium bromide (TBAB), tetrakis(triphenylphosphine)palladium [Pd(PPh3)4], benzothiazole-2-acetonitrile and tetrabutylammonium hydroxide were purchased from Alfa Aesar and were used as received. Potassium carbonate (K2CO3), potassium hydroxide (KOH), toluene, ethanol were purchased as analytical grade from Sinopharm Chemical Reagent Co., Ltd (Shanghai, China) and used without further purification.2.2 General procedure for B-TPEAN
The compound of P4A was prepared by using a previous literature method.172.3 Characterization
1H NMR and 13C NMR spectra were measured on a Mercury-Plus 300 spectrometer [CDCl3 as solvent and tetramethylsilane (TMS) as the internal standard]. FT-IR analyses were carried out on a Nicolet NEXUS 670 spectrometer (KBr pellet). Mass spectra (MS) were obtained via a Thermo DSQ MS spectrometer (ionization method: EI). UV-visible absorption spectra (UV-vis) were performed on a Hitachi U-3900 spectrophotometer. Fluorescence spectra (PL) were determined on a Shimadzu RF-5301PC spectrometer with a slit width of 1.5 nm for excitation and 3 nm for emission. Differential scanning calorimetry (DSC) on a NETZSCH thermal analyzer (DSC 204F1) was used to investigate thermal behaviors at both heating and cooling rates of 10 °C min−1 under a N2 atmosphere. Time-resolved emission decay behaviors were measured on an Edinburgh Instruments Ltd spectrometer (FLS 920). Powder X-ray diffraction (PAXD) measurements were performed at 293 K on a Bruker X-ray diffractometer (D8 ADVANCE, Germany) with an X-ray source of Cu Kα (λ = 0.15406 nm) at 40 kV and 40 mA, at a scan rate of 6° (2θ) per min. Fluorescence quantum yields of solid powders were measured on an integrating sphere (C-701, Labsphere Inc.), with a 405 nm Ocean Optics LLS-LED as the excitation source, and the light was introduced into the integrating sphere through optical fiber.The single crystal of the compound was grown from a dichloromethane/ethanol mixture through slow volatilization. X-Ray crystallographic intensity data were collected from an Agilent Technologies Gemini A Ultra system with Cu-Kα radiation (λ = 1.54178 Å) at 150.01(10) K. The structure was solved by the direct methods following difference Fourier syntheses, and refined by the full-matrix least-squares method against F2 using SHELXTL software (CCDC 1509687†). The pictures of the structure were produced using Diamond 3.1.
TD-DFT calculations of electronic cloud density distribution based on the single crystal structure were performed on Gaussian 09 program at the B3lyp 6-311+g(d,p) level of the theory.
3. Results and discussion
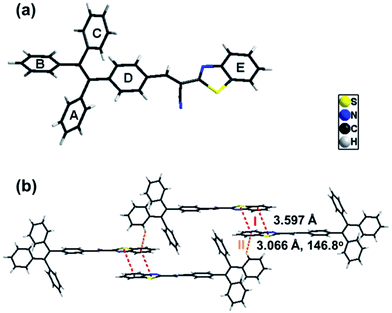
The synthetic routes of B-TPEAN are illustrated in Scheme 1. Briefly, B-TPEAN was synthesized by the Suzuki and the Knoevenagel condensation reactions. The chemical structure of B-TPEAN was confirmed by 1H NMR, 13C NMR, FT-IR and MS analyses (Fig. S1–S4, ESI†). The temperature of weight loss at 5% under nitrogen was determined to be 362 °C (Fig. S5, ESI†), indicating that B-TPEAN has high thermal stability.Single crystals of B-TPEAN were obtained by using the slow volatilization method and the crystal structure was determined by single-crystal X-ray diffraction analysis. As depicted in Table 1, the single crystal of B-TPEAN belongs to the monoclinic system. While the single molecular conformation and the intermolecular interactions are illustrated in Fig. 1, the dihedral angles between the aryl rings as defined in Fig. 1(a) were calculated and collected in Table 2. The TPE moiety of B-TPEAN in single crystal structure shows a twisted conformation and thereby no obvious π⋯π interaction was observed between any phenyl rings of the neighboring TPE moieties (Fig. 1(a)). Instead, one of the phenyl rings of TPE forms weak C–H⋯π (tail-to-head) interaction with the phenyl ring of benzothiazole in the neighbouring molecule (Fig. 1(b)).
| a R1 = Σ||Fo| − |Fc||/Σ|Fo|.b wR2 = [Σ[w(Fo2 − Fc2)2]/Σw(Fo2)2]1/2, where w = 1/[σ2(Fo)2 + (aP)2 + bP] and P = (Fo2 + 2Fc2)/3. | |
|---|---|
| Compound | B-TPEAN |
| Formula | C36H24N2S |
| fw | 516.63 |
| Crystal system | Triclinic |
| T (K) | 150.01(10) |
| Space group | P![[1 with combining macron]](https://www.rsc.org/images/entities/char_0031_0304.gif) |
| a/Å | 10.3022(6) |
| b/Å | 10.3149(7) |
| c/Å | 13.7990(8) |
| α/° | 110.494(6) |
| β/° | 96.161(5) |
| γ/° | 98.769(5) |
| V/Å3, Z | 1336.89(14), 2 |
| F (000) | 522 |
| Crystal size/mm3 | 0.32 × 0.20 × 0.15 |
| Reflns collected/unique (Rint) | 7270/4349 (Rint = 0.0187) |
| Obsd reflns [I ≥ 2σ(I)] | 3743 |
| Data/restraints/parameter | 4349/0/352 |
| Dc/mg m−3 | 1.239 |
| μ/mm−1 | 1.286 |
| Goodness-of-fit on F2 | 1.032 |
| R1,a wR2b [I ≥ 2σ(I)] | 0.0320/0.0798 |
| R1, wR2 (all data) | 0.0392/0.0845 |
| Plane | Dihedral angle/° | Plane | Dihedral angle/° |
|---|---|---|---|
| A–B | 56.6 | B–D | 79.6 |
| A–C | 76.6 | C–D | 59.8 |
| A–D | 75.1 | D–E | 2.9 |
| B–C | 74.1 |
On the other hand, the benzothiazole moieties of two adjacent molecules adopt antiparallel coupling (dihedral angle 0.25°) and form strong π⋯π (tail-to-tail) interaction with each other. Such stable molecular conformation and intermolecular interactions could efficiently block the non-radiative pathways (rotation) of the excitons, which is beneficial for harvesting high B-TPEAN fluorescent quantum yield.
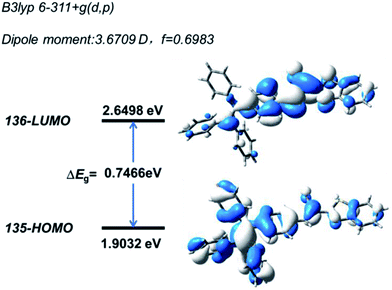
Quantum mechanical calculations based on the density functional theory were performed to investigate the electron transition behavior of B-TPEAN. As shown in Fig. 2, the highest occupied molecular orbital (HOMO) of B-TPEAN shows dispersed electron cloud distribution at the TPE moiety, whereas the electron cloud of the lowest unoccupied molecular orbital (LUMO) is principally located at the vinyl group of the AN moiety and the neighbouring benzene ring of the TPE moiety. The B-TPEAN molecule showed large dipole moment (3.6709 D) and high oscillator strength (f = 0.6983), implying strong intramolecular electron push–pull effect and high fluorescent quantum yield of B-TPEAN. These theoretical calculation results suggested that B-TPEAN had ICT characteristics, from the TPE (donor) moiety to the benzothiazole (acceptor) moiety. In other words, benzothiazole is electron-withdrawing compared with the TPE moiety.
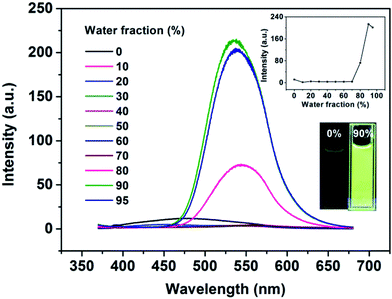
To determine the AIE feature of B-TPEAN, the emission behavior of the compound in solvent-nonsolvent system was investigated. Fig. 3 shows the PL emission spectra of the luminophore in THF/water mixtures with different water fractions. Under the illumination of UV lamp, the THF solution of B-TPEAN showed a very weak bluish-green fluorescence centered at 475 nm. When water was added, the fluorescence was even quenched, probably due to the TICT effect. However, when the water fraction increased to 80%, strong yellow-green fluorescence (∼540 nm) appeared. The photoluminescence (PL) intensity of the B-TPEAN THF/water mixture with 90% (v/v) water fraction (∼213 a.u.) was increased by up to almost 20 times as compared with that of the pure THF solution (∼11 a.u.), implying a remarkable AIE phenomenon. When the water fraction further increased (95%), the PL intensity of the mixture decreased slightly, attributed to the increased size of the B-TPEAN aggregates, which reduced the number of the emission molecules on the surface of the nanoparticles.21
Fig. 4 presents UV-vis absorption spectra of the B-TPEAN mixtures noted above. The spectral profiles significantly changed when the water fraction was higher than 80%. Two absorption peaks red shifted from 315 nm to 320 nm and from 402 nm to 415 nm, respectively. Moreover, the UV-visible absorption spectra showed a Mie scattering effect for the mixtures, which proved the existence of nanoparticles. The results of UV-visible absorption corresponded well with the changes of PL spectra, thus indicating that the emission enhancement of B-TPEAN at high water content was caused by molecular aggregation. In other words, B-TPEAN is AIE-active.
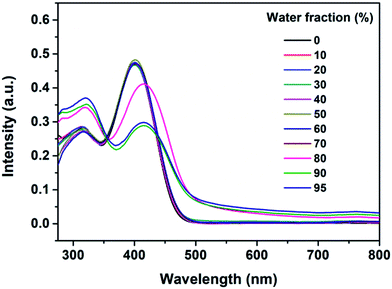 | ||
| Fig. 4 UV-visible spectra of the dilute solutions of B-TPEAN in THF/water mixtures with different water fractions (concentration: 10 μM). | ||
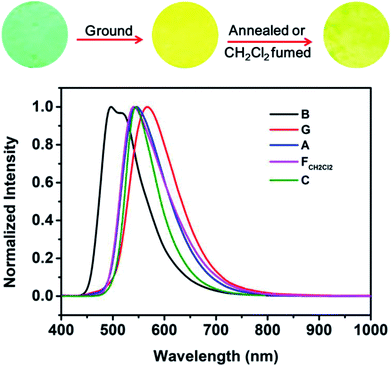
The AIE characteristic of B-TPEAN encouraged us to investigate its emission behavior in the solid state. As shown in Fig. 5, the pristine B-TPEAN solid powder (B) exhibits a strong blue-green-light emission centered at 497 nm, with a high fluorescence quantum yield of 50%. After being ground by a pestle or sheared by a spatula, the resultant powder (G) emitted a yellow-light and the corresponding fluorescence quantum yield decreased (ΦF,s = 42%) slightly. Meanwhile, the PL maximum of B-TPEAN shifted to 567 nm, exhibiting a remarkable emission wavelength change of 70 nm. Many piezochromic compounds could recover their emission colors upon heating or solvent fuming.17,22–24 In this system, after being heated (130 °C) or fumed with CH2Cl2, the resultant B-TPEAN powders (A and FCH2Cl2, respectively) displays a yellow-green light emission centered at 541 nm or 545 nm, respectively, which is almost the same with that of the single crystal (C) of B-TPEAN (centered at 544 nm). These color changes seem to be irreversible under these treatment conditions. However, unexpectedly, even higher fluorescence quantum yields were observed for the annealed sample (ΦF,s = 57%) and the fumed sample (ΦF,s = 85%). To gain an understanding for these phenomena, PXRD and DSC were carried out for the samples of B-TPEAN.
Fig. 6 shows the PXRD patterns of the B-TPEAN powders. The B powder exhibits sharp and intense reflections. Upon grinding, the intensity of PXRD pattern decreased, indicating that the crystalline phase of B-TPEAN almost converted to amorphous phase, which would reduce the quantum yield of the ground powder. However, the ground sample is a metastable state, and it will rapidly crystallize again if it is annealed or fumed by CH2Cl2. Interestingly, compared with the B powder, both of the PXRD patterns for A and FCH2Cl2 are totally different, but are accorded well with the PXRD pattern of the C powder. It seems that the crystal state of the B powder is unstable and would convert to a new one by grinding and subsequent annealing/fuming treatments. To verify this hypothesis, differential scanning calorimetry (DSC) was also performed to investigate to the thermal behaviors of B-TPEAN. As illustrated in Fig. 7, the B powder shows an obvious endothermal peak at 205 °C. However, for the G powder, the intensity of the endothermal peak (∼203 °C) decreased. Furthermore, an additional exothermal peak at approximately 110 °C was observed, fully demonstrating that the microcrystals of the ground sample were partially destroyed and converted to the amorphous state by grinding treatment. An exothermal peak (∼205 °C), which could be assigned to a cold crystallization peak, and a new endothermal peak at a higher temperature (∼217 °C) was also observed, suggesting that a more stable crystal structure of B-TPEAN was formed. The appearance of the latter endothermal peak might be attributed to the heating measurement, which induced crystallization of B-TPEAN. Indeed, after annealing or fuming treatment, an obvious endothermal peak at 217–218 °C was also observed, whereas the endothermal peak at 205 °C almost disappeared. More importantly, the C powder also shows its endothermal peak at 218 °C, revealing that the thermal behaviors of the A and FCH2Cl2 powders are similar with that of the C powder, but not the B powder. The PXRD and DSC results demonstrate that the crystal structures of A and FCH2Cl2 powders are completely different from that of the B powder, giving a rational explanation for the emission behaviors of the B-TPEAN powders.
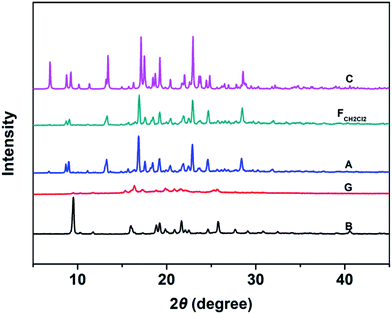 | ||
| Fig. 6 The PXRD patterns of B-TPEAN: (B) the pristine powder, (G) ground powder from B, (A) annealed (130 °C, 15 min) powder from G; (FCH2Cl2) CH2Cl2 fumed (10 min) powder from G; (C) single crystal. | ||
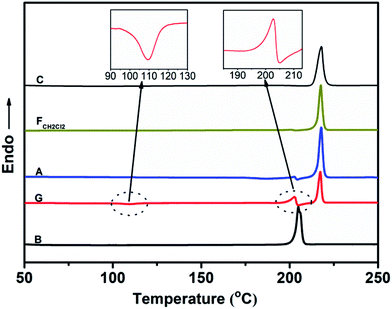 | ||
| Fig. 7 DSC curves of B-TPEAN: (B) the pristine powder, (G) ground powder from B, (A) annealed (130 °C, 15 min) powder from G; (FCH2Cl2) CH2Cl2 fumed (10 min) powder from G; (C) single crystal. | ||
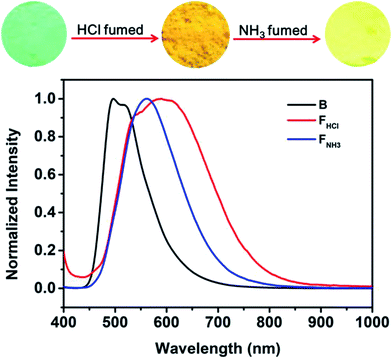
Considering that benzothiazole moiety can be easily protonated by acid and then change the PL emission of the compound,18 the emissions of the original and ground samples of B-TPEAN were investigated after treating with acid vapor. As can be seen in Fig. 8, when the B powder was exposed to a HCl vapor for 1 hour, the luminescence changed from an initial strong blue-green light to a weak orange light with a relatively low ΦF,s value (15%), which is less than one-third of the one for the B powder. Furthermore, the PL spectrum of the FHCl powder red shifted to 550 nm with a broad emission band. The decrease in fluorescence quantum yield and the red-shift of PL spectrum for the FHCl sample should be attributed to the protonation of the benzothiazole moiety, leading to the enhancement of intramolecular charge transfer (ICT) from the TPE unit to the benzothiazole moiety. As a result, stronger intermolecular interactions were formed.18,25 Subsequently, the FHCl powder was exposed to a NH3 vapor for 30 min and the resultant powder (FNH3) was found to emit a bright yellow light with a very high ΦF,s value (74%), confirming the quenching effect of the protonation process. It is worth to note that the whole PL emission band of the FNH3 sample overlapped a part of the broad spectrum of the FHCl sample. This might be caused by the tight molecular packing of B-TPEAN in the pristine crystalline powder, which gave rise to a slightly low protonation efficiency of B-TPEAN.
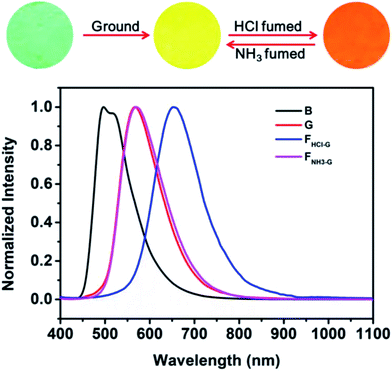
As noted above, grinding treatment could destroy the crystal structure of the pristine B-TPEAN. Therefore, we proposed that the G powder would be much easier to be protonated by the acid vapor. As expected, when the G powder was exposed to HCl vapor for about 20 min (FHCl-G), the fluorescence of the powder changed to be orange (ΦF,s = 9%) and a narrow PL emission band centered at 654 nm was recorded (Fig. 9). Notably, by fuming with the NH3 vapor for 10 min (FNH3-G), the fluorescence of the protonated ground sample could completely reverse back to yellow (ΦF,s = 50%), which agreed well with that of the G powder. The large bathochromic shift up to 87 nm in emission maxima and the recovery toward the initial state fully demonstrate that the ground sample of B-TPEAN exhibit remarkable and reversible fluorescent switching under the stimuli of acid and base vapor, which is promising in bioimaging and anti-counterfeit applications.
4. Conclusions
A TPE derivative, namely B-TPEAN, was synthesized through the reaction of Knoevenagel condensation in high yield (>90%). B-TPEAN showed prominent AIE property that the PL intensity of the mixture with 90% (v/v) water content was increased by up to almost 20 times as compared with that of at a water fraction of 0%. In solid state, the B-TPEAN powders have much higher fluorescent quantum yields (up to 85%) in comparison with most of the documented luminophores due to the rational combination of two typical AIE moieties (i.e. TPE and aryl-substituted acrylonitrile). PXRD and DSC analysis revealed that, the pristine sample of B-TPEAN was crystalline and metastable. Upon grinding and then annealing or fuming with CH2Cl2 vapor, the original sample could convert to a new packing mode. Moreover, under the stimulus of acid vapor, both of the pristine and the ground samples of B-TPEAN exhibit remarkable red-shift in PL maxima and dramatical decrease in emission quantum yields because of the stronger ICT effect in the protonated molecules. Additionally, compared to the pristine crystals, the ground sample of B-TPEAN in amorphous state was much easier to be protonated by HCl vapor. This work offers a new strategy to prepare multi-stimuli-responsive fluorescent switches with high contrast in emission color and high quantum yield.Conflicts of interest
There are no conflicts to declare.Acknowledgements
These authors contributed equally to the preparation of this work. This research was supported by the National Science Foundation of China (Nos. 51503046, 51603233, 51473185 and 51603232), 863 Program (SS2015AA031701), the Guizhou Province Science and Technology Planning Project (Nos. [2015]2068 and [2015]2078) and the Research Project for High-level Talents of Guizhou Institute of Technology (XJGC201503).References
- J. W. Chung, S.-J. Yoon, S.-J. Lim, B.-K. An and S. Y. Park, Angew. Chem., Int. Ed., 2009, 48, 7030–7034 CrossRef CAS PubMed.
- J. Zhang, J. Chen, B. Xu, L. Wang, S. Ma, Y. Dong, B. Li, L. Ye and W. Tian, Chem. Commun., 2013, 49, 3878–3880 RSC.
- L. Hu, Y. Duan, Z. Xu, J. Yuan, Y. Dong and T. Han, J. Mater. Chem. C, 2016, 4, 5334–5341 RSC.
- Z. Zeng, J. Wen, H. Yan, Z. Liu, Y. Xu, H. Li, C. Zhong, F. Liu and S. Sun, RSC Adv., 2016, 6, 37385–37390 RSC.
- H. Niu, P. Luo, M. Zhang, L. Zhang, L. Hao, J. Luo, X. Bai and W. Wang, Eur. Polym. J., 2009, 45, 3058–3071 CrossRef CAS.
- W. Liu, S. Ying, Q. Sun, X. Qiu, H. Zhang, S. Xue and W. Yang, Dyes Pigm., 2016, 125, 8–14 CrossRef CAS.
- M. Zheng, M. Sun, Y. Li, J. Wang, L. Bu, S. Xue and W. Yang, Dyes Pigm., 2014, 102, 29–34 CrossRef CAS.
- K.-Y. Zhao, G.-G. Shan, Q. Fu and Z.-M. Su, Organometallics, 2016, 35, 3996–4001 CrossRef CAS.
- R. Jakubiak, C. J. Collison, W. C. Wan, L. J. Rothberg and B. R. Hsieh, J. Phys. Chem. A, 1999, 103, 2394–2398 CrossRef CAS.
- S. W. Thomas, G. D. Joly and T. M. Swager, Chem. Rev., 2007, 107, 1339–1386 CrossRef CAS PubMed.
- M. Li, Y. Niu, H.-Y. Lu and C.-F. Chen, Dyes Pigm., 2015, 120, 184–189 CrossRef CAS.
- M. Chen, L. Li, H. Nie, J. Tong, L. Yan, B. Xu, J. Z. Sun, W. Tian, Z. Zhao and A. Qin, Chem. Sci., 2015, 6, 1932–1937 RSC.
- Y. Dong, J. W. Y. Lam, A. Qin, J. Liu, Z. Li, B. Z. Tang, J. Sun and H. S. Kwok, Appl. Phys. Lett., 2007, 91, 011111 CrossRef.
- Q. Qi, X. Fang, Y. Liu, P. Zhou, Y. Zhang, B. Yang, W. Tian and S. X.-A. Zhang, RSC Adv., 2013, 3, 16986–16989 RSC.
- Q. Qi, Y. Liu, X. Fang, Y. Zhang, P. Chen, Y. Wang, B. Yang, B. Xu, W. Tian and S. X.-A. Zhang, RSC Adv., 2013, 3, 7996–8002 RSC.
- T. Jadhav, B. Dhokale, Y. Patil, S. M. Mobin and R. Misra, J. Phys. Chem. C, 2016, 120, 24030–24040 CAS.
- B. Xu, M. Xie, J. He, B. Xu, Z. Chi, W. Tian, L. Jiang, F. Zhao, S. Liu, Y. Zhang, Z. Xu and J. Xu, Chem. Commun., 2013, 49, 273–275 RSC.
- C. Ma, B. Xu, G. Xie, J. He, X. Zhou, B. Peng, L. Jiang, B. Xu, W. Tian, Z. Chi, S. Liu, Y. Zhang and J. Xu, Chem. Commun., 2014, 50, 7374–7377 RSC.
- B.-K. An, S.-K. Kwon, S.-D. Jung and S. Y. Park, J. Am. Chem. Soc., 2002, 124, 14410–14415 CrossRef CAS PubMed.
- B.-K. An, D.-S. Lee, J.-S. Lee, Y.-S. Park, H.-S. Song and S. Y. Park, J. Am. Chem. Soc., 2004, 126, 10232–10233 CrossRef CAS PubMed.
- S. Dong, Z. Li and J. Qin, J. Phys. Chem. B, 2009, 113, 434–441 CrossRef CAS PubMed.
- Y. Dong, J. Zhang, X. Tan, L. Wang, J. Chen, B. Li, L. Ye, B. Xu, B. Zou and W. Tian, J. Mater. Chem. C, 2013, 1, 7554–7559 RSC.
- G.-G. Shan, H.-B. Li, H.-Z. Sun, D.-X. Zhu, H.-T. Cao and Z.-M. Su, J. Mater. Chem. C, 2013, 1, 1440–1449 RSC.
- G.-G. Shan, H.-B. Li, H.-T. Cao, D.-X. Zhu, P. Li, Z.-M. Su and Y. Liao, Chem. Commun., 2012, 48, 2000–2002 RSC.
- J. Chen, S. Ma, J. Zhang, L. Wang, L. Ye, B. Li, B. Xu and W. Tian, J. Phys. Chem. Lett., 2014, 5, 2781–2784 CrossRef CAS PubMed.
Footnotes |
| † Electronic supplementary information (ESI) available: 1H NMR (Fig. S1), 13C NMR (Fig. S2), MS (Fig. S3), FTIR (Fig. S4) spectra and TGA curve (Fig. S5) of B-TPEAN. CCDC 1509687. For ESI and crystallographic data in CIF or other electronic format see DOI: 10.1039/c7ra12655g |
| ‡ These authors contributed equally to the preparation of this work. |
| This journal is © The Royal Society of Chemistry 2018 |


![[thin space (1/6-em)]](https://www.rsc.org/images/entities/char_2009.gif) :
: