 Open Access Article
Sulfur encapsulated in thermally reduced graphite oxide as a cathode for Li–S batteries†
Xinbo Xua,
Jiafeng Ruana,
Yuepeng Pangab,
Tao Yuanab and
Shiyou Zheng *ab
*ab
aSchool of Materials Science and Engineering, University of Shanghai for Science and Technology, Shanghai 200093, China. E-mail: syzheng@usst.edu.cn
bShanghai Innovation Institute for Materials, Shanghai 200444, China
First published on 31st January 2018
Abstract
Rechargeable Li–S batteries are receiving ever-increasing attention due to their high theoretical energy density and inexpensive raw sulfur materials. However, their practical applications have been hindered by short cycle life and limited power density owing to the poor electronic conductivity of sulfur species, diffusion of soluble polysulfide intermediates (Li2Sn, n = 4–8) and the large volume change of the S cathode during charge/discharge. Optimizing the carbon framework is considered as an effective approach for constructing high performance S/carbon cathodes because the microstructure of the carbon host plays an important role in stabilizing S and restricting the “shuttle reaction” of polysulfides in Li–S batteries. In this work, reduced graphite oxide (rGO) materials with different oxidation degree were investigated as the matrix to load the active material by an in situ thermally reducing graphite oxide (GO) and intercalation strategy under vacuum at 600 °C. It has been found that the loaded amount of S embedded in the rGO layer for the S/carbon cathode and its electrochemical performance strongly depended on the oxidation degree of GO. In particular, on undergoing CS2 treatment, the rGO–S cathode exhibits extraordinary performances in Li–S batteries. For instance, at a current density of 0.2 A g−1, the optimized rGO–S cathode shows a columbic efficiency close to 100% and retains a capacity of around 750 mA h g−1 with progressive cycling up to over 250 cycles.
1. Introduction
With the increasing demands for high capacity energy storage systems, a considerable amount of effort has recently been focused on the development of Li–S batteries due to their high theoretical specific capacity of 1675 mA h g−1 and theoretical specific energy of 2600 W h kg−1; moreover, sulfur is also abundant, inexpensive, and environment-friendly.1–3 Regardless of these attractive properties, the widespread application of Li–S batteries has been significantly hindered by the poor cyclic stability and low power densities of S cathodes. S has a poor electrical conductivity of 5 × 10⁻³⁰ S cm−1 at room temperature. The volume change of ∼80% during the charge/discharge process may lead to structural instability and mechanical failure of the electrode. Another critical issue is the dissolution of polysulfide intermediates (Li2Sn, n = 4–8) in the liquid electrolyte, which migrate between the anode and cathode (shuttling effect), subsequently resulting in a rapid capacity loss and a low coulombic efficiency.2–4In order to alleviate the above issues, many efforts have been made to explore novel structures and materials for the S cathode, interlayer, electrolyte, and separator for Li–S batteries. The electrolyte materials have been modified to improve the stability of electrochemical reactions.5–7 New materials have been developed as interlayers and separators that can help the restrained polysulfide shuttling to large extents by preventing polysulfides from diffusing to the anode.8–12 The vast majority of the above studies were focused on sulfur cathode materials. In the studies of cathode materials, attempts have been made with progress on caging the active material in different matrices, such as carbon-based materials, conducting polymers, and metal oxides.13–21
Among the carbon materials, graphene has become one of research hotspots in the recent years owing to its superior electronic conductivity, large surface area, and intriguing mechanical properties, etc.22–24 Thus it can be applied as an ideal candidate for loading active materials in battery applications. Usually, graphene was prepared by a Hummers oxidation method. It was reported that oxygen functional groups on the graphene oxide could anchor S species to the nanosheets through chemical adsorption, which resulting in the improvement of cycle performance of the sulfur based cathode in Li–S cathodes.25–27 There have been a lot of works focusing on fabricating graphene–S composite cathodes for Li–S batteries. Ji et al. coated the uniform sulfur layers on graphene oxide sheets by a simple chemical reaction. Benefited from the reactive functional groups, polysulfides and sulfur could be binded strongly on the carbon sheets, which enabled a high reversible capacity and stable cycling performance for 50 cycles at 0.1C.28 Wang et al. prepared functionalized reduced graphene oxide as substrate structure for S, especially, after being modified in ethylenediamine, carbon showed much stronger covalent binding energy to sulfur and its discharge products, and the reduced graphene oxide–S composites showed stable capacity retention of 80% after 350 cycles and high-rate capacity of 480 mA h g−1 at 4C.29 To further improve the interface kinetic structure between sulfur and graphene sheets, Zhang et al. prepared a layer structure S/PPy/graphene composite cathode which showed high S utilization and interfacial stabilization.30 Zhang et al. obtained an S–reduced graphene oxide hybrid by bubbling concentrated H2S gas into a graphene oxide aqueous suspension at 70 °C.31 This method could realize the reduction of graphene oxide and form the graphene–S hybrid in one step. Although grapheme oxide is the most frequently used precursor for the preparation of graphene and its derived materials, it suffers from poor conductivity due to the destruction of the continuous sp2 hybridized network by abundant O-containing groups. Functionalization of graphene is an efficient way to enhance the conductivity and hence the electrochemical performance of the sulfur/graphene cathode. Zu et al. applied hydroxylated graphene nanosheets as a substrate for capturing amorphous S nanoparticles by an in situ deposition method at room temperature.32 In the synthesis of the S–hydroxylated graphene composite, graphene sheets were firstly grafted with hydroxyl groups by a modified hydrothermal treatment. With similar precursor of reduced graphite oxide, Zhou et al. use sealing thermal method to embed S8 molecule into graphite oxide at 155 °C for 4 h, the rGO–S composite delivers an initial discharge capacity of 792 mA h g−1 and the coulombic efficiency was 65.8%, retains capacity of 392 mA h g−1 after 200 cycles.33
It is well known that the graphite oxide is an isolated multilayer graphene oxide. The multilayer structures are more suitable for sulfur carrier. Herein, a facile one-step solid-state method was employed to prepare the reduced graphite oxide/sulfur (rGO–S) composite. We directly heat the ground mixture of sulfur powder with graphite oxides. After heat treatment process, graphite oxide (GO) was reduced, and a homogeneous composite containing sulfur simultaneously formed. In this work, a series of graphite oxides with different oxidation degree were prepared successfully by using Hummer method through adjustment of dose of oxidant. The rGO with different oxidation degree were investigated as matrix to load active material by in situ thermal-reducing graphite oxide (GO) and intercalating strategy under vacuum at 600 °C. It has been found that the loading amount of S embedded in the rGO layer for the S–carbon cathode and its electrochemical performance were strongly affected by the oxidation degree of GO. The reversible capacity of the optimized rGO–S cathode with a high S content (∼80%) retains around 820 mA h g−1 after 100 charge/discharge cycles and the coulombic efficiency is close to 100% at a current density of 0.2 A g−1. The structural features of GO were characterized by Fourier transform infrared spectroscopy (FTIR), Raman spectroscopy, wide-angle X-ray diffraction (XRD), X-ray photoelectron spectroscopy (XPS), transmission electron microscopy (TEM).
2. Experimental
2.1. Materials
Natural graphite powder, hydrogen peroxide (H2O2) and sodium nitrate (NaNO3) concentrated sulfuric acid (H2SO4), potassium permanganate (KMnO4) and hydrochloric acid (HCl) were analytical grade from Shanghai Aladdin Biochemical Technology Co. Ltd., Shanghai, China, and were adopted as received without further purification.2.2. The synthesis of graphite oxide
According to the traditional Hummers method, graphite oxide (GO) was prepared from natural graphite powder by the oxidation of KMnO4 with different content in the concentrated H2SO4.34 Natural graphite powder (1 g) and NaNO3 (0.5 g) were added into the concentrated H2SO4 (23 ml). 2 g, 3 g, 4 g, 5 g, 8 g KMnO4 were used and the corresponding GO samples were named as GO1, GO2, GO3, GO4 and GO5 respectively. The mixture was stirred under ice bath. Then KMnO4 was added gradually into the mixture. After being stirred for two hours, the mixture was heated up to 35 °C and maintained this temperature for 30 min. Then the mixture was heated up to 98 °C and stirred for another 20 min. The final mixture was filtered and washed successively with HCl aqueous solution and distilled water until the pH reached 7–8. The final GO powder sample was obtained by vacuum freeze drying.2.3. Preparation of rGO–S composite
The as-prepared GO powder and the sublimed sulfur (Sigma-Aldrich) were mixed by ground milling with a mass ratio of m(GO)![[thin space (1/6-em)]](https://www.rsc.org/images/entities/char_2009.gif) :
:![[thin space (1/6-em)]](https://www.rsc.org/images/entities/char_2009.gif) m(S) = 1
m(S) = 1![[thin space (1/6-em)]](https://www.rsc.org/images/entities/char_2009.gif) :
:![[thin space (1/6-em)]](https://www.rsc.org/images/entities/char_2009.gif) 2. The mixture was sealed in an evacuated quartz tube, heated up to 600 °C in a regular furnace at a rate of 5 °C min−1, and then stayed at this temperature for 6 h, followed by cooling at a slow rate of 0.5 °C min−1 time to room temperature to ensure a complete infiltration of sulfur into the space between layers of rGO. Since GOn (n = 1–5) of different oxidation degree was prepared, we finally got five rGOn–S (n = 1–5) samples.
2. The mixture was sealed in an evacuated quartz tube, heated up to 600 °C in a regular furnace at a rate of 5 °C min−1, and then stayed at this temperature for 6 h, followed by cooling at a slow rate of 0.5 °C min−1 time to room temperature to ensure a complete infiltration of sulfur into the space between layers of rGO. Since GOn (n = 1–5) of different oxidation degree was prepared, we finally got five rGOn–S (n = 1–5) samples.
2.4. Characterization
The structures of GO, rGO–S composites were characterized by a high resolution X-ray diffraction (XRD) system with Cu Ka radiation for 2θ in the range of 7–50°. The sulfur contents were determined by thermogravimetric analysis (TGA) in the temperature range of 50–600 °C in N2 at a heating rate of 10 °C min−1. The morphologies of the GO, rGOn–S (n = 1–5) composites were examined on a scanning electron microscope (SEM) and a transmission electron microscope (TEM). The element distribution was obtained using energy dispersive spectrometers (EDS). The X-ray photoelectron spectroscopy (XPS) with a monochromatic Al Kα X-ray spectrometer at 14 kV was employed to analyze the surface chemical property.2.5. Electrochemical analysis
Cathode slurry was prepared by hand grinding in an agate mortar for 30 min of the as-prepared composites, carbon black (super P) and poly(vinylidene fluoride) (PVDF) binder at a weight ratio of 8![[thin space (1/6-em)]](https://www.rsc.org/images/entities/char_2009.gif) :
:![[thin space (1/6-em)]](https://www.rsc.org/images/entities/char_2009.gif) 1
1![[thin space (1/6-em)]](https://www.rsc.org/images/entities/char_2009.gif) :
:![[thin space (1/6-em)]](https://www.rsc.org/images/entities/char_2009.gif) 1 in an agate mortar for 30 min. The mixture was then added to N-methyl-1-2-pyrrolidone (NMP) solution and magnetically stirred overnight. The obtained slurry was cast onto an aluminum foil and dried at 60 °C in an air-circulated oven. The cathode electrodes were cut into discs of 12 mm in diameter with a sulfur loading of 1.1–1.3 mg cm−2. Electrochemical tests were carried out using CR2032 coin cells assembled in an argon-filled glove box using Li foil as the anode, the polyethylene separator (Celgard 2400), the prepared cathode, and the electrolyte made from a solution of 1 M lithium bis(trifluoromethanesulfonyl)imide (LiTFSI) dissolved in an equivolume mixture of dimethoxyethane (DME) and 1,3-dioxolane (DOL). The coin cells were charge/discharge cycled between 1 and 3 V on a LAND 2001 CT battery tester at room temperature. The electrochemical performance was measured on a CHI660c electrochemical workstation. Cyclic voltammetry (CV) tests were performed within the voltage window of 1–3 V at a scan rate of 0.2 mV s−1. The electrochemical impedance spectra (EIS) were obtained at a constant perturbation amplitude of 5 mV in the frequency range between 0.1 Hz and 100 kHz.
1 in an agate mortar for 30 min. The mixture was then added to N-methyl-1-2-pyrrolidone (NMP) solution and magnetically stirred overnight. The obtained slurry was cast onto an aluminum foil and dried at 60 °C in an air-circulated oven. The cathode electrodes were cut into discs of 12 mm in diameter with a sulfur loading of 1.1–1.3 mg cm−2. Electrochemical tests were carried out using CR2032 coin cells assembled in an argon-filled glove box using Li foil as the anode, the polyethylene separator (Celgard 2400), the prepared cathode, and the electrolyte made from a solution of 1 M lithium bis(trifluoromethanesulfonyl)imide (LiTFSI) dissolved in an equivolume mixture of dimethoxyethane (DME) and 1,3-dioxolane (DOL). The coin cells were charge/discharge cycled between 1 and 3 V on a LAND 2001 CT battery tester at room temperature. The electrochemical performance was measured on a CHI660c electrochemical workstation. Cyclic voltammetry (CV) tests were performed within the voltage window of 1–3 V at a scan rate of 0.2 mV s−1. The electrochemical impedance spectra (EIS) were obtained at a constant perturbation amplitude of 5 mV in the frequency range between 0.1 Hz and 100 kHz.
3. Results and discussion
3.1. Structure and morphology characterization
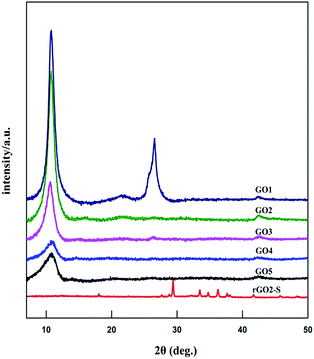
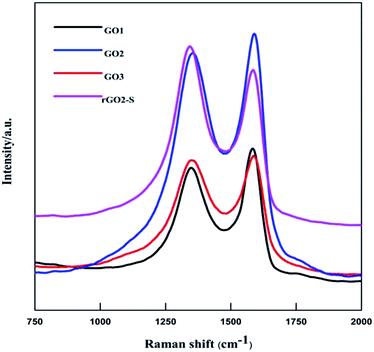
The XRD patterns of GOn (n = 1–5) and rGO2–S samples are shown in Fig. 1. For the natural graphite, there exists a sharp diffraction peak at 26° (the result not shown here). It is well known that the interplanar spacing of the (002) plane in natural graphite is 0.34 nm. For the GO samples, the diffraction peak became weaker and shifted to a lower angle at around 11°. However, a peak at 26° still exists for the GO1 sample, which means GO1 is not completely oxidized. In addition, with the increase of KMnO4 added during the oxidation process, the diffraction peak of GO samples tended to be appeared at a lower position and the graphite peak at 26° disappeared. According to the Bragg equation, it is easy to know that the interplanar spacing of the (002) plane in the GO samples were gradually enlarged to 0.83 nm for GO5, i.e., the interplanar space can be enlarged with the increase of KMnO4 loading due to the increased oxygen containing functional group produced. While for the rGO2–S, after in situ S thermal reduction under vacuum at 600 °C, the peak position (2θ = 11°) of GO vanishes, indicating that GO was reduced during the synthesis process with sulfur, but the diffraction peaks of crystal S8 in rGO–S are visible demonstrating small amount of S8 is still exist on the surface of the expanded graphite surface.Raman spectra further provide additional evidences of the reduction of GO. As shown in Fig. 2. The Raman spectra of all for samples display two prominent peaks, corresponding to the G and D bands. The G band is usually assigned to the E2g phonon of C sp2 atoms, while the D band originates from a breathing κ-point phonon with A1g symmetry and related to local defects and disorder.35 Raman spectra show that both GO2 and rGO2–S exhibit two broad peaks at 1336 cm−1 and 1591 cm−1, which in accordance with those of graphite, respectively. The D band is attributed to the defects or imperfections, reflecting the presence of disordered edges or boundaries in the rGO domains.35 The higher D/G band intensity ratio (ID/IG) in rGO2–S (ID/IG = 1.14) than that in GO2 (ID/IG = 0.91) means that most of the oxygen functional groups intercalated into the interlayer spacing of GO have been removed and a larger number of defects and disordered edge sites are introduced during heating treatment.36
The S contents in the rGOn–S (n = 1–5) were determined by TG measurement and shown in Fig. 3. The weight losses of rGO1–S, rGO2–S, rGO3–S were 69.3 wt%, 82.0 wt% and 82.4 wt%, respectively. However, with higher oxidation degree, the rGO4–S and rGO5–S showed lower sulfur contents with 71.6 wt% and 70.5 wt%, respectively. The high S content in this may be related to the microstructure and appropriate interplanar space. It is reported that part of S (S8) may be deposited on the external surface of the carbon matrix through high-temperature vapor S infusion method. Therefore, the rGO2–S composite was washed by CS2. After undergoing treatment with CS2, the S content remains around 40% for the rGO2–S–CS2.
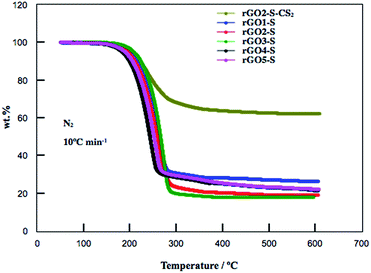 | ||
| Fig. 3 TG curves for rGOn–S (n = 1–5) and rGO2–S–CS2 samples from room temperature to 600 °C at a heating rate of 10 °C min−1 under N2 atmosphere. | ||
The scanning electron microscopy (SEM) images of GO are presented in Fig. 4. The GO1 has large, agglomerated graphite-like particles with a deeply connected lamellar morphology (Fig. 4a). With higher oxidation, the samples from GO2 to GO5 have more loose morphology and there are more defects on surface. Cross-section of GO2 film is depicted in Fig. 4f, it can easy to see that GO is comprised of stacked sheets with a layer by layer structure, which favors to load S inside.
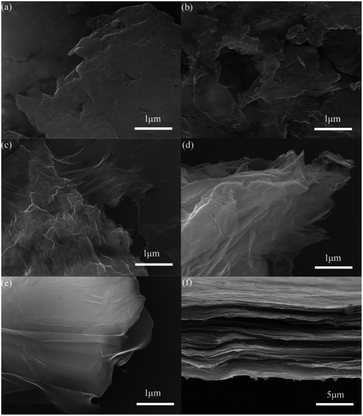 | ||
| Fig. 4 SEM images of GO1 (a), GO2 (b), GO3 (c), GO4 (d), GO5 (e), and cross-section of GO2 film (f). | ||
The morphologies of the rGOn–S (n = 1–5) composites were also investigated by SEM as shown in Fig. 5. From the SEM images of rGOn–S (n = 1–5) composite, it seems that most of sulfur particles were enveloped by graphite sheets, but some of them were uncovered. The microstructure of rGO2–S was also characterized by TEM. As seen in Fig. 5f, GO sheets are large and transparent, demonstrating that GO consists of a few graphene layers. And TEM picture of the black particles reveals the clear crystal lattice, which proves that there are many individual sulfur nanoparticles interlate between layers of graphene. The EDX mapping for rGO2–S was shown in Fig. 5g–i. The elemental distribution maps of C and S clearly demonstrate that the S is homogeneously distributed in the rGO layer.
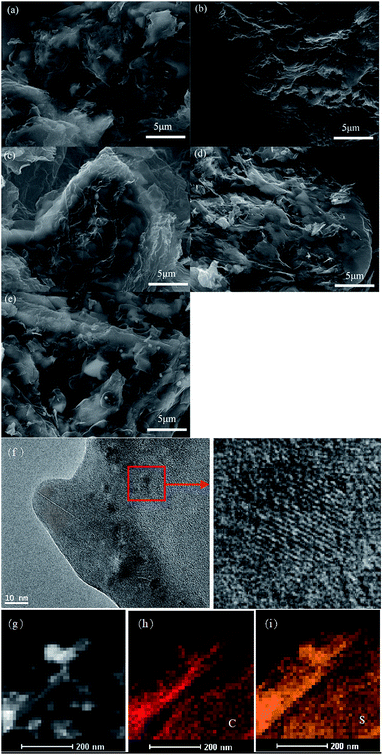 | ||
| Fig. 5 SEM images of rGOn–S (n = 1–5) (a–e), and TEM image of rGO2–S (f) and its corresponding elemental mapping of rGO2–S (g) for C (h) and S (i). | ||
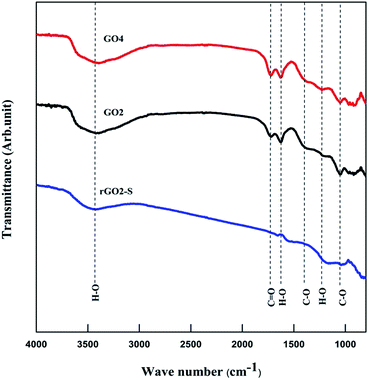
Fourier transform infrared (FTIR) was used to analyze GO and rGO–S samples, as shown in Fig. 6. Similar spectra were obtained for all the oxidized GOs with the distinct oxygen containing functional groups. The spectra of GO exhibit strong peaks throughout the entire wave number range, located at 3442, 1750, 1622, 1372, 1222, 1040 cm−1, which are due to the vibration and deformation bands of O–H and C![[double bond, length as m-dash]](https://www.rsc.org/images/entities/char_e001.gif) O stretching vibrations from carbonyl groups, C
O stretching vibrations from carbonyl groups, C![[double bond, length as m-dash]](https://www.rsc.org/images/entities/char_e001.gif) C configurable vibrations from the aromatic zooms, C–O vibrations from epoxy groups and alkoxy groups. After undergoing 600 °C thermal reduction, these peaks related to the oxygen containing functional groups vanish in the FTIR spectrum of rGO2–S composites, which suggests that all of the oxygen-containing functional groups of the GO have been removed during the preparation process of rGO–S composite.
C configurable vibrations from the aromatic zooms, C–O vibrations from epoxy groups and alkoxy groups. After undergoing 600 °C thermal reduction, these peaks related to the oxygen containing functional groups vanish in the FTIR spectrum of rGO2–S composites, which suggests that all of the oxygen-containing functional groups of the GO have been removed during the preparation process of rGO–S composite.
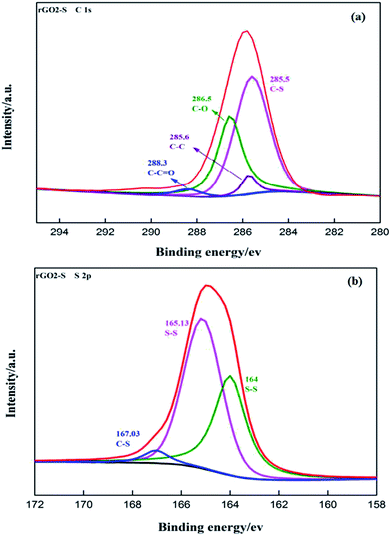
The surface chemical composition and functional groups of the rGO2–S were identified by XPS in Fig. 7. The deconvoluted C 1s spectra of rGO2–S shows five peaks at 285.5 eV for C–S, 285.6 eV for C–C, 286.5 eV for C–O, 288.3 eV for C–C![[double bond, length as m-dash]](https://www.rsc.org/images/entities/char_e001.gif) O, respectively. The fraction of carbon–carbon and carbon–sulfur bonding can be attributed to the efficient removal of oxygen functional groups from the GO by the one-step heat treating process and demonstrates the formation of rGO–S. The successful loading of sulfur on rGO is also depicted by the S 2p spectrum of the rGO2–S (Fig. 7b). The S 2p exhibits one strong peak at about 164.6 eV along with a broad peak centered at 167.03 eV. Further fitting indicates that the strong peak can be split into two peaks for 165.13 and 164 eV, respectively, which are assigned to S 2p1/2 and 2p3/2 due to spin orbit coupling, but the binding energies are slightly higher than those of the characteristic peaks of elemental S, which is mainly related to the signals come from the S confined in the rGO.37,38 In addition, there exists a broad high binding energy peak positioned between 164 and 170 eV, which is an evidence of the strong interaction of sulfur and carbon.39 The C 1s spectra of rGO1–S, rGO3–S show similar peak positions in Fig. S1(a and c),† which indicates that there is no obvious change for the functional groups on GO of different oxide degree after reducing process. The atomic ratio for rGO (1–3)–S samples is shown in Fig. S2.† It can be seen that the values of the O atomic ratio are almost around 16% for all samples, suggesting that the rGOs in the composites have a close oxidation degree. On the contrary, S/C atomic ratio of increased from 0.18 of rGO1–S to 0.48 of rGO3–S, which was an important evidence to prove the enhancement of S element load is related to the oxidation of GO precursor.
O, respectively. The fraction of carbon–carbon and carbon–sulfur bonding can be attributed to the efficient removal of oxygen functional groups from the GO by the one-step heat treating process and demonstrates the formation of rGO–S. The successful loading of sulfur on rGO is also depicted by the S 2p spectrum of the rGO2–S (Fig. 7b). The S 2p exhibits one strong peak at about 164.6 eV along with a broad peak centered at 167.03 eV. Further fitting indicates that the strong peak can be split into two peaks for 165.13 and 164 eV, respectively, which are assigned to S 2p1/2 and 2p3/2 due to spin orbit coupling, but the binding energies are slightly higher than those of the characteristic peaks of elemental S, which is mainly related to the signals come from the S confined in the rGO.37,38 In addition, there exists a broad high binding energy peak positioned between 164 and 170 eV, which is an evidence of the strong interaction of sulfur and carbon.39 The C 1s spectra of rGO1–S, rGO3–S show similar peak positions in Fig. S1(a and c),† which indicates that there is no obvious change for the functional groups on GO of different oxide degree after reducing process. The atomic ratio for rGO (1–3)–S samples is shown in Fig. S2.† It can be seen that the values of the O atomic ratio are almost around 16% for all samples, suggesting that the rGOs in the composites have a close oxidation degree. On the contrary, S/C atomic ratio of increased from 0.18 of rGO1–S to 0.48 of rGO3–S, which was an important evidence to prove the enhancement of S element load is related to the oxidation of GO precursor.
3.2. Electrochemical characterization
The electrochemical performances of the as-obtained rGO–S series cathode for lithium–sulfur batteries were investigated by cyclic voltammogram (CV), electrochemical impedance spectroscopy (EIS) and galvanostatic charge–discharge measurement. As shown in the first cathodic scan of the CV profiles to rGO–S series (Fig. 8), two main peaks around 2.4 and 1.9 V is clearly presented, corresponding to the transformation from cyclo-S8 high order lithium polysulfides (Li2Sn, n > 4) and the sequential reduction of high order lithium polysulfides into Li2S2 and Li2S, respectively. In the subsequent anodic scan, only a strong oxidation peak around 2.5 V is observed, which associates to the coupled conversion from lithium sulfide to lithium polysulfides, and ultimately to sulfur. Both the reduction and oxidation peaks slightly shift in the next two cycles because of the stronger polarization of the electrode materials. This can be ascribed to the increased viscosity of the electrolyte induced by the dissolution of lithium polysulfides during the first discharge.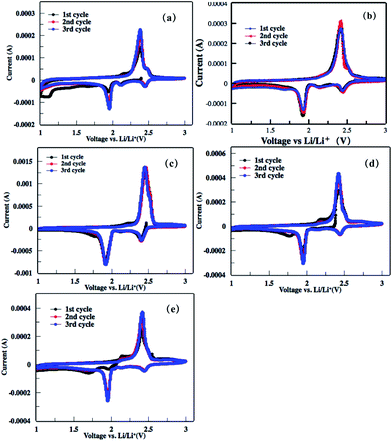 | ||
| Fig. 8 (a–e) Cyclic voltammograms of the rGOn–S (n = 1–5) composite electrode in the first three cycles within the voltage window of 1.0–3.0 V at a scan rate of 0.2 mV s−1. | ||
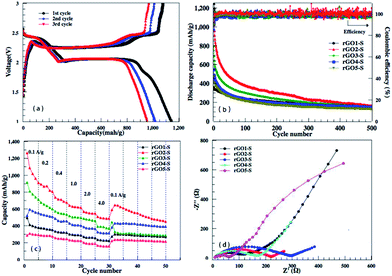
From the discharge/charge galvanostatic profiles of rGO–S series composite, two distinct discharge plateaus are observed at around 2.4 and 1.9 V (only rGO2–S exhibits in Fig. 9a), which agrees with the reduction peaks of CV curves. When discharging below 1.9 V, the curve become kinetically slow and normally suffers high polarization, which could be attributed to the nonconductive nature of Li2S2 and Li2S.40,41 Fig. 9b and c display the cycling performance of the rGO–S electrodes at 200 mA g−1 and the rate capability at the current density from 0.1 A g−1 to 4.0 A g−1. It can be seen that the coulombic efficiencies of rGOn–S (n = 1–5) remain 98% except the initial several cycles, by comparison, rGO2–S composite shows relatively higher specific capacity than other four composites, especially, the first discharge capacity can be reached 1142 mA h g−1. On the whole, the rGO2–S composite exhibits the best comprehensive electrochemical performance among the rGO–S cathodes without the use of LiNO3 in electrolyte.
To further investigate the difference of electrochemical performance for the rGOn–S (n = 1–5) composites, electrochemical impedance spectra (EIS) of the rGOn–S (n = 1–5) composites as cathodes in Li–S cells in the initial states were measured and compared in Fig. 9d. The diameter of the semicircular portion of the curve represents the charge transfer resistance Rct. The Rct values of the rGO–S composites are 102, 220, 285, 171 and 64 Ω cm−2, respectively. It is obvious that the Rct values of rGO–S are directly relevant with the oxidation degree of the pristine GO. The rGO1–S and rGO5–S composite electrode exhibited a much lower charge transfer resistance than that of the rGO3–S and rGO2–S composite, which could be attributed to the higher sulfur loading of rGO3–S and rGO2–S composite.
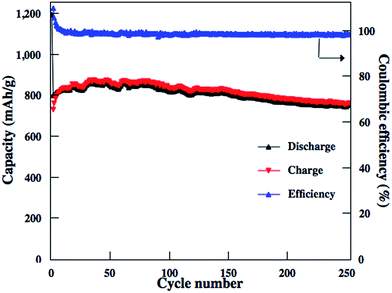
Similar to other carbon–S and graphene–S composite cathodes reported in literatures,42–44 the capacity gradually decay in the first 50–100 cycles and then stabilize at a capacity range. The initial capacity decay is attributed to the dissolution of high-order polysulfides formed from S8 that is coated on the outside surface of carbon matrixs. Therefore, we should expect much higher reversible capacities to be obtained for these rGO–S composite cathodes if the S8 in the rGO–S composites can be removed, i.e., reducing the irreversible capacity. Herein, CS2 was use to wash the surface of rGO2–S sample. From TG results, there are around 40% S in the rGO2–S–CS2 composite. The electrochemical performances of the rGO2–S–CS2 composite were also evaluated as cathodes for Li–S batteries in coin cells and displayed in Fig. 10. The rGO2–S–CS2 cathode exhibits coulombic efficiency over 100% in the initial several cycles, which is attributed to the formation of solid electrolyte interface (SEI) on surface of lithium anode, i.e., a fraction of lithium-ion lose in charging process. The loss results in that charge capacity is lower than discharge capacity. After about 10 cycles, the coulombic efficiency is close to 100%, demonstrating better cycle stability. Even cycling up to more than 250 cycles, the discharge capacities of the electrode still remain about 750 mA h g−1 at 0.2 A g−1. The cycling test of the Li–S cell is still under way.
In summary, the flexible structure of two dimensional rGO sheets and the strong interaction between S and rGO sheets in rGO–S series composites are beneficial to efficiently prevent volume expansion/contraction and aggregation of S during Li+ insertion and extraction process. As a carrier of sulfur, the GO matrix with different oxidation degree shows different effect. Such a series of rGO–S composite is capable of effectively utilizing the mesoporous, good conductivity, mechanical flexibility and good conductivity of rGO. Among them, rGO2–S cathode shows relatively good electrochemical performance.
4. Conclusions
The rGO–S series composites have also been synthesized successfully by a facile one-step in situ strategy, i.e., high temperature thermal-reducing GO and intercalating of S under vacuum. During the synthesis process, GO was reduced by S vapor, and a homogeneous composite containing sulfur simultaneously formed. This in situ synthesis method has the advantages of simple synthetic process, environmental friendliness and low cost, and this method can be applied in industrial production. The structural and electrochemical properties of the as-obtained rGO–S composite cathodes were investigated systematically. It has been found that the loading amount of S embedded in the rGO layer for the S/carbon cathode and its electrochemical performance were strongly depend on the oxidation degree of GO. The CS2-washing treatment can further enhance the cycling stability of RGO/S composites. The optimized rGO–S cathode in Li–S cell shows almost 100% of coulombic efficiency and provides reversible capacity of 750–820 mA h g−1 at a current density of 0.2 A g−1 with cycling up to 250 cycles. The superior electrochemical properties of the C/S composite cathode are attributed to the S encapsulated into the unique structural rGO.Conflicts of interest
There are no conflicts to declare.Acknowledgements
The authors gratefully acknowledge the support of the National Science Foundation of China (51472161, 51671135, 51472160, 21676165, 21403139, and 51501107), the Key Program for the Fundamental Research of the Science and Technology Commission of Shanghai Municipality (15JC1490800, 12JC1406900). We acknowledge the support of the Program of Shanghai Subject Chief Scientist (17XD1403000), the Program for Professor of Special Appointment (Eastern Scholar) at Shanghai Institutions of Higher Learning and the support of young teachers in Shanghai colleges and universities (ZZsl15059).References
- P. G. Bruce, S. A. Freunberger and L. J. Hardwick, Nat. Mater., 2012, 11, 19–29 CrossRef CAS PubMed.
- M. Barghamadi, A. Kapoor and C. Wen, J. Electrochem. Soc., 2013, 160, A1256–A1263 CrossRef CAS.
- X. L. Ji and L. F. Nazar, J. Mater. Chem., 2010, 20, 9821–9826 RSC.
- S. Z. We, W. Li, J. J. Cha, G. Zheng and Y. Yang, Nat. Commun., 2013, 4, 1331–1336 CrossRef PubMed.
- F. Wu, J. T. Lee, N. Nitta, H. Kim, O. Borodin and G. Yushin, Adv. Mater., 2015, 27, 101–108 CrossRef CAS PubMed.
- L. Carbone, M. Gobet, J. Peng, M. Devany, B. Scrosati and S. Greenbaum, ACS Appl. Mater. Interfaces, 2015, 7, 13859–13865 CAS.
- B. Jin, J. U. Kim and H. B. Gu, J. Power Sources, 2003, 117, 148–152 CrossRef CAS.
- H. M. Kim, J. Y. Hwang, A. Manthiram and Y. K. Sun, ACS Appl. Mater. Interfaces, 2016, 8, 983–987 CAS.
- J. Q. Huang, B. Zhang, Z. L. Xu, S. Abouali, M. Akbari Garakani, J. Huang and J. K. Kim, J. Power Sources, 2015, 285, 43–50 CrossRef CAS.
- J. Q. Huang, Z. L. Xu, S. Abouali, M. Akbari Garakani and J. K. Kim, Carbon, 2016, 99, 624–632 CrossRef CAS.
- H. Wei, J. Ma, B. Li, Y. Zuo and D. Xia, ACS Appl. Mater. Interfaces, 2014, 6, 20276–20281 CAS.
- H. Yao, K. Yan, W. Li, G. Zheng, D. Kong, Z. W. Seh, V. K. Narasimhan, Z. Liang and Y. Cui, Energy Environ. Sci., 2014, 7, 3381–3390 CAS.
- H. Wang, Y. Yang, Y. Liang, J. T. Robinson, Y. Li, A. Jackson, Y. Cui and H. Dai, Nano Lett., 2011, 11, 2644–2647 CrossRef CAS PubMed.
- N. Jayaprakash, J. Shen, S. S. Moganty, A. Corona and L. A. Archer, Angew. Chem., 2011, 123, 6026–6030 CrossRef.
- S. Moon, Y. H. Jung, W. K. Jung, D. S. Jung, J. W. Choi and D. K. Kim, Adv. Mater., 2013, 25, 6547–6553 CrossRef CAS PubMed.
- X. Z. Ma, B. Jin, P. M. Xin and H. H. Wang, Appl. Surf. Sci., 2014, 307, 346–350 CrossRef CAS.
- Z. Li, J. T. Zhang, Y. M. Chen, J. Li and X. W. D. Lou, Nat. Commun., 2015, 6, 8850–8857 CrossRef CAS PubMed.
- L. Xiao, Y. Cao, J. Xiao, B. Schwenzer, M. H. Engelhard, L. V. Saraf, S. Z. Nie, G. J. Exarhos and J. Liu, Adv. Mater., 2012, 24, 1176–1181 CrossRef CAS PubMed.
- H. Chen, W. Dong, J. Ge, C. Wang, X. Wu, W. Lu and L. Chen, Sci. Rep., 2013, 3, 1910–1915 CrossRef PubMed.
- X. Liang, C. Hart, Q. Pang, A. Garsuch, T. Weiss and L. F. Nazar, Nat. Commun., 2015, 6, 5682–5689 CrossRef PubMed.
- R. Ponraj, A. G. Kannan, J. H. Ahn and D. W. Kim, ACS Appl. Mater. Interfaces, 2016, 8, 4000–4006 CAS.
- E. Yoo, J. Kim, E. Hosono, H. S. Zhou, T. Kudo and I. Honma, Nano Lett., 2008, 8, 2277–2282 CrossRef CAS PubMed.
- C. Zhao, C. Yu, S. Liu, J. Yang, X. Fan, H. Huang and J. Qiu, Adv. Funct. Mater., 2015, 25, 6913–6920 CrossRef CAS.
- X. Meng, C. Yu, X. Song, Y. Liu, S. Liang, Z. Liu, C. Hao and J. Qiu, Adv. Energy Mater., 2015, 5, 1500180–1500188 CrossRef.
- Z. Zhang, G. Wang, Y. Lai and J. Li, J. Alloys Compd., 2016, 663, 501–506 CrossRef CAS.
- Y. Jiang, M. Lu, X. Ling, Z. Jiao, L. Chen, L. Chen, P. Hu and B. Zhao, J. Alloys Compd., 2015, 645, 509–516 CrossRef CAS.
- J. Zhang, N. Yang, X. Yang, S. Li, J. Yao and Y. Cai, J. Alloys Compd., 2015, 650, 604–609 CrossRef CAS.
- L. Ji, M. Rao, H. Zheng, L. Zhang, Y. Li and W. Duan, et al., J. Am. Chem. Soc., 2011, 133, 18522–18527 CrossRef CAS PubMed.
- Z. Wang, Y. Dong, H. Li, Z. Zhao, W. H. Bin and C. Hao, et al., Nat. Commun., 2014, 5, 5002–5008 CrossRef CAS PubMed.
- Y. Zhang, Y. Zhao, A. Konarov, D. Gosselink, H. G. Soboleski and P. Chen, J. Power Sources, 2013, 241, 517–521 CrossRef CAS.
- C. Zhang, W. Lv and W. Zhang, et al., Adv. Energy Mater., 2014, 4, 175–182 Search PubMed.
- C. Zu and A. Manthiram, Adv. Energy Mater., 2013, 3, 1008–1012 CrossRef CAS.
- X. Zhou, Y. Li and G. Ma, et al., J. Alloys Compd., 2016, 685, 216–221 CrossRef CAS.
- W. S. Hummers and R. E. Offeman, J. Am. Chem. Soc., 1958, 80, 1339 CrossRef CAS.
- A. Ferrari, J. Meyer, V. Scardaci, C. Casiraghi, M. Lazzeri, F. Mauri, S. Piscanec, D. Jiang, K. S. Novoselov and S. Roth, Phys. Rev. Lett., 2006, 97, 187401–187404 CrossRef CAS PubMed.
- C. Nithya and S. Gopukumar, J. Chem. Mater. A., 2014, 2, 10516–10525 RSC.
- V. Toniazzo, C. Mustin, J. Portal, B. Humbert, R. Benoit and R. Erre, Appl. Surf. Sci., 1999, 143, 229–237 CrossRef CAS.
- G. Greczynski, Th. Kugler and W. Salaneck, Thin Solid Films, 1999, 354, 129–135 CrossRef CAS.
- Y. Yang, G. Yu, J. Chu, H. Wu, M. Vosgueritchian, Y. Yao, Z. Bao and Y. Cui, ACS Nano, 2011, 5, 9187–9193 CrossRef CAS PubMed.
- J. Z. Wang, L. Lu, M. Choucair, J. A. Stride, X. Xu and H. K. Liu, J. Power Sources, 2011, 196, 7030–7034 CrossRef CAS.
- S. S. Zhang, Electrochim. Acta, 2012, 70, 344–348 CrossRef CAS.
- J. Schuster, G. He, B. Mandlmeier, T. Yim, K. T. Lee, T. Bein and L. F. Nazar, Angew. Chem., Int. Ed., 2012, 51, 3591–3595 CrossRef CAS PubMed.
- H. Wang, Y. Yang, Y. Liang, J. T. Robinson, Y. Li, A. Jackson, Y. Cui and H. Dai, Nano Lett., 2011, 11, 2644–2647 CrossRef CAS PubMed.
- L. Ji, M. Rao, H. Zheng, L. Zhang, Y. Li, W. Duan, J. Guo, E. J. Cairns and Y. Zhang, J. Am. Chem. Soc., 2011, 133, 18522–18525 CrossRef CAS PubMed.
Footnote |
| † Electronic supplementary information (ESI) available. See DOI: 10.1039/c7ra12694h |
| This journal is © The Royal Society of Chemistry 2018 |

