 Open Access Article
Determination of uric acid in biological samples by high performance liquid chromatography-electrospray ionization-tandem mass spectrometry and study on pathogenesis of pulmonary arterial hypertension in pulmonary artery endothelium cells†
Qiaozhi Li‡
a,
Yanli Qiu‡ac,
Weina Hand,
Yaqin Zhenga,
Xiaoying Wanga,
Dandan Xiaoa,
Min Maoe and
Qian Li *ab
*ab
aDepartment of Pharmaceutical Analysis and Analytical Chemistry, College of Pharmacy, Harbin Medical University, Harbin 150086, P. R. China. E-mail: liqian@ems.hrbmu.edu.cn; Tel: +86-0451-86699347
bBiological Sciences, Purdue University, West Lafayette, Indiana, USA
cHeilongjiang Far East Cardiovascular Hospital, Harbin 150036, P. R. China
dDepartment of Medicinal Chemistry and Natural Medicine Chemistry, College of Pharmacy, Harbin Medical University, Harbin 150086, P. R. China
eDepartment of Biopharmaceutical Sciences, College of Pharmacy, Harbin Medical University (Daqing), Daqing 163319, P. R. China
First published on 18th July 2018
Abstract
Pulmonary arterial hypertension (PAH) is a severe cardiovascular disease that can lead to vascular remodelling and hypertension. Clinical diagnosis of PAH is very difficult. Uric acid (UA) can act as a biological marker for screening of PAH in patients. Multiple studies have indicated that reactive oxygen species (ROS) play an important role in the development of PAH. Thus, it is important to study the relationship between UA and ROS based on the pathogenesis of PAH. For monitoring PAH, a high performance liquid chromatography-electrospray ionization-tandem mass spectrometry (HPLC-ESI-MS/MS) method was developed to measure the concentration of UA from rat models and pulmonary arterial endothelial cells (PAECs) models, which were induced by monocrotaline (MCT) and hypoxia, respectively. In addition, the treatment groups were treated by N-acetyl-L-cysteine (NAC), a ROS scavenger. With the confirmation from hematoxylin-eosin (H&E) staining, the HPLC-ESI-MS/MS method was adopted to successfully analyze the concentration of UA. In this study, for the first time, thymine was used as an internal standard (I.S.) of uric acid. The results showed that the UA concentration in the PAH groups was higher than that in the normal groups, while the UA concentration in the treatment groups decreased compared to that in the PAH group (p < 0.05). It was experimentally proven that the HPLC-ESI-MS/MS method is a rapid, efficient and reliable quantitative method to detect PAH. Furthermore, our results indicated that UA and ROS have a double-regulator role.
Introduction
Pulmonary arterial hypertension (PAH) is a severe, chronic disease characterized by a progressive increase in the pulmonary arterial pressure. It can further develop into vascular hypertrophy and pulmonary structural remodelling, which would lead to right ventricular overload, right heart failure, and even death.1,2 In cellular studies, hypoxic-induced PAH can lead to an increase in reactive oxygen species (ROS). Therefore, the treatment of PAH is closely related to the inhibition of ROS. N-acetyl-L-cysteine (NAC), a scavenger of ROS, is often used to treat PAH. It has also been shown that NAC can reduce the thickness of pulmonary artery and suppress pulmonary structural remodelling.3,4 Generally, PAH is diagnosed when the pulmonary arterial (PA) pressure is above 25 mmHg at rest or above 30 mmHg in motion. It is difficult to make PAH diagnosis via vague and insidious symptoms of increasing fatigue and dyspnea.5 Due to the lack of specific clinical indicators, PAH is often misdiagnosed, which results in loss of optimal treatment time. Hence, an ideal biomarker evidence should be found for diagnosis of preclinical PAH to guide therapy.Uric acid (UA) is a final product of purine metabolism, which is primarily generated in the liver in most mammals.6–9 Approximately 60% to 70% of total UA is excreted from the body through the kidneys.10 Usually, UA is a powerful antioxidant in serum. However, cellular studies have shown that UA may also be a pro-oxidant, relying on its chemical microenvironment.11 Moreover, UA has proinflammatory and vasoconstrictive effects as well as a direct influence on vascular remodelling.12 The levels of UA may be influenced by many factors, such as systemic arterial hypertension (HTN) and age.13 A disordered concentration of UA in the blood can lead to many diseases such as hypertension, cardiovascular, kidney, liver, and Parkinson's disease.14–19 The levels of serum UA are closely related to functional severity and have independent prognostic implications in PAH.20–22 However, the mechanism of how UA affects PAH is still ambiguous. Therefore, the relationship between them was explored by means of studying the connection between UA and ROS in this study.
It is well reported that the quantification methods for UA, such as high performance liquid chromatography (HPLC) or gas chromatography and mass spectrometry (GC-MS), have many inevitable limitations.23–27 HPLC techniques are sensitive, but lack selectivity due to interference from the matrix. Moreover, the sample preparation processes limit their operational efficiency and potential.25 GC-MS methods are also hampered by cumbersome and complex preparation procedures, which result in longer analysis times. Therefore, it is necessary to find a method with high sensitivity, selectivity, accuracy, and a simple sample pre-treatment process. Liquid chromatography-mass spectrometry (LC-MS) can usually be used as an accurate, efficient and powerful tool for determination of the substances in biological samples.28–32
It has been reported that 15N-labelled uric acid is often used as an internal standard (I.S.) for quantification of uric acid by mass spectrometry. Thymine is a pyrimidine nucleobase. Considering the cost of the heavy labeled isotope I.S.,33–35 we chose a structural analog (thymine) in this study, which made the quantification more cost-effective.
In the present study, a high performance liquid chromatography-tandem mass spectrometry (HPLC-MS/MS) method was used for the identification, validation and analysis of UA in serum, cells, and tissue from three groups (normal group, MCT group, MCT + NAC group). As a result, we verified the disease status in various biological samples to provide early diagnosis of PAH. This method has improved efficacy compared to that of current therapies and prognoses. Furthermore, the sample preparation procedure is simple and timesaving. The mechanism of PAH is also preliminarily discussed.
Materials and methods
Ethics statement
All experimental procedures on animals were carried out in accordance with guidelines for the Care and Use of Laboratory Animals approved by the Institutional Animal Care and Use Committee and conducted in compliance with the NIH guide. The study protocol on the Ethics of Animal was approved by the Committee Experiments of the Harbin Medical University (permit number: 2010-0006). All surgeries were carried out under sodium pentobarbital anaesthesia, and all efforts were made to minimize pain.Materials
UA (99%) and thymine (I.S.) (98%) were obtained from Sigma (USA). MCT was purchased from Pure One Biotechnology (Co., Ltd. Shanghai, China). NAC was purchased from Sigma-Aldrich Corporation (St. Louis, MO, USA). Reactive Oxygen Species (ROS) detection reagents were obtained from molecular probes (Calif, USA). All other reagents were purchased from common commercial sources. LC-MS-grade methanol and formic acid were obtained from Dikma and Sigma (USA). All other reagents were of analytical grade.Establishment of PAH and treatment models based on rats
To conduct this experiment, we selected 21 SD female adult rats with a weight of 200 ± 10 g. The 21 rats were randomly divided into three groups: normal (n = 7), PAH (n = 7) and treatment (n = 7). The PAH rat models were induced with intraperitoneal injection of MCT at a dose of 60 mg kg−1 d−1 for 21 days. At the same time, the treatment models were treated with intragastric administration of NAC (500 mg kg−1 d−1) for 14–21 days and injected with MCT intraperitoneally. After 3 weeks of induction, all the rats were fasted for 24 hours and then anesthetized. Serum and tissue were collected after sacrifice. Morphometric analysis of the PAH was completed by haematoxylin-eosin (H&E) staining. The lung tissue was sliced following dewaxing, staining, dehydrating, permeating, and sealing. The lung tissue sections were observed by digital photomicrography, and then analysed with Image-Pro Plus 6.0. The staining results were used to verify whether the rat models were successfully established.Establishment of PAH and treatment models based on PAECs
PAECs were collected by scratching the intimal surface of pulmonary arteries, which were from fresh lungs of calf, in compliance with the Ethical Committee of Laboratory Animals at Harbin Medical University. The arteries were gently slit open and the innermost layer was scraped off with a surgical blade to obtain the endothelial cells. Then, 1× HEPES buffer was used to wash the blood that remained in the blood vessels. The PAECs were digested by 1 mg mL−1 collagenase II at 37 °C for 30 min and washed with 1× phosphate buffer saline (PBS) to eliminate the collagenase. Then, PAECs were cultured in Dulbecco's modified Eagle's medium (DMEM) with 20% fetal bovine serum (FBS) and incubated at 37 °C in a 25 mL cell culture bottle for three days to observe the overall adherence of the cells. Finally, the cell culture medium was replaced. When growing into 80% of the cell culture bottle bottom, the cells were plated in 6-well plates overnight at 37 °C. The PAECs were randomly divided into three groups: normal (n = 7), PAH (n = 7) and treatment (n = 7). The PAH model cells were exposed to hypoxia (3% O2) for 24 h. The treatment model was pre-treated with NAC (25 μmol L−1, 0.5 h before hypoxia) and then exposed to hypoxia (3% O2) for 24 h. These cells could be used in the subsequent experiments.Immunofluorescence analysis
Cells were plated in 6-well plates overnight at 37 °C. PAECs were randomly divided into three groups: normal (n = 7), HYP (n = 7) and ALLO (allopurinol, n = 7). PAECs of the HYP group were exposed to hypoxia (3% O2) for 24 h. The PAECs of the ALLO group were pre-treated with ALLO (allopurinol 300 μg mL−1 in 10 mM NaOH, 2 h before hypoxia) and exposed to hypoxia (3% O2) for 24 h. After washing three times with PBS, the cells were covered with ROS detection reagents, CM-H2DCFDA or mitosox, and incubated for an appropriate time in the dark at 37 °C. The images were recorded by digital photomicrography, and then analysed with a colour-recognition algorithm of Image-Pro Plus 6.0.Sample preparations
Serum sample preparation
Serum samples were collected after 3 weeks from normal rats, MCT-injected rats, and MCT rats after intragastric administration with NAC, and blood was collected from the heart. Then, 300 μL methanol was added to 100 μL serum sample, and the mixture was vortexed for 1 min, left undisturbed for 10 min to remove protein sufficiently, and then centrifuged at a speed of 4000 rpm for 10 min. Subsequently, 300 μL supernatant was collected in glass tubes for nitrogen drying at 37 °C before reconstitution with 100 μL of the mobile phase. 1 μL I.S. stock solution was diluted to 1 mL with dd H2O as an I.S. solution of serum. Then, 10 μL I.S solution of serum was added to 100 μL of the mobile phase. After vortexing for 1 min, the samples were filtered through 0.45 μm nylon filters.Tissue samples preparation
Tissue samples were collected after 3 weeks from the lung lobe of normal rats, MCT-injected rats, and MCT rats after intragastric administration with NAC. After dissection, the lung tissues were ground to a fine powder in liquid nitrogen. Each sample (0.05 g) was homogenized with 2 mL methanol by vortexing for 1 min and centrifuging at 12![[thin space (1/6-em)]](https://www.rsc.org/images/entities/char_2009.gif) 000 rpm for 10 min. Then, 200 μL supernatant was collected for nitrogen drying at 37 °C before reconstituting in 100 μL mobile phase. Furthermore, 1 μL I.S. stock solution was diluted to 0.5 mL with dd H2O as I.S. solution of tissue. Then, 10 μL I.S solution of serum was added to 100 μL of mobile phase. After vortexing for 1 min, the samples were filtered through 0.45 μm nylon filters.
000 rpm for 10 min. Then, 200 μL supernatant was collected for nitrogen drying at 37 °C before reconstituting in 100 μL mobile phase. Furthermore, 1 μL I.S. stock solution was diluted to 0.5 mL with dd H2O as I.S. solution of tissue. Then, 10 μL I.S solution of serum was added to 100 μL of mobile phase. After vortexing for 1 min, the samples were filtered through 0.45 μm nylon filters.
Cells sample preparation
PAECs were divided into different groups, namely, normal, hypoxia (3% O2, 24 h), and treatment (plus NAC (25 μmol L−1, 0.5 h before hypoxia)). After 24 h, the cells were harvested, counted, and washed three times with PBS before sonication. Then, the cells were centrifuged at 12![[thin space (1/6-em)]](https://www.rsc.org/images/entities/char_2009.gif) 000 rpm for 10 min to remove protein, and 200 μL supernatant was collected. Then, 2 μL I.S. stock solution was diluted to 0.5 mL with dd H2O as an I.S. solution of the cells. Then, 10 μL I.S solution of the cells was added to 200 μL of supernatant through a 0.45 μm nylon filter for the subsequent HPLC-ESI-MS/MS analysis.
000 rpm for 10 min to remove protein, and 200 μL supernatant was collected. Then, 2 μL I.S. stock solution was diluted to 0.5 mL with dd H2O as an I.S. solution of the cells. Then, 10 μL I.S solution of the cells was added to 200 μL of supernatant through a 0.45 μm nylon filter for the subsequent HPLC-ESI-MS/MS analysis.
Stock solutions, calibration curves and quality control (QC)
The concentration of the UA standard stock solution and the I.S. stock solution was 0.4 g L−1. Also, 20 mg UA and litter ammonia were dissolved in 50 mL dd H2O before sonication and used as the UA stock solution. First, 4 mg thymine was dissolved in 250 μL DMSO, and then diluted with dd H2O to 10 mL and used as the I.S. stock solution. The I.S. stock solution was finally diluted to the required concentration with the biological samples.A series of UA standard solutions in serum (350.00, 200.00, 80.00, 32.00, 12.80, 3.66 1.05, and 0 ng mL−1), in lung tissue (1500.0, 750.0, 150.0, 30.0, 6.0, 3.0, 1.5, and 0 ng mL−1), and in PAECs (1500.0, 750.0, 150.0, 30.0, 6.0, 3.0, 1.5, and 0 ng mL−1) were prepared for establishing calibration curves. Quality control (QC) samples were prepared with the UA concentrations of 10, 50, 200 ng mL−1 in serums, and 3.75, 67.50 and 1200 ng mL−1 in PAECs and lung tissues.
All samples and standards were stored at 4 °C after preparation.
Chromatographic condition
The HPLC-ESI-MS/MS system comprises an Agilent series 1290 HPLC (Agilent, Waldbronn, Germany) coupled with a 6430 QQQ-MS mass spectrometer with an electrospray ionization (ESI) interface. The analytical column used was an Inert sustain (C18) column (3.0 mm × 100 mm, 3 μm) and the column temperature was kept at 28 °C. The mobile phase system was composed of 0.1% formic acid in water (solvent A) and 100% methanol (solvent B). The samples were eluted using an isocratic elution of solvent A![[thin space (1/6-em)]](https://www.rsc.org/images/entities/char_2009.gif) :
:![[thin space (1/6-em)]](https://www.rsc.org/images/entities/char_2009.gif) solvent B (9
solvent B (9![[thin space (1/6-em)]](https://www.rsc.org/images/entities/char_2009.gif) :
:![[thin space (1/6-em)]](https://www.rsc.org/images/entities/char_2009.gif) 1, v/v) at a flow rate of 0.3 mL min−1. The injection volume of the rat samples and supernatant extraction of cells were 2 μL and 10 μL, respectively.
1, v/v) at a flow rate of 0.3 mL min−1. The injection volume of the rat samples and supernatant extraction of cells were 2 μL and 10 μL, respectively.
Tandem mass spectrometric (MS/MS) analysis
Tandem mass spectrometric (MS/MS) analysis was conducted by performing multiple reaction monitoring (MRM) experiments in the negative ESI mode. The precursor-to-product ion transitions of m/z 167 → m/z 124 for UA and m/z 125 → m/z 42 for the I.S. were monitored. The source parameters of electrospray ionization mass spectrometry and tandem mass spectrometry were conducted by setting the following parameters: gas temperature, 300 °C; gas flow, 9 L min−1; nebulizer pressure, 40 psi; capillary voltage, 4000 V; fragmentor voltage, 90 V (UA and I.S.); and collision energy, 15 eV for uric acid and I.S. Finally, the data were processed and analysed by Agilent MassHunter Workstation software.Calibration and method validation
Selectivity
Selectivity is the ability of an analytical method to differentiate and quantify the analytes in the presence of other components in a sample. In this study, the selectivity was determined by comparatively analysing blank samples (rats, PAECs) from 7 individual biological samples, corresponding blank samples (rats, PAECs) spiked with the UA, I.S.Linearity of calibration curves and lowest limits of quantification
A calibration curve was assessed at a concentration range of 1.0–350.0 ng mL−1 in serum and 1.5–1500.0 ng mL−1 in PAECs and lung tissue. The calibration curves were constructed by plotting the peak area ratios of each analyte to I.S. versus plasma concentrations on the basis of weighted linear least-squares regression model (1/x2). The signal to noise ratio was higher than 10 (S/N ≥ 10) in rats and cells could be considered as the lowest limit of quantification (LLOQ).Precision and accuracy
The precision and accuracy of the samples were examined by using the LLOQ and QC samples at three concentration levels (low (LQC), moderate (MQC) and high (HQC)) of the three analytes in six replicates each day for three consecutive days. Precision and accuracy were determined and expressed as relative standard deviation (RSD) and relative error (RE), respectively. The acceptable criteria for the inter-day and intra-day precision and accuracy were within 15%.Extraction recovery and matrix effect
The extraction recovery of the three analytes was determined by analysing six replicates of samples in rat and PAECs at LQC, MQC and HQC level of UA. Matrix effects were evaluated by comparing the absolute peak areas of the blank matrix samples after extraction to the absolute peak areas of the unextracted samples.Stability
The stability of the reference solutions was evaluated by analysing the LOQ and HQC levels of the QC sample with six replicates at each level after 24 h at room temperature.Statistics
The data are presented as mean ± SD. For comparisons between 2 experimental groups, the student's paired t-test was used. Significant level was set at p < 0.05. Statistical analysis was performed by Statistical Product and Service Solutions version 13.0.Results and discussion
HPLC-ESI-MS/MS (MRM) analysis
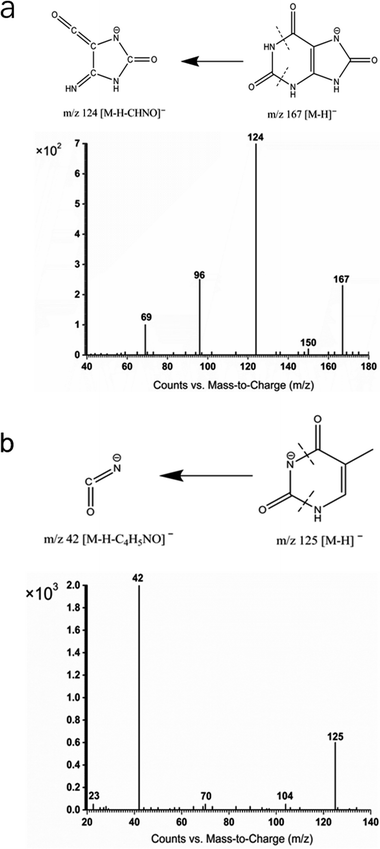
To make quantification cost effective, thymine was used as I.S. for UA in this study. The mass spectral signals of both uric acid and thymine were weak in the positive-ion mode of electrospray ionization. Therefore, all the mass spectral data for the analyses in this study were acquired in the negative ion mode of electrospray ionization. As demonstrated in the MS/MS spectrum of UA and I.S. (in Fig. 1), the product ion of UA was m/z 124 ([M − H–NHCO]−), which was fragmented from a precursor ion m/z 167 ([M − H]−) (Fig. 1a). I.S. (thymine) had mass fragmentation of product ion at m/z 42 ([M − H–C4H8NO]−) from precursor ion at m/z 125 ([M − H]−) in the negative mode (Fig. 1b). Full scan negative ESI mass spectra of UA and thymine are shown in Fig. 1 and 2 of the ESI,† respectively.Morphometric and immunofluorescence analysis
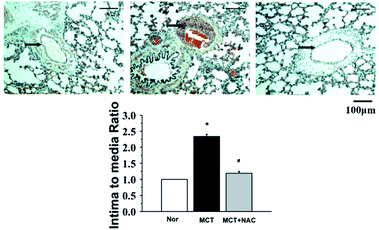
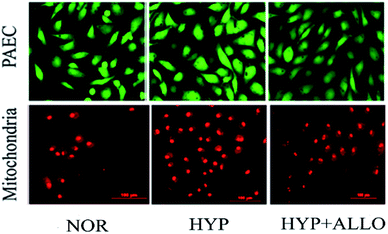
The thickness of the pulmonary arteries of the MCT rats was determined by haematoxylin-eosin (H&E) staining. The pulmonary arteries of the MCT group were significantly thicker than those of the normal group, while NAC treatment significantly reduced the thickness, as shown in Fig. 2. This confirmed that the rat models were successfully established and NAC had a therapeutic effect on PAH. ALLO was used to observe the fluorescence intensity change of ROS in PAECs. PAECs was labelled by CM-H2DCFDA or mitosox. Because ALLO can remove UA, the decrease in UA concentration leads to the decline in ROS in dysfunctional PAECs. The data illustrated that UA markedly decreased the content of ROS in PAECs and mitochondria (Fig. 3). This confirmed that UA can regulate the production of ROS in the condition of PAH.Method validation
Selectivity
The selectivity of the method towards endogenous serum, lung tissue and PAECs matrix was evaluated with serum, lung tissue from three groups (21 SD rats) and PAECs from three groups. The retention times of UA and I.S. were 3.0 ± 0.1 min and 4.4 ± 0.1 min, respectively. All peaks and shapes of the analytes and I.S. were detected with excellent resolution. The typical chromatographic peaks of the three groups with LLOQ analytes and I.S. could be easily detected. The analytes could be easily distinguished from the matrix, and quantitatively detected to the LLOQ level.Linearity of calibration graphs and lowest limits of quantification
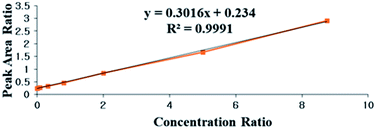
The typical equation of the calibration graph of UA in serum is shown in Fig. 4 and Table 1 in the ESI.† The calibration graphs of UA in lung tissue and PAECs are shown in Fig. 3 and 4 of the ESI.† All correlation coefficients were higher than 0.990. The results showed excellent correlation between the ratio of peak area and concentration ratio for UA and I.S. within the linear range (1.0–350.0 ng mL−1 in rats and 1.5–1500.0 ng mL−1 in tissue and PAECs). The LLOQ in serum, PAECs and tissue were 1.05 ng mL−1, 1.5 ng mL−1 and 1.5 ng mL−1, respectively.Precision and accuracy
The precision (RSD%) and accuracy (RE%) of the method were determined by using three concentrations (LQC, MQC and HQC) of QC samples and the LLOQ sample. The peak-area ratios of UA to I.S. were measured. The intra-/inter-day precision and accuracy were summarized (ESI, Table 2†). These results suggest that the developed method is precise, accurate and reproducible.Extraction recovery and matrix effects
The extraction recovery and matrix effect were determined using LQC, MQC and HQC level of UA. The peak-area ratios of UA to I.S. were measured. The recovery of analytes was greater than 80%. The results of the matrix effects were ±100%, as shown in Table 3 of ESI.† The data mentioned above suggested that ion suppression or enhancement from the matrix was negligible for this method.Stability
The stability of UA was examined in the QC samples at two different concentrations at different times. Deviations less than ±15% were obtained from the results, indicating that the analyte was stable in rat serum, tissue and PAECs at room temperature after 24 h. This shows that the level of UA was stable, as shown in Table 4 of the ESI.†Determination of UA in serum, tissues and PAECs
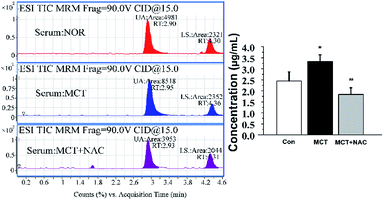
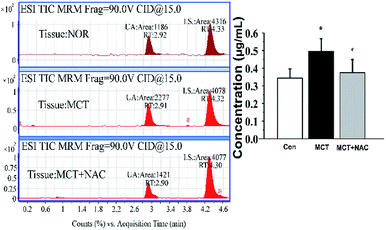
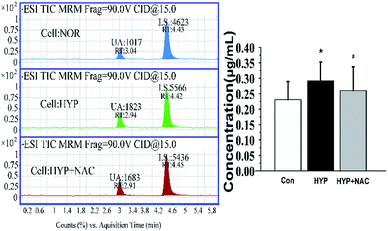
Although the level of UA would be influenced by many factors, the physiological status of the rats, such as age and health conditions, were identical in this study. During the process of PAH, the levels of UA will be increased in serum and tissues. The average concentration of UA was 1.80–3.30 μg mL−1 in serum (Fig. 5) and 0.34–0.50 μg mL−1 in lung tissue (Fig. 6). Compared with the normal groups, the levels of UA in serum and tissues from rats were higher in the MCT groups, namely, the concentration of UA is from 2.45 ± 0.41 (NOR) to 3.34 ± 0.30 (MCT) in serum and the concentration of UA is from 0.34 ± 0.052 (NOR) to 0.50 ± 0.072 (MCT) in tissue. However, UA concentration decreased when MCT induced rats were treated with NAC, a nonspecific ROS scavenger. Specifically, the concentration of UA decreased from 3.34 ± 0.30 (MCT) to 1.84 ± 0.30 (MCT + NAC) in serum, while the concentration of UA decreased from 0.50 ± 0.072 (MCT) to 0.37 ± 0.075 (MCT + NAC) in tissue. These results are consistent with the those obtained through morphometric analysis. In PAECs, the average concentration of UA was 0.23–0.29 μg mL−1 (Fig. 7). Similarly, the UA level in PAECs increased when normal PAECs were induced with hypoxia: the concentration of UA increased from 0.23 ± 0.058 (NOR) to 0.29 ± 0.062 (HYP) in PAECs. However, the UA level decreased when the hypoxia induced PAECs were treated with NAC: the concentration of UA decreased from 0.29 ± 0.062 (HYP) to 0.26 ± 0.077 (HYP + NAC) in PAECs. The results of the PAECs samples showed that ROS can regulate UA in PAECs dysfunction. The chromatography of HPLC-ESI-MS/MS showed that the target compound yielded well-shaped peak with small interference. It was experimentally proven that this method could also be used to diagnose pulmonary hypertension by UA quantification from serum, tissue, and PAECs. Furthermore, immunofluorescence results showed that ALLO as a UA scavenger can lead to decline in ROS. In summary, the molecular mechanism of UA and ROS has a double-regulatory role in dysfunctional cells, as shown in Fig. 8. The concentration of UA plays an important role in the pathogenesis of PAH.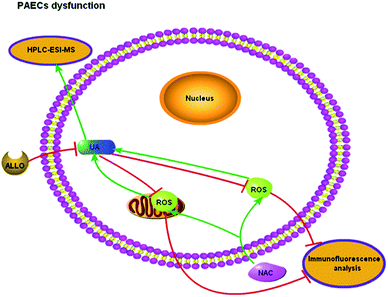 | ||
| Fig. 8 Mechanism of UA and ROS inducing endothelial dysfunction. UA, uric acid; ROS, reactive oxygen species; NAC, N-acetyl-L-cysteine; ALLO, allopurinol. | ||
Conclusions
In this study, a rapid, efficient and reliable quantitative method was developed for the first time and validated to detect the concentration of UA in serum, tissue, and PAECs from normal, PAH, and NAC treatment group. Thymine was used as an I.S. for quantifying UA. In a rat model of MCT induced pulmonary hypertension, the concentration of UA increased compared with that in the normal group. NAC tended to decrease the peripheral vascular density. The concentration of UA in MCT rats treated with NAC was reduced compared with that in MCT induced group. The results from PAECs were consistent with those from rats. The results demonstrated that this HPLC-ESI-MS/MS method had a preferable determination coefficient (R > 0.990) and the lowest limit of quantification (LLOQ = 1.05 ng mL−1 in serum, LLOQ = 1.5 ng mL−1 in PAECs, tissue). The deviations in precision and accuracy were less than 15% for intra-day and inter-day determinations, and the recovery was greater than 80%. In conclusion, a robust, fast, and sensitive HPLC-ESI-MS/MS method has been successfully developed to determine UA in serum, tissue, and PAECs using MRM as the acquisition mode. This quantification method can be used for follow-up surveillance of PAH patients. Moreover, results from the cell study indicated that the pathogenesis of PAH was involved in a bidirectional regulating pattern between UA and ROS.Conflicts of interest
The authors declare that they have no competing interests.Acknowledgements
This study was supported by experimental equipment in Harbin Medical University. We are grateful for the financial support from the Graduate Innovation Foundation of Heilongjiang Province (No. YJSCX2015-46HYD), the National Natural Science Foundation of China (No. 31100835) and the Heilongjiang Province Natural Science Foundation (No. H2015013). The authors would like to take this opportunity to express their sincere appreciation for support mentioned.References
- R. Budhiraja, R. M. Tuder and P. M. Hassoun, N. Engl. J. Med., 1992, 327, 117–119 CrossRef PubMed.
- V. V. Mclaughlin, D. Melinda and C. William, Current Problems in Cardiology, 2011, 36, 461–472 CrossRef PubMed.
- L. Zhang, C. Ma, C. Zhang, M. Ma, F. Zhang, L. Zhang, Y. Chen, F. Cao, S. Li and D. Zhu, Histochem. Cell Biol., 2016, 146, 1–14 CrossRef PubMed.
- M. C. Chaumais, B. Ranchoux, D. Montani, P. Dorfmüller, L. Tu, F. Lecerf, N. Raymond, C. Guignabert, L. Price and G. Simonneau, Respir. Res., 2014, 15, 1–9 CrossRef PubMed.
- M. Rabinovitch, J. Clin. Invest., 2008, 118, 2372–2379 CrossRef PubMed.
- X. Liu, X. Ou, Q. Lu, J. Zhang, S. Chen and S. Wei, RSC Adv., 2014, 4, 42632–42637 RSC.
- R. J. Johnson, D. H. Kang, D. Feig, S. Kivlighn, J. Kanellis, S. Watanabe, K. R. Tuttle, B. Rodriguez-Iturbe, J. Herrera-Acosta and M. Mazzali, Hypertension, 2003, 41, 1183–1190 CrossRef PubMed.
- M. Moccia, M. Picillo, R. Erro, C. Vitale, K. Longo, M. Amboni, G. Santangelo, E. Spina, R. A. De and M. G. De, Parkinsonism Relat. Disord., 2014, 20, 772–775 CrossRef PubMed.
- S. Jesny, S. Menon and K. G. Kumar, RSC Adv., 2016, 6, 75741–75748 RSC.
- I. A. Bobulescu and O. W. Moe, Adv. Chronic Kidney Dis., 2012, 19, 358–371 CrossRef PubMed.
- Z. Huang, H. Quan, X. Zhang, W. Xiao, L. Wang, S. Cui, F. Zhe, L. Yang, G. Cai and X. Chen, Cell Commun. Signaling, 2017, 15, 3–16 CrossRef PubMed.
- S. I. Zharikov, E. R. Swenson, M. Lanaspa, E. R. Block, J. M. Patel and R. J. Johnson, Med. Hypotheses, 2010, 74, 1069–1074 CrossRef PubMed.
- D. E. Amariei, S. P. Juraschek, T. M. Kolb, R. L. Damico, P. M. Hassoun and S. C. Mathai, Am. J. Respir. Crit. Care Med., 2015, 191, A4829–A4830 Search PubMed.
- D. I. Feig, Curr. Opin. Rheumatol., 2014, 26, 176–185 CrossRef PubMed.
- W. J. Kim, S. S. Kim, M. J. Bae, Y. S. Yi, Y. K. Jeon, B. H. Kim, S. H. Song, I. J. Kim and Y. K. Kim, J. Diabetes Complications, 2014, 28, 130–134 CrossRef PubMed.
- L. Qin, Z. Yang, H. Gu, S. Lu, Q. Shi, Y. Xing, X. Li, R. Li, G. Ning and Q. Su, BMC Cardiovasc. Disord., 2014, 14, 26–34 CrossRef PubMed.
- S. Sheikhbahaei, A. Fotouhi, N. Hafezinejad, M. Nakhjavani and A. Esteghamati, Metab. Syndr. Relat. Disord., 2014, 12, 102–109 CrossRef PubMed.
- J. Yu, J. Han, J. Mao, L. Guo and W. Gao, China Med. J., 2014, 127, 1039–1045 Search PubMed.
- P. Sahoo, H. S. Sarkar, S. Das, K. Maiti, M. R. Uddin and S. Mandal, RSC Adv., 2016, 6, 66774–66793 RSC.
- K. J. Kim, I. W. Baek, Y. J. Park, C. H. Yoon, W. U. Kim and C. S. Cho, Int. J. Rheum. Dis., 2014, 18, 524–532 CrossRef PubMed.
- N. Nagaya, M. Uematsu, T. Satoh, S. Kyotani, F. Sakamaki, N. Nakanishi, M. Yamagishi, T. Kunieda and K. Miyatake, Am. J. Respir. Crit. Care Med., 1999, 160, 487–492 CrossRef PubMed.
- N. Dhaun, J. L. Vachiery, R. L. Benza, R. Naeije, L. J. Hwang, X. Liu, S. Teal and D. J. Webb, J. Heart Lung Transpl., 2014, 33, 521–527 CrossRef PubMed.
- T. Pal and J. Pal, RSC Adv., 2016, 6, 83738–83747 RSC.
- R. Kanďár, P. Drábková and R. Hampl, J. Chromatogr. B: Anal. Technol. Biomed. Life Sci., 2011, 879, 2834–2839 CrossRef PubMed.
- O. Lux, D. Naidoo and C. Salonikas, Ann. Clin. Biochem., 1992, 29(Pt 6), 674–675 CrossRef PubMed.
- L. M. Thienpont, N. B. Van, D. Stöckl, H. Reinauer and A. P. De Leenheer, Eur. J. Clin. Chem. Clin. Biochem., 1996, 34, 853–860 Search PubMed.
- H. Imran, P. N. Manikandan and V. Dharuman, RSC Adv., 2015, 5, 63513–63520 RSC.
- S. Rakotomanga, A. Baillet, F. Pellerin and D. Baylocq-Ferrier, J. Pharm. Biomed. Anal., 1992, 10, 587–591 CrossRef PubMed.
- J. G. Mcdonald, S. Matthew and R. J. Auchus, Horm. Cancer, 2011, 2, 324–332 CrossRef PubMed.
- J. Xu, L. Tang, Q. Zhang, J. Wei, M. Xian, Y. Zhao, Q. Jia, X. Li, Y. Zhang and Y. Zhao, RSC Adv., 2017, 7, 45746–45756 RSC.
- Q. Liang, H. Liu, H. Xing, Y. Jiang, T. Zhang and A. H. Zhang, RSC Adv., 2016, 6, 29863–29868 RSC.
- S. Cao, Z. Zhang, Y. Ye, L. Chen, Y. Li, X. Yu, Y. Yang, L. Wang, Z. Li and L. Li, RSC Adv., 2015, 5, 16960–16967 RSC.
- K. M. Kim, G. N. Henderson, X. Ouyang, R. F. Frye, Y. Y. Sautin, D. I. Feig and R. J. Johnson, Journal of Chromatography B, 2009, 877, 2032–2038 CrossRef PubMed.
- X. Dai, X. Fang, C. Zhang, R. Xu and B. Xu, Journal of Chromatography B, 2007, 857, 287–295 CrossRef PubMed.
- J. Boelaert, F. Lynen, G. Glorieux, S. Eloot, M. V. Landschoot, M. A. Waterloos, P. Sandra and R. Vanholder, Anal. Bioanal. Chem., 2013, 405, 1937–1947 CrossRef PubMed.
Footnotes |
| † Electronic supplementary information (ESI) available. See DOI: 10.1039/c7ra12702b |
| ‡ These authors contributed equally to this work. |
| This journal is © The Royal Society of Chemistry 2018 |

