 Open Access Article
Vapor deposition of polyionic nanocoatings for reduction of microglia adhesion†
Bin Zhi,
Qing Song and
Yu Mao *
*
Department of Biosystems Engineering, Oklahoma State University, Stillwater, Oklahoma 74078, USA. E-mail: yu.mao@okstate.edu
First published on 25th January 2018
Abstract
Polyionics have great potential in improving the performance of neural probes by regulating microglial response. With the shrinkage of microelectrode size and increase in device complexity, challenges arise during liquid-based synthesis of polyionic compounds on neural probes. Nanocoatings of polyionics, with highly crosslinked bulk structure and abundant ionic functional groups on the surface, were synthesized using a process combining chemical vapor deposition and free radical polymerization. Both conformal surface engineering of neural microelectrodes and facile tailoring of surface ionic composition was achieved using this single-step vapor-based method. Adhesion of microglia was reduced on all the polyionic modified surfaces after a seven-day in vitro test, and polyionics with mixed charges presented much lower microglial adhesion than surfaces with single charges. Laminin adsorption on polyionics with mixed charges was significantly reduced due to the surface electrical neutrality and the enhanced wettability. These findings provide valuable information towards the development of neural probes with enhanced biocompatibility and signal stability.
Introduction
Brain microelectrodes enable acquisition of neural activity and selective neuron stimulation to study neural mechanism,1,2 recover damaged neurological function,3,4 and improve brain-computer communication.5–7 However, the performance of chronic microelectrodes has been reported to suffer from the lack of signal stability and short lifetime, which significantly limits the therapeutic potential of brain probes.8–10 Signal degradation is primarily caused by isolation and detachment of the implant from the target neurons. The process starts with protein adsorption on the implant surface, followed by inflammatory tissue response and immune cell attachment.11–13 As the resident macrophage in brain tissue, microglia plays a critical role after the implantation of brain probes by initiating the inflammatory response and engaging in antigen presentation.14 Studies showed that microglial adhesion leads to the formation of cellular sheath around the microelectrodes, resulting in tissue encapsulation of probes.11,13,14Neural adhesion promoters and inflammatory suppressors have been applied around microelectrodes to attenuate microglial response.15–22 Neural adhesion molecules stimulate the adhesion of neurons and reduce microglia attachment,23–25 but the effect usually vanishes after the release of neural adhesion molecules.17 Inflammatory regulators could effectively lower microglia attachment and suppress its activation.19,20 The interleukin-1 receptor antagonist was reported to reduce 50% microglia attachment in rats after one month,21 and dexamethasone has been used for localized release to suppress microglial response on implanted neural probes in vivo.26
Tailoring the surface chemistry of implants offers another route to improve the biocompatibility with neural tissue.27,28 Hydrophilic surfaces have been known to decrease non-specific protein adsorption,29–31 which provides the potential for suppressing microglial response. The hydrogel of poly(N-isopropylacrylamide) was reported to significantly reduce macrophage adhesion and expression of pro-inflammatory cytokines.32 Spin coated cellulose hydrogel was reported to lower the 24 h-microglia adhesion by 80% in vitro.11 In vivo studies showed that photo-polymerized poly(ethylene glycol)-based hydrogel exhibits lower microglia adhesion after 56 days of implantation,33 and poly(vinyl alcohol)/poly(acrylic acid) hydrogel reduced microglia adhesion by 30% after six weeks of implantation.34
An important factor to consider in hydrogel surface engineering of microelectrodes is the effect of modification on neural signal recording. For non-charged hydrogels, such as alginate, significant signal loss was observed at 5 μm-thickness due to spatial displacement of neurons.35 On the other hand, mixed charged nitrocellulose-based hydrogel of micron thickness has been studied, which showed no increase in electrode impedance.19 At sub-micron thickness, charged hydrogels were reported to reduce electrode impedance due to the presence of an ionic conductive layer in contact with electrodes.36 Lowering electrode impedance is particularly important for ultra-small multi-electrode arrays1,37 as smaller electrodes can further reduce neural tissue damage after implantation38,39 and improve biocompatibility.40 However, with reduced electrode size and increase in device complexity, challenges arise in hydrogel surface engineering using traditional processing methods, such as spin coating,11,19 photo polymerization,33 and aqueous crosslinking.34
In this study, we investigated the synthesis of polyionic nanocoatings and the surface engineering of microelectrodes using an initiated chemical vapor deposition (iCVD) method, which combines free radical polymerization and chemical vapor deposition for in situ deposition of chain-growth polymers.41–44 Positively, negatively, and mixed-charged nanocoatings were synthesized and characterized. The in vitro cell culture tests showed that the mixed-charged polyionics presented minimum microglial adhesion among all the polyionics. Surface protein adsorption of bovine serum albumin (BSA) and laminin were also quantified. BSA was chosen as a model protein for the surface adsorption study. Laminin is a major glycoprotein of basement membrane that plays an important role in the adhesion of activated microglia.45,46 The vapor-deposited polyionics formed conformal nanocoatings around microelectrodes, indicating promising applications in surface engineering of ultra-small neural electrodes.
Experimental
Materials
Methacrylic acid (MAA, 99%), 2-dimethylamino ethyl methacrylate (DMAEMA, 98%), ethylene glycol diacrylate (EGDA, 90%), and tert-butyl peroxide (TBP, 98%) were purchased from Sigma-Aldrich and used without further purification. Silicon wafers (P/boron 〈100〉) were purchased from WRS Materials. Aclar film was purchased from Ted Pella. Monopolar microelectrodes were generously provided by FHC. BSA was purchased from Sigma-Aldrich. Mouse laminin (ultrapure) was purchased from BD. PBS (pH 7.4) was purchased from Fisher Scientific. Dodecyl sulfate sodium (SDS, 99%) was purchased from Acros. Micro BCA Protein Assay Kit was purchased from Pierce. Mouse C8-B4 microglia (CRL-2540) and Dulbecco's Modified Eagle's Medium (DMEM) were purchased from ATCC. Penicillin–streptomycin, Fetal Bovine Serum (FBS), and 0.25% trypsin–EDTA were purchased from Life Technologies.Nanocoating synthesis
Hybrid nanocoatings of poly(methacrylic acid-co-ethylene glycol diacrylate) (PME), poly(2-dimethylamino ethyl methacrylate-co-ethylene glycol diacrylate) (PDE), and poly(2-dimethylamino ethyl methacrylate-co-methacrylic acid-co-ethylene glycol diacrylate) (PDME) were synthesized using the iCVD method described in previous studies.41–44 The initiator of TBP was vaporized at room temperature and fed into the reactor using a mass flow controller (MKS, model 1479A). The monomers of DMAEMA and MAA were both vaporized at 50 °C and injected into the reactor using mass flow controllers (MKS, model 1153 and 1150). The crosslinker of EGDA was vaporized at 55 °C and injected through a needle valve (Swagelok). The flow rates of DMAEMA, MAA, and EGDA were varied (Table 1) at each stage of deposition to form a hybrid structure, while the TBP flow rate was maintained constant at 0.24 sccm. Inside the reactor, vapor monomers were heated up by a parallel array of nichrome filament (Ni80/Cr20, Goodfellow) that was resistively heated to 220 °C. Substrates for coating were placed on a water-cooled stage at 40 °C during deposition. The temperatures were monitored by thermocouples (Omega, Type K) that were directly attached to the filament and the stage. Pressure in the vacuum chamber was maintained at 300 mTorr using a butterfly valve (MKS, model 253B). The increase in thickness of the nanocoatings was measured in situ using an interferometry system with a 633 nm He–Ne laser (JDS Uniphase). The collected laser signal was recorded as cycling waves, and the thickness corresponding to each cycle, as measured via interferometry, was calibrated using variable-angle spectroscopic ellipsometry (VASE). The nanocoated samples were soaked in deionized water for 2 h, followed by rinsing three times to remove any un-crosslinked polymers.| Stage | Flow rate/sccm | Thickness/nm | |||
|---|---|---|---|---|---|
| MAA | DMAEMA | EGDA | |||
| PME | I | 0.56 | 0 | 0.26 | 200 |
| II | 0.56 | 0 | 0 | 50 | |
| PDE | I | 0 | 0.55 | 0.28 | 200 |
| II | 0 | 0.55 | 0 | 50 | |
| PDME | I | 0.36 | 0.03 | 0.40 | 200 |
| II | 0.36 | 0.03 | 0 | 50 | |
Characterizations
Fourier transform infrared (FTIR) spectra were collected by a Nicolet 6700 FTIR spectrometer using a DTGS detector under the transmission mode at 4 cm−1 resolution. Surface wettability was measured using a goniometer (Ramé-Hart, model 250-F1). Static contact angle was accessed by the standard sessile drop method using a 5 μL droplet of deionized water. Advancing and receding contact angles were accessed using the tilting plate method with a tilting speed of 1° s−1. Each measurement was repeated three times at different spots on all samples. The mobility factor (MF) of the surface was calculated from the advanced and receding contact angles (θa and θr, respectively) using the following equation: MF = (θa − θr)/θa.47 X-ray photoelectron spectroscopy (XPS) measurements were performed using a 300 W Mg Kα source and PHI double-pass cylindrical mirror analyzer with a pass energy of 50 eV. The morphology of the neural microelectrodes before and after coating was analyzed using a FEI Quanta 600 field-emission gun scanning electron microscope (SEM) operated at an acceleration voltage of 25 kV. Quartz crystal microbalance (QCM) measurements were performed using Q-Sense E1 equipped with QSX 301 sensors. The resonance frequency f was measured at the fundamental resonance frequency of 5 MHz and the third overtone. Experiments were conducted in a continuous flow cell using a peristaltic pump.Protein adsorption assay
Measurement of BSA and laminin surface adsorption was conducted on coated 96-well plates using the Micro BCA Protein Assay Kit. An aliquot of 100 μL of protein solution at 100 μg mL−1 was added to each well and incubated at 37 °C for 1 h, 24 h, or 168 h.48 After incubation, each well was rinsed by PBS for three times, followed by incubation with 100 μL SDS (3%) at 37 °C for 1 h. Subsequently, an aliquot of 50 μL was mixed with 50 μL BCA reagent at 37 °C for 2 h. Absorption at 562 nm was measured using an Infinite M200 multimode microplate reader (Tecan). Protein concentration was determined using the standard curve of BSA as reference.Microglia adhesion assay
C8-B4 microglia was cultured in DMEM supplemented with 10% FBS, 50 U mL−1 penicillin, and 50 μg mL−1 streptomycin. Due to the uneven microglia distribution observed in the wells of microplates, Aclar films were used for the adhesion assay. Microglia was seeded onto Aclar films placed in a 6-well plate at a density of 1 × 10⁵ cells per mL and 5 × 10⁴ cells per mL for the 24 h and 168 h adhesion tests, respectively. At the end of each cell test period, Aclar films were retrieved and rinsed with sterile PBS three times to remove any non-adherent cells. Microglia adhesion was observed under a DMI3000M microscope (Leica) and the digital images were recorded for five randomly selected, 1 × 1 mm2 fields of each sample. Average microglia adhesion density (cells per mm2) was calculated by quantifying the number of adherent cells through the image analysis of Leica Application Suite. The microglia adhesion experiments were run in triplicate.Statistics
Statistical analysis was performed using SAS software (SAS Institute Inc., Cary, N.C.). Statistical comparisons were made by one-way analysis of variance (Anova). The Student's t-test was used for post hoc evaluation of differences among groups. In all statistical evaluations, p < 0.05 was considered as statistically significant.Results and discussion
Hybrid polyionic nanocoatings
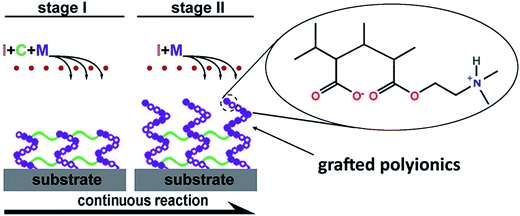
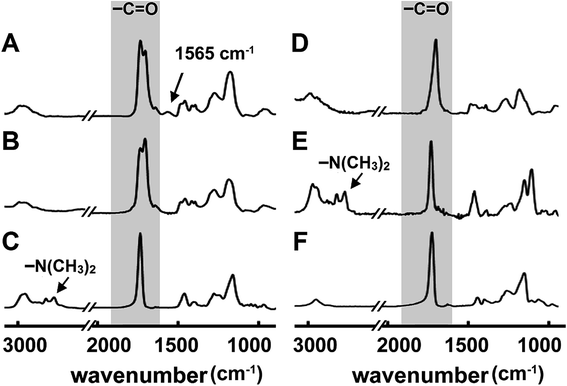
Polyionics of PME, PDE and PDME were synthesized using the one-pot, two-stage iCVD process illustrated in Fig. 1. Initially, vaporized monomers MAA and DMAEMA and the crosslinker EGDA were metered into the reaction chamber along with the initiator TBP. The process involves thermal decomposition of TBP over heated filaments to create free radicals in the vapor phase and subsequent free radical co-polymerization of the monomer and the crosslinker, forming crosslinked polyionics directly on the solid substrate. The advantage is that the substrate remained at relatively low temperatures (∼40 °C) and the method does not involve the use of any solvents since the entire process takes place in the vapor and solid phase. At the second stage, the flow of crosslinker was switched off, while the flow of monomer vapors was continued to allow grafting polymerization of polyionics from the unterminated radical sites of the crosslinked layer, resulting in surface enrichment with polyionics, which will be discussed later. Details of flow rate and thickness control at each stage are listed in Table 1. The resultant coating has a hybrid structure comprising a highly crosslinked bulk and a surface layer enriched with polyionics.The overall composition of the hybrid polyionic nanocoatings was characterized by FT-IR (Fig. 2). Homopolymers of poly(2-dimethylamino ethyl methacrylate) (PDMAEMA), poly(methacrylic acid) (PMAA), and poly(ethylene glycol diacrylate) (PEGDA) were also synthesized via iCVD for comparison. The absorption peak at 1702 cm−1 in the spectra of PMAA, PME, and PDME was assigned to C![[double bond, length as m-dash]](https://www.rsc.org/images/entities/char_e001.gif) O stretching of carboxyl in the MAA moiety,49 while the absorption peaks at 2772 and 2821 cm−1 in the spectra of PDMAEMA and PDE were assigned to C–H stretching of tertiary amine in the DMAEMA moiety.50 Interestingly, the C–H stretching bands at 2772 and 2821 cm−1 are not observed in the FT-IR spectrum of PDME, while an absorption peak is observed at 1565 cm−1. The new absorption peak was attributed to the close interaction between amine and carboxyl groups,51 which could possibly result in changes in the C–H stretching modes. The FT-IR of poly(methacrylic acid-co-2-dimethylamino ethyl methacrylate) (not shown) exhibited a similar absence of C–H stretching at 2772 and 2821 cm−1 and a slightly higher absorption at 1565 cm−1. The absorption at 1728 cm−1 and 1735 cm−1 shown in the spectra of PDME, PDE, and PME are assigned to C
O stretching of carboxyl in the MAA moiety,49 while the absorption peaks at 2772 and 2821 cm−1 in the spectra of PDMAEMA and PDE were assigned to C–H stretching of tertiary amine in the DMAEMA moiety.50 Interestingly, the C–H stretching bands at 2772 and 2821 cm−1 are not observed in the FT-IR spectrum of PDME, while an absorption peak is observed at 1565 cm−1. The new absorption peak was attributed to the close interaction between amine and carboxyl groups,51 which could possibly result in changes in the C–H stretching modes. The FT-IR of poly(methacrylic acid-co-2-dimethylamino ethyl methacrylate) (not shown) exhibited a similar absence of C–H stretching at 2772 and 2821 cm−1 and a slightly higher absorption at 1565 cm−1. The absorption at 1728 cm−1 and 1735 cm−1 shown in the spectra of PDME, PDE, and PME are assigned to C![[double bond, length as m-dash]](https://www.rsc.org/images/entities/char_e001.gif) O stretching in DMAEMA and EGDA, respectively. The assignment of FT-IR absorption bands is summarized in Table S1.† Overall, the above results indicated that DMAEMA, MAA, and EGDA were incorporated into the nanocoatings. The enrichment of DMAEMA and MAA moieties at the top surface of hybrid nanocoatings was verified by XPS survey scans. For example, the nitrogen to carbon (N/C) atomic ratio of hybrid PDE is 7% higher than the N/C ratio of homogeneous PDE, indicating higher concentration of DMAEMA at the top surface of hybrid PDE compared with the non-grafted PDE.
O stretching in DMAEMA and EGDA, respectively. The assignment of FT-IR absorption bands is summarized in Table S1.† Overall, the above results indicated that DMAEMA, MAA, and EGDA were incorporated into the nanocoatings. The enrichment of DMAEMA and MAA moieties at the top surface of hybrid nanocoatings was verified by XPS survey scans. For example, the nitrogen to carbon (N/C) atomic ratio of hybrid PDE is 7% higher than the N/C ratio of homogeneous PDE, indicating higher concentration of DMAEMA at the top surface of hybrid PDE compared with the non-grafted PDE.
Neural microelectrodes were engineered using the hybrid vapor deposition process. Fig. 3 shows the microelectrodes after the deposition of 250 nm-PDME nanocoating. Nanocoatings with thickness below 50 nm can be deposited,41,43 but this deposition condition was chosen to maintain the same composition as that of PDME nanocoating in characterization studies. Due to the vapor-based process, the nanocoating was conformal and uniform throughout the entire surface of each individual microelectrode. The conformal feature of iCVD nanocoatings has been clearly demonstrated in the surface engineering of nanostructures we previously reported.41,43 No change in the morphology of microelectrode was observed because of the huge dimension discrepancy between the 100 μm-microelectrode and the 250 nm-nanocoating. Compared with the solution-based methods in surface engineering of microelectrodes, the vapor deposition method provides the capability to work on electrodes with complex geometry, while maintaining the desired microstructure.52,53
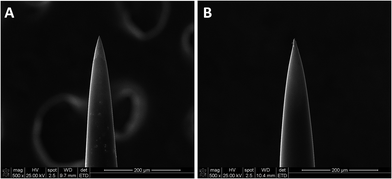 | ||
| Fig. 3 Neural microelectrodes before (A) and after (B) vapor-deposition of polyionic nanocoating. Scale bar: 200 μm. | ||
Surface wettability
The surface wettability of the polyionic nanocoatings was studied by measuring the sessile drop contact angle. The polyionics significantly improved the surface hydrophilicity with much lowered contact angle (Table 2).54 Similar to that observed on mixed charged zwitterionic coatings,55–57 the contact angle of PDME was lower than that of nanocoatings with single charges, possibly due to enhanced solvation of oppositely charged amine and carboxyl moieties.58 The contact angle of PME is higher than that of poly(methacrylic acid) brushes,59 indicating the presence of the crosslinker component on the hybrid nanocoating surface. The contact angle hysteresis of the hydrogel coatings was in the range of 31.4–39.3° (34.9° ± 4.0°), possibly due to the configuration change of polymer chains.60 The carboxyl and amine moieties were covered by hydrophobic moieties of polymer chains to minimize the surface free energy in air. On contacting with water, the carboxyl and amine moieties reoriented and covered the outer surface to minimize free energy in aqueous environment. The mobility factor of the polyionics was around 0.5, which is much lower than that of the linear zwitterionic polymers.61 The lowered mobility again indicated the presence of the crosslinker component on the outer surface, suggesting that the hybrid nanocoating composition can be optimized to further improve surface wettability.| θc (°) | θa (°) | θr (°) | Hysteresis | Mobility factor | |
|---|---|---|---|---|---|
| Control | 83.2 | 88.3 | 66.5 | 21.8 | 0.25 |
| PME | 65.2 | 73.7 | 34.4 | 39.3 | 0.53 |
| PDE | 57.9 | 64.7 | 33.3 | 31.4 | 0.48 |
| PDME | 55.4 | 61.2 | 27.1 | 34.1 | 0.56 |
Protein adsorption
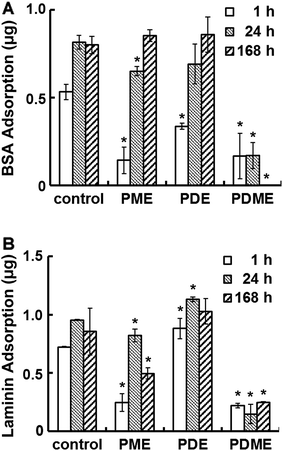
Fig. 4 shows the adhesion of BSA and laminin on PDE, PME, and PDME coated surfaces after incubating for various periods of time. In one hour, the BSA adsorption on PME, PDE and PDME coatings was 0.14 ± 0.08, 0.34 ± 0.02, and 0.17 ± 0.13 μg per well, respectively, compared with the control. After 24 h of incubation, BSA adsorption on PME and PDE increased to 0.65 ± 0.03 and 0.69 ± 0.11 μg per well, respectively, while the protein adsorption on PDME remained at 0.17 ± 0.08 μg per well. At 168 h, no detectable BSA adsorption was observed on PDME surface, while PME and PDE surfaces adsorbed 100% BSA compared with the uncoated surface. The difference in protein adsorption between surfaces with mixed charges and single charges (all positive or all negative) supports the notion that electrical neutrality is important in resisting protein adsorption.55 The dynamics of BSA adsorption on PME, PDE, and PDME was studied by monitoring the frequency change using QCM. As shown in Fig. S1,† the frequency of PDME coated sensor initially decreased and then backed up, and close-to-zero frequency change was recorded at 24 h. In contrast, the frequency of PDE coated sensors showed a trend of continuing declination as time progressed, ending with a frequency reduction of 24.6 Hz at 24 h. PME coated sensors showed a similar trend of continuing decrease in frequency. According to the Sauerbrey equation,62 the frequency reduction is linearly related with the mass of adsorbed protein. The difference in BSA adsorption behavior over time between PME, PDE, and PDME surfaces is consistent with the results observed in the static adsorption test, indicating the potential of using PDME in resisting protein adsorption in the long term.Compared with the un-coated surface, the adsorption of laminin on PME surface was reduced by 68%, 14%, and 50% in the 1 h, 24 h, and 168 h incubation period, respectively, while PDE surface demonstrated ∼20% increase in laminin adsorption regardless of the incubation time. Since laminin has negative charges at neutral pH,63 the substantial difference in laminin adsorption between PME and PDE indicated that the surface–protein electrostatic interaction possibly plays an important role in determining laminin adsorption.64 The self-assemble nature of laminin65 may also contribute to the increase in laminin absorption. In contrast, laminin adsorption on PDME surface was reduced to 0.22 ± 0.02, 0.15 ± 0.08, and 0.25 ± 0.01 μg per well within 1 h, 24 h, and 168 h, respectively. The reduction of protein adsorption on PDME could be attributed to the surface hydrophilicity in addition to charge neutrality due to the excess energy needed to replace water molecules during protein adhesion.66
Microglia adhesion
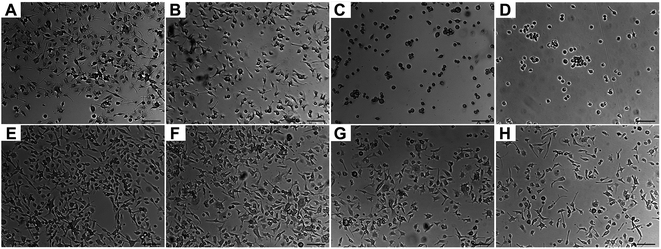
Microglia adhesion on the polyionic surfaces was observed using optical microscopy. Representative images are shown in Fig. 5. Morphologically, microglia had amoeboid appearance with pseudopods except on PDE and PDME, where microglia demonstrated a spherical morphology that indicates a lower affinity67 at 24 h. The viability of microglia on PDE and PDME was confirmed after transferring and culturing these microglia into regular cell plates, suggesting that the significant reduction in lamellipodia and filopodia was possibly due to the resistance to microglia adhesion and spreading.The adhesion of microglia decreased on all the surfaces of polyionic nanocoatings (Fig. 6). At 24 h, cell numbers of microglia on PME, PDE, and PDME were reduced by 22%, 35%, and 50%, respectively. At 168 h, the microglia adhesion on PME, PDE, and PDME coatings decreased by 20%, 45%, and 54%, respectively. The decreased microglia adhesion can be associated with the increasing surface wettability, which leads to lower cell attachment68 and reduced cell proliferation rate.69 Overall, the surface of PDME was very effective in repelling microglia adhesion in vitro.
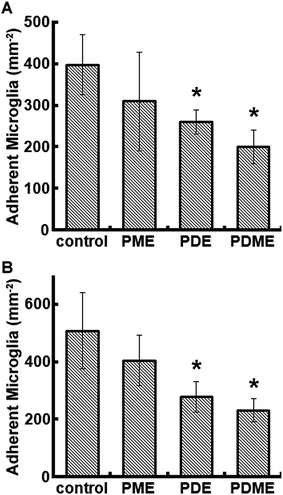 | ||
| Fig. 6 Quantified microglia adhesion on polyionic surfaces after 24 h (A) and 168 h (B) of cell culture. Significant difference: *p < 0.05. | ||
Conclusions
Nanocoatings with polyionics enriched at the surface were synthesized using the iCVD process. Conformal surface engineering of neural microelectrodes was achieved using this single-step, vapor-based method, and the surface ionic composition was facilely tailored. Adhesion of microglia was reduced on all the polyionic modified surfaces, and the polyionics with mixed charges presented the lowest microglial adhesion with more than 50% reduction in adherent microglia after seven days. In addition, polyionics with mixed charges significantly reduced the surface adsorption of laminin and BSA. The vapor-based nanocoating synthesis bypasses the use of any liquid medium and can be used for the surface engineering of a wide variety of biomedical devices.Conflicts of interest
There are no conflicts to declare.Acknowledgements
We are grateful for support from CAREER Award of National Science Foundation (CMMI 1056074). We also thank the Oklahoma State University Microscopy Laboratory for the SEM experiments.References
- Z. J. Du, X. L. Luo and C. L. Weaver, et al., J. Mater. Chem. C, 2015, 3, 6515–6524 RSC.
- T. C. Liu, M. C. Chuang and C. Y. Chu, et al., ACS Appl. Mater. Interfaces, 2016, 8, 187–196 CAS.
- G. Deuschl, C. Schade-Brittinger and P. Krack, et al., N. Engl. J. Med., 2006, 355, 896–908 CrossRef CAS PubMed.
- C. de Hemptinne, N. C. Swann and J. L. Ostrem, et al., Nat. Neurosci., 2015, 18, 779–786 CrossRef CAS PubMed.
- M. A. L. Nicolelis, Nat. Rev. Neurosci., 2003, 4, 417–422 CrossRef CAS PubMed.
- A. B. Schwartz, X. T. Cui and D. J. Weber, et al., Neuron, 2006, 52, 205–220 CrossRef CAS PubMed.
- T. Aflalo, S. Kellis and C. Klaes, et al., Science, 2015, 348, 906–910 CrossRef CAS PubMed.
- L. R. Hochberg, M. D. Serruya and G. M. Friehs, et al., Nature, 2006, 442, 164–171 CrossRef CAS PubMed.
- J. P. Seymour and D. R. Kipke, Biomaterials, 2007, 28, 3594–3607 CrossRef CAS PubMed.
- A. Canales, X. Jia and U. P. Froriep, et al., Nat. Biotechnol., 2015, 33, 277–284 CrossRef CAS PubMed.
- B. K. Leung, R. Biran and C. J. Underwood, et al., Biomaterials, 2008, 29, 3289–3297 CrossRef CAS PubMed.
- S. Ivens, D. Kaufer and L. P. Flores, et al., Brain, 2007, 130, 535–547 CrossRef PubMed.
- S. Franz, S. Rammelt and D. Scharnweber, et al., Biomaterials, 2011, 32, 6692–6709 CrossRef CAS PubMed.
- G. W. Kreutzberg, Trends Neurosci., 1996, 19, 312–318 CrossRef CAS PubMed.
- J. A. Chikar, J. L. Hendricks and S. M. Richardson-Burns, et al., Biomaterials, 2012, 33, 1982–1990 CrossRef CAS PubMed.
- E. Azemi, C. F. Lagenaur and X. T. Cui, Biomaterials, 2011, 32, 681–692 CrossRef CAS PubMed.
- C. L. Kolarcik, D. Bourbeau and E. Azemi, et al., Acta Biomater., 2012, 8, 3561–3575 CrossRef CAS PubMed.
- C. Edward Coffey, W. E. Wilkinson and R. D. Weiner, et al., Biol. Psychiatry, 1993, 33, 442–449 CrossRef.
- Y. Zhong and R. V. Bellamkonda, J. Controlled Release, 2005, 106, 309–318 CrossRef CAS PubMed.
- Y. Zhong and R. V. Bellamkonda, Brain Res., 2007, 1148, 15–27 CrossRef CAS PubMed.
- S. M. Gutowski, J. T. Shoemaker and K. L. Templeman, et al., Biomaterials, 2015, 44, 55–70 CrossRef CAS PubMed.
- E. Schmidt, B. Linz and S. Diekelmann, et al., Brain, Behav., Immun., 2015, 47, 178–185 CrossRef CAS PubMed.
- K. E. Crompton, J. D. Goud and R. V. Bellamkonda, et al., Biomaterials, 2007, 28, 441–449 CrossRef CAS PubMed.
- L. K. Povlich, J. C. Cho and M. K. Leach, et al., Biochim. Biophys. Acta, Gen. Subj., 2013, 1830, 4288–4293 CrossRef CAS PubMed.
- J. D. Nickels and C. E. Schmidt, J. Biomed. Mater. Res., Part A, 2013, 101, 1464–1471 CrossRef PubMed.
- T. D. Y. Kozai, A. S. Jaquins-Gerstl and A. L. Vazquez, et al., Biomaterials, 2016, 87, 157–169 CrossRef CAS PubMed.
- Y. Zhong, X. Yu and R. Gilbert, et al., J. Rehabil. Res. Dev., 2001, 38, 627–632 CAS.
- S. P. Massia, M. M. Holecko and G. R. Ehteshami, J. Biomed. Mater. Res., Part A, 2004, 68, 177–186 CrossRef PubMed.
- Y. Arima and H. Iwata, Biomaterials, 2007, 28, 3074–3082 CrossRef CAS PubMed.
- M. E. Schroeder, K. M. Zurick and D. E. McGrath, et al., Biomacromolecules, 2013, 14, 3112–3122 CrossRef CAS PubMed.
- H. W. Chien, C. C. Tsai and W. B. Tsai, et al., Colloids Surf., B, 2013, 107, 152–159 CrossRef CAS PubMed.
- A. W. Bridges, N. Singh and K. L. Burns, et al., Biomaterials, 2008, 29, 4605–4615 CrossRef CAS PubMed.
- K. B. Bjugstad, K. Lampe and D. S. Kern, et al., J. Biomed. Mater. Res., Part A, 2010, 95, 79–91 CrossRef CAS PubMed.
- Y. Lu, D. F. Wang and T. Li, et al., Biomaterials, 2009, 30, 4143–4151 CrossRef CAS PubMed.
- D. Kim, J. A. Wiler and D. J. Anderson, et al., Acta Biomater., 2010, 6, 57–62 CrossRef CAS PubMed.
- Y. Y. Duan, G. M. Clark and R. S. C. Cowan, Biomaterials, 2004, 25, 3813–3828 CrossRef CAS PubMed.
- Z. J. Du, X. Luo and C. L. Weaver, et al., J. Mater. Chem. C, 2015, 3, 6515–6524 RSC.
- R. V. Shannon, IEEE Trans. Biomed. Eng., 1992, 39, 424–426 CrossRef CAS PubMed.
- D. R. Merrill, M. Bikson and J. G. R. Jefferys, J. Neurosci. Methods, 2005, 141, 171–198 CrossRef PubMed.
- T. D. Y. Kozai, N. B. Langhals and P. R. Patel, et al., Nat. Mater., 2012, 11, 1065–1073 CrossRef CAS PubMed.
- Y. Ye and Y. Mao, J. Mater. Chem., 2011, 21, 7946–7952 RSC.
- Y. Ye, Q. Song and Y. Mao, J. Mater. Chem., 2011, 21, 13188–13194 RSC.
- Y. Ye, Y. Mao and H. Z. Wang, et al., J. Mater. Chem., 2012, 22, 2449–2455 RSC.
- Y. Ye and Y. Mao, RSC Adv., 2017, 7, 24569–24575 RSC.
- R. Milner and I. L. Campbell, J. Neurosci., 2002, 22, 1562–1572 CAS.
- T. Wang, W. Zhang and Z. Pei, et al., FASEB J., 2006, 20, 906–915 CrossRef CAS PubMed.
- K. Futamura, R. Matsuno and T. Konno, et al., Langmuir, 2008, 24, 10340–10344 CrossRef CAS PubMed.
- L. Wang, W. Wang and L. Di, et al., Colloids Surf., B, 2010, 80, 72–78 CrossRef CAS PubMed.
- F. B. De Sousa, J. D. T. Guerreiro and M. Ma, et al., J. Mater. Chem., 2010, 20, 9910–9917 RSC.
- K. Yliniemi, B. P. Wilson and F. Singer, et al., ACS Appl. Mater. Interfaces, 2014, 6, 22393–22399 CAS.
- L. D. Deng, Y. L. Zhai and S. T. Guo, et al., J. Nanopart. Res., 2009, 11, 365–374 CrossRef CAS.
- Y. Hargsoon, C. D. Devesh and R. Vasuda, et al., Nanotechnology, 2008, 19, 025304 CrossRef PubMed.
- S. Sommakia, H. C. Lee and J. Gaire, et al., Curr. Opin. Solid State Mater. Sci., 2014, 18, 319–328 CrossRef CAS PubMed.
- L. S. Puah, R. Sedev and D. Fornasiero, et al., Langmuir, 2010, 26, 17218–17224 CrossRef PubMed.
- R. E. Holmlin, X. X. Chen and R. G. Chapman, et al., Langmuir, 2001, 17, 2841–2850 CrossRef CAS.
- L. Mi, M. T. Bernards and G. Cheng, et al., Biomaterials, 2010, 31, 2919–2925 CrossRef CAS PubMed.
- Z. Q. Cao and S. Y. Jiang, Nano Today, 2012, 7, 404–413 CrossRef CAS.
- R. G. Laughlin, Langmuir, 1991, 7, 842–847 CrossRef CAS.
- R. Dong, M. Lindau and C. K. Ober, Langmuir, 2009, 25, 4774–4779 CrossRef CAS PubMed.
- J. H. Wang, P. M. Claesson and J. L. Parker, et al., Langmuir, 1994, 10, 3887–3897 CrossRef CAS.
- Y. Xu, M. Takai and K. Ishihara, Biomaterials, 2009, 30, 4930–4938 CrossRef CAS PubMed.
- G. Sauerbrey, Z. Phys., 1959, 155, 206–222 CrossRef CAS.
- H. von der Mark, E. Poschl and H. Lanig, et al., J. Mol. Biol., 2007, 371, 1188–1203 CrossRef CAS PubMed.
- T. Ekblad, O. Andersson and F. I. Tai, et al., Langmuir, 2009, 25, 3755–3762 CrossRef CAS PubMed.
- Y. S. Cheng, M. F. Champliaud and R. E. Burgeson, et al., J. Biol. Chem., 1997, 272, 31525–31532 CrossRef CAS PubMed.
- H. Noh and E. A. Vogler, Biomaterials, 2006, 27, 5801–5812 CrossRef CAS PubMed.
- N. Stence, M. Waite and M. E. Dailey, Glia, 2001, 33, 256–266 CrossRef CAS PubMed.
- X. Dou, D. Zhang and C. Feng, Langmuir, 2013, 29, 15359–15366 CrossRef CAS PubMed.
- Y. W. Wang, Q. Wu and G. Q. Chen, Biomaterials, 2003, 24, 4621–4629 CrossRef CAS PubMed.
Footnote |
| † Electronic supplementary information (ESI) available: Dynamics of 24 h BSA adsorption on polyionics with single and mixed charges studied by monitoring the frequency change using QCM. See DOI: 10.1039/c7ra12728f |
| This journal is © The Royal Society of Chemistry 2018 |

