 Open Access Article
Creative Commons Attribution 3.0 Unported Licence
Enhanced capacitive deionization performance by an rGO–SnO2 nanocomposite modified carbon felt electrode†
Syed Kamran Sami ab,
Jung Yong Seoa,
Suh-Eun Hyeona,
Md. Selim Arif Shershaha,
Pil-Jin Yoo
 *a and
Chan-Hwa Chung
 *a
*a
aSchool of Chemical Engineering, Sungkyunkwan University (SKKU), Suwon 16419, Republic of Korea. E-mail: chchung@skku.edu; Fax: +82-31-290-7272; Tel: +82-31-290-7260
bDepartment of Chemical Engineering, Balochistan University of Information Technology, Engineering and Management Sciences (BUITEMS), Quetta 87300, Pakistan
First published on 23rd January 2018
Abstract
The capacitive deionization (CDI) is a potential desalination technology in which brackish water flows between electrodes; by this process, ions are generated and stored in an electrical double layer formed at the electrode surface. In this work, we report efficient electrode materials which enable the capacitive deionization system to overcome the several issues of desalination. The rGO–SnO2 nano-composite has been fabricated by an eco-friendly and facile hydrothermal process. The synthesized composite presents an improvement in electrochemical performance and an excellent capacitance retention of 60% even at relatively high scan-rates. In a specially designed CDI cell, the synthesized nanocomposite has shown excellent cyclic performance, high reversibility, and a remarkable electrosorption capacity of 17.62 mg g−1 at an applied potential of 1.2 V with an initial salt concentration of 400 mg L−1. The enhancement in electrosorption capacity of the electrode emerges due to its high specific capacitance in NaCl aqueous solution. Moreover, the system has shown a fast ion-removal rate with excellent stability and reversibility in an aqueous sodium-chloride (NaCl) solution. These results suggest that the rGO–SnO2 composite prepared in this work is a feasible electrode material for desalination in the capacitive deionization process.
Introduction
Fresh water is quickly becoming a limited resource due to rising global demand being higher than availability. In fact, the United Nations estimates one-third of the world's population is living in water-stressed regions, and these numbers are expected to double by 2025.1 The potential solution to the aforementioned problem is seawater desalination because more than 97% of the earth's water is seawater.2 The desalination technology is a significant approach to improving the quality of water. Several commendable reports on water desalination have been rated as momentous. So far, reverse osmosis (RO) and thermal processes to remove the salt ions from seawater are generally used.3 However, they are inadequate for application on a large commercial scale due to massive energy consumption and high costs. Numerous other desalination technologies like multistage flash distillation (MSF) and electrodialysis have been developed but, they are limited in application due to the requirement of an excessive amount of energy and maintenance, and they also need complex and expensive infrastructures.4Instead, the capacitive deionization (CDI) has been developed as a prospective water desalination technique and pertinent solution to obtain clean water because of its energy-efficient, environment-friendly and low-cost process step to remove salt ions from seawater. The working mechanism of CDI is based on the charging principle on the electrodes of an electric double-layer capacitor (EDLC); the salt ions adsorption took place at the electrodes surface where the double layer formed at e by applying a voltage and the regeneration of the electrodes when the charge is removed.5,6 Therefore, for practical CDI application, the development of efficient electrode materials with good absorption and desorption capacity is very vital.7
The basic mechanism of capacitive deionization (CDI) depends on good conductivity and high specific capacitance, chemical and electrochemical stability, good reversibility, wettability and fast electrosorption response of electrode materials. In view of aforementioned physiognomies, the carbon-based materials are promising candidates for efficient electrode materials for CDI. Various carbon-based materials such as activated carbon,8 carbon aerogel,9,10 mesoporous carbon,11,12 carbon nanotube,13–15 and graphene nanomaterials9,16,17 have been investigated for the electrode materials of CDI cells. Porada et al. proposed thin porous carbon wires and carbide-derived carbon electrodes for application in capacitive desalination.18 Kuipers et al. also developed an advanced conceptual design of CDI using porous carbon-electrode cells for wireless desalination.19 Recently, Wang et al. reported the fabrication of electrodes made up of hierarchically structured carbon nano-fibrous web for reducing the mass-transport limitation nearby the CDI electrodes.20 The use of activated carbon cloth (ACC) electrodes, modified with metal oxides, has been also proposed by Ryoo et al. in order to enhance the electrosorption that led to the improvement of CDI performance.21 The carbonaceous materials, however, are facing the main drawback of the low specific capacitance.
To overcome the problem consequently, the novel approaches in CDI technology has been developed to enhance the performance of carbon-based electrodes by incorporation of other materials.22,23 Several researchers have synthesized graphene-based mesoporous carbon composites as an electrode for CDI applications.17,24 In the typical reduction process of graphene-oxide, however, the agglomeration of graphene sheets occurs, which causes a decrement in surface area and uncontrollable pore-size distribution.25 For example, the synthesized graphene/mesoporous carbon composite revealed an electrosorption capacity of 0.73 mg g−1 at 2.0 V.26 To avoid this agglomeration of graphene sheets, the several approaches to suppress the re-stacking of graphene sheets have been adopted, consequently improving their CDI performance. The graphene oxide has been reduced with pyridine (also as an exfoliation agent) and the reduced graphene showed an electrosorption capacity of 0.88 mg g−1. The 1.41 mg g−1 electrosorption capacity has been also achieved with high surface area graphene–CNT composite.27 Recently, another approach to alleviate agglomeration of graphene sheets was reported using the aerosol, and the fabricated electrode demonstrates the promising electrosorption capacity of 3.47 mg g−1 at a voltage of 2.0 V.28 Regardless of these achievements, further vital efforts are needed to improve the CDI performance more by fully utilizing the surface area and optimizing the pore-size distribution of graphene.
The reduced graphene-oxide (rGO) has engrossed the remarkable attention, due to its large surface areas, electrical conductivity, and significant stability. The rGO itself has been extensively investigated as an advanced electrode material in the application of energy storage devices including the CDI technology.29–31 Because of the aggregation of graphene sheets, however, there is a limitation in improvement of its performance. When the nano-sized metal-oxide particles are composited with rGO, the metal-oxide particles are known to intercalate into the graphene sheets, which is helpful in overcoming the aggregation problem and improving the cell performance.30,31 Among several metal oxides, the SnO2 deliberated to be a potential candidate for various electrochemical applications because of its environmental-friendliness, good stability, good capacitance, and fairly low cost.32 The rGO–SnO2 nano-composites, as an electrode material for supercapacitors and Li-ion batteries show remarkable electrochemical performance and stability.33,34
In this work, we propose a simple, facile, and eco-friendly synthetic process to fabricate rGO/metal-oxide composite materials. The synthesized nano-composite has been studied as an electrode material in capacitive deionization (CDI) under different potential values. Electro-sorption performance of the synthesized nano-composite has been investigated and the role of metal oxide on the electrochemical performance has been also studied. The presence of SnO2 nanoparticles on rGO sheets increases the surface contact and also shows distinctive improvement in electrosorption performance.
Experimental
Materials
Graphite powder, tin chloride (SnCl2·2H2O) and sodium borohydride (NaBH4) were purchased from Sigma-Aldrich. NaNO3 (99.0%) was obtained from Yakuri Pure Chemicals Co. Ltd. Japan. H2SO4 (95.0%), KMnO4 (99.3%), and H2O2 (34.5%) were purchased from Samchun Chemical Co. Ltd., Korea. All the chemicals were used as received and without further purification.Synthesis of graphene oxide
Graphene oxide (GO) was prepared from graphite powder using a modified Hummer's method. An appropriate amount of graphite flakes and NaNO3 were added into H2SO4 and stirred until dissolved. Then, KMnO4 was slowly added, and the mixture was stirred continuously for 1 h. After the mixture was further diluted by adding 40 mL de-ionized (DI) water slowly and heated at 90 °C, H2O2 was added to reduce the permanganate and manganese dioxide changing to colorless soluble manganese sulfate, and the resulting suspension was filtered. The obtained yellow-brown suspension was exfoliated to produce single-layer graphene oxide using a sonicator, and the unexfoliated precipitation was removed by centrifugation. Finally, we obtained a brown dispersion of homogeneously exfoliated graphene oxide, as reported by Shah et al.35Synthesis of rGO–SnO2 composite
For the synthesis of the composites, an appropriate amount of a GO dispersed in DI water. The resulting mixture was sonicated for 2 hours. Then, a suitable amount of tin precursor, SnCl2·2H2O and NaBH4 were added to the dispersion under continuous stirring. The resulting mixture was vigorously stirred again for over 1 hour. The solution was then transferred to a 50 mL Teflon-lined autoclave. The autoclave was placed in an oven at a constant temperature of 120 °C for 12 h. The sample was then placed in the centrifuge at 9000 rpm for 5 min to separate the prepared composite from the solvent. After the prepared rGO–SnO2 composite powders were washed with DI water several times to remove the acidic solvent, the powders were dried at 60 °C overnight.Electrode fabrication
The rGO–SnO2 electrode was prepared as follows. Firstly, the synthesized rGO/SnO2 composite of 80 wt% was mixed with 10 wt% carbon black (Super P, Timcal Graphite, and carbon) as a conducting agent and a binder of 10 wt% polytetrafluoroethylene (PTFE, Sigma-Aldrich). It was mixed again with few drops of NMP to obtain a uniform slurry. The resulting slurry was cast on carbon felt constructing a uniform film layer of materials on the electrode. The fabricated electrode was dried in vacuum at 60 °C for 12 h to remove the remaining solvent. The size of the prepared electrode was 2.5 cm × 2.5 cm.Electrochemical characterization of the electrodes
Cyclic voltammetry and galvanostatic charge/discharge tests were performed to examine the electrochemical properties of the rGO–SnO2 electrode using electrochemical workstation (ZIVE SP1, WonATech, Inc.). The cyclic voltammetry was conducted using a three-electrode configuration in the electrolyte of 0.1 M, 0.5 M, or 1.0 M aqueous NaCl solution. The rGO–SnO2 electrode was examined as the working electrode, a platinum plate was employed as a counter electrode, and a NaCl-saturated Ag/AgCl electrode was used as the reference electrode. The galvanostatic charge/discharge tests for capacitive deionization (CDI) were conducted on the symmetric two electrodes of activated rGO–SnO2 electrodes. The specific capacitance (CS) was calculated from cyclic voltammetry curves according to the eqn (1):
 | (1) |
Desalination performance test
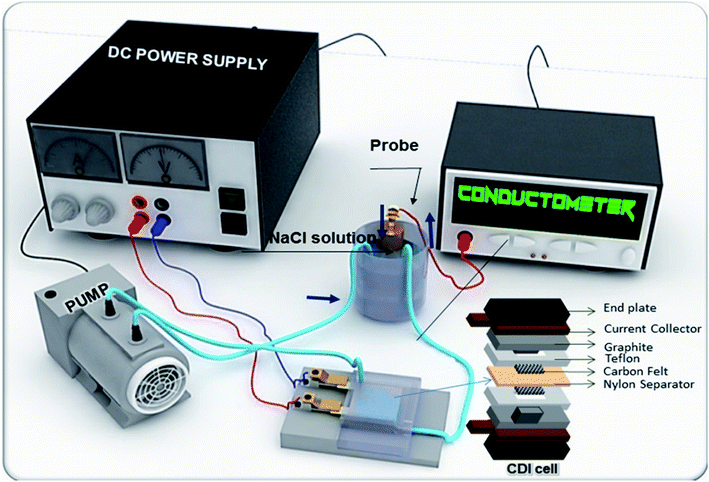
The desalination performance of CDI cell was examined in a flow-through batch system. The CDI module cell was composed of rGO–SnO2 electrodes (2.5 cm × 2.5 cm), a 200 μm-thick nylon spacer, and current collectors of graphite sheets and copper plates. The cell was connected to a peristaltic pump that controlled a flow rate of 10 mL min−1, and a total volume of the solution was 15 mL during the test. The electrolyte with an initial concentration of 400 mg L−1 has been used, of which conductivity is 566 μS cm−1. The NaCl content was varied from 100 mg L−1 to 1000 mg L−1.The deionization test was initiated with charging step, in which by applying a constant voltage to the electrode, the ion adsorption was achieved until the conductivity of solution stopped decreasing. After that, the captured ions were released by changing the polarity until the conductivity of the outlet solution reached the initial conductivity. During the test, the effluent conductivity was measured using a conductivity meter.
Electrosorption capacity measurement
The electrosorption capacity (Sc) of the electrode was calculated according to the eqn (2):36
 | (2) |
Characterization
The morphology of synthesized rGO–SnO2 was investigated using field-emission scanning electron microscopy (FESEM, JSM7000F JEOL). Transmission electron microscopy (TECNAI G2 instrument). The degree of crystallinity was also analyzed by X-ray diffractometer (XRD) (D8 Focus, Bruker Instruments, Germany) using Cu Kα radiation in the 2θ range from 10° to 80° at a scan rate of 3° min−1.The chemical properties of the obtained rGO–SnO2 nano-composite were characterized using Fourier-transformed infra-red (FTIR) spectroscope (JASCO, FT/IR-4700). All the FTIR spectra were collected in transmittance mode in the spectral range of 400–4000 cm−1 wavenumber. Raman spectra were also taken using a Micro-Raman Spectrometer system (ALPHA 300 M, WITec, Germany).
The X-ray photoelectron spectroscopy (XPS) characterization (ESCA 2000 instrument, VG Microtech, United Kingdom) was performed using an Al Kα X-ray source. All binding energy values were corrected by calibrating the C 1s peak at 284.6 eV. High-resolution peaks were de-convoluted using Gaussian–Lorentzian functions with the identical full-width at half maxima (FWHM) and Shirley background subtraction. The Brunauer–Emmett–Teller (BET) specific surface area and porosity of the samples were also evaluated on the basis of nitrogen adsorption isotherms measured at −196 °C using a gas adsorption apparatus (ASAP 2020, Micromeritics, USA).
Results and discussion
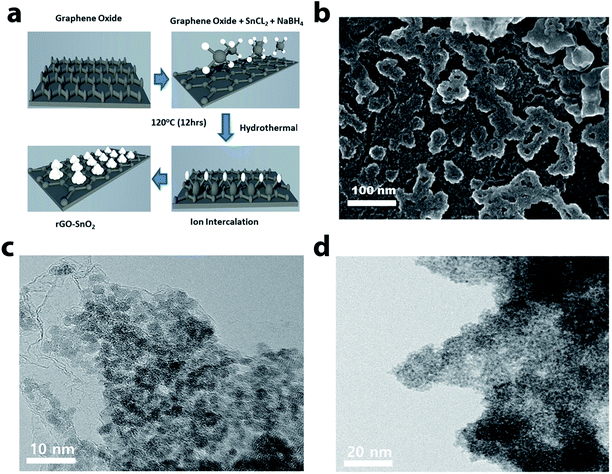
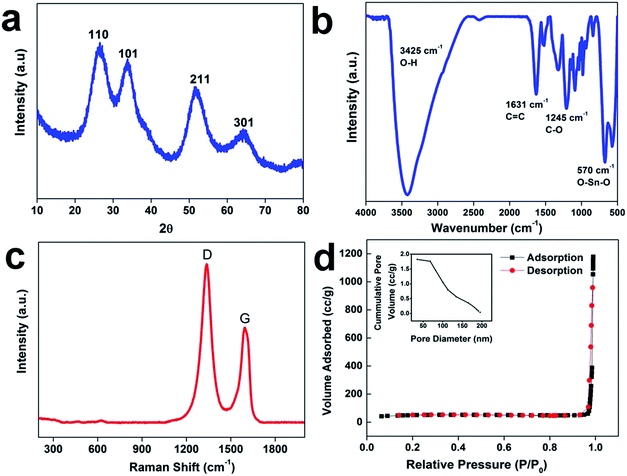
The scheme of the fabrication process of the rGO–SnO2 nanocomposite is demonstrated in Fig. 1a. The surface of GO is negatively charged because of oxygen-containing functional groups, so positively charged Sn2+ ions are decorated over the GO nanosheets via electrostatic attraction. From the microscopic images of Fig. 1b and c, it is evident that SnO2 nanoparticles coexist with rGO. A high-resolution TEM (HRTEM) image of rGO–SnO2 nano-composite shown in Fig. 1d clearly depicts that highly crystalline and a few nm-sized SnO2 nanoparticles were obtained even with our relatively mild synthetic procedure. This TEM image also represents that the SnO2 nanoparticles do not form any aggregates.Crystallic structures of the synthesized nanocomposite were characterized by powder X-ray diffraction (XRD) measurements. The 2θ peak at of 26.5°, 33.9°, 51.8°, and 64.9° is indexed to the (110), (101), (211), and (112) crystal planes of SnO2, respectively, as presented in Fig. 2a. These results confirm that the synthesized SnO2 is rutile (JCPDS card number 1-625). The GO characteristic peak, which normally appears between 10–12° of 2θ value, is not evident. It confirms that the reduction of GO has proceeded. These results prove the successful synthesis of nano-scale SnO2 particles, of which XRD peaks are broadened. The chemical composition of the synthesized materials was monitored by FTIR analysis (cf. Fig. 2b). The FTIR spectrum of rGO/SnO2 powders shows C![[double bond, length as m-dash]](https://www.rsc.org/images/entities/char_e001.gif) C and O–H stretching vibrations at 1631 cm−1 and 3425 cm−1, respectively. It also displays two peaks near 570 cm−1, which are due to Sn–O–Sn and O–Sn–O stretching vibrations. Apart from these peaks, the spectrum shows peaks at 1245 cm−1 of C–O–C stretching vibration. Raman spectral analysis is also an effective approach to monitoring the significant structural changes and state of graphene nanosheets. Fig. 2c depicts the Raman spectrum of the rGO–SnO2 nanocomposite. Two main characteristics peaks are observed at 1338 cm−1 and 1594 cm−1, which corresponds to the D and G band of graphene, respectively. It is clearly evident that the D band has higher peak intensity than G band, which represents the reduction of graphene.
C and O–H stretching vibrations at 1631 cm−1 and 3425 cm−1, respectively. It also displays two peaks near 570 cm−1, which are due to Sn–O–Sn and O–Sn–O stretching vibrations. Apart from these peaks, the spectrum shows peaks at 1245 cm−1 of C–O–C stretching vibration. Raman spectral analysis is also an effective approach to monitoring the significant structural changes and state of graphene nanosheets. Fig. 2c depicts the Raman spectrum of the rGO–SnO2 nanocomposite. Two main characteristics peaks are observed at 1338 cm−1 and 1594 cm−1, which corresponds to the D and G band of graphene, respectively. It is clearly evident that the D band has higher peak intensity than G band, which represents the reduction of graphene.
The internal porosity and microstructure of the samples were investigated with nitrogen adsorption–desorption measurements. Fig. 2d represents a typical type-III isotherm with an H3 hysteresis loop of rGO–SnO2 according to IUPAC nomenclature, which demonstrates the mesoporous nature of the rGO–SnO2 nanoparticles identified in FESEM and TEM images. The Brunauer–Emmett–Teller (BET) specific surface area of the sample was estimated to be 172 m2 g−1. The Barrett–Joyner–Halenda (BJH) average pore size was determined to be 15 nm, which reflects the presence of mesopores in rGO–SnO2. The corresponding pore volume was calculated to be 0.52 cm3 g−1. Dynamic contact angle measurement was used to study the wetting behaviors of the as-prepared materials is evident. The changes in the contact angles of electrodes before and after incorporation of SnO2 are compared in Fig. S3.†
The X-ray photoelectron spectroscopy (XPS) was used to further characterize the chemical state of the composites. The XPS survey spectrum (see Fig. 3a) shows that the composite consists of Sn, C and O. As shown in the high-resolution C 1s XPS spectra of rGO–SnO2, the four peaks are de-convoluted at 284.6 eV, 286.1 eV, 287.1 eV, and 288.2 eV (cf. in Fig. 3b). Each of the peaks is attributed to C![[double bond, length as m-dash]](https://www.rsc.org/images/entities/char_e001.gif) C, C–OH, C
C, C–OH, C![[double bond, length as m-dash]](https://www.rsc.org/images/entities/char_e001.gif) O and C–O–OH, respectively.37 The concentration of oxygen-containing groups decreased considerably in rGO–SnO2 fabrication process due to the reduction of GO. Although the reduction mechanism of GO by NaBH4 has not been fully investigated, it is speculated that the electron withdrawing due to NaBH4 can facilitate the proton generation for GO reduction.38 Moreover, oxygen functionalities also help to anchor the SnO2 nanoparticles on the rGO sheets, to which Sn2+ ions are attracted by the functional groups via electrostatic attraction. The high-resolution XPS spectrum of Sn 3d for rGO–SnO2 in Fig. 3c presents a doublet at 487.5 eV and 496.0 eV, which implies that Sn is present as SnO2.39 Based on the understanding of XRD data, microscopic observation, and spectroscopic characterizations, it can be concluded that the structurally regulated nano-composites of a few nm-sized SnO2 particles on rGO can be synthesized.
O and C–O–OH, respectively.37 The concentration of oxygen-containing groups decreased considerably in rGO–SnO2 fabrication process due to the reduction of GO. Although the reduction mechanism of GO by NaBH4 has not been fully investigated, it is speculated that the electron withdrawing due to NaBH4 can facilitate the proton generation for GO reduction.38 Moreover, oxygen functionalities also help to anchor the SnO2 nanoparticles on the rGO sheets, to which Sn2+ ions are attracted by the functional groups via electrostatic attraction. The high-resolution XPS spectrum of Sn 3d for rGO–SnO2 in Fig. 3c presents a doublet at 487.5 eV and 496.0 eV, which implies that Sn is present as SnO2.39 Based on the understanding of XRD data, microscopic observation, and spectroscopic characterizations, it can be concluded that the structurally regulated nano-composites of a few nm-sized SnO2 particles on rGO can be synthesized.
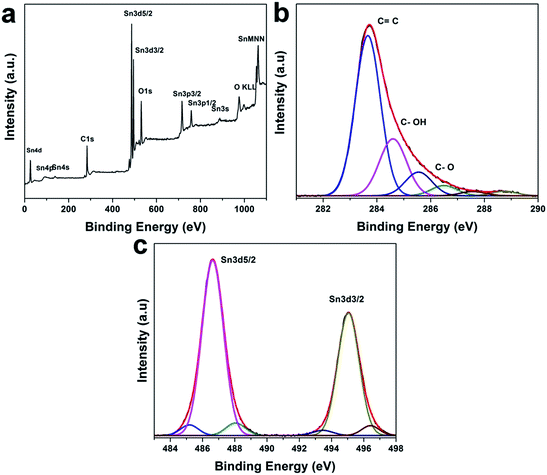 | ||
| Fig. 3 (a) XPS spectrum of the rGO–SnO2 nanocomposite. (b) High-resolution C 1s XPS spectra of shown rGO–SnO2. (c) High-resolution Sn 3d XPS spectra of shown rGO–SnO2. | ||
Electrochemical performance
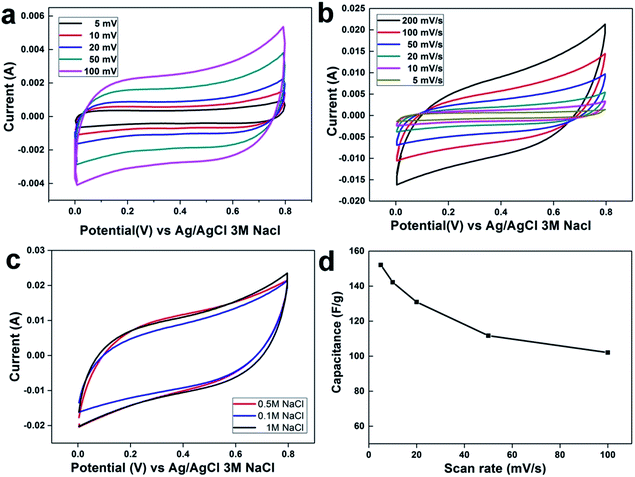
Cyclic voltammetry (CV) measurements are most important parameters for capacitance calculation of the fabricated electrode, as well as for the estimation of the electrosorption performance. Fig. 4a and b displays the CV profile of rGO and rGO–SnO2 composite electrodes, respectively, at different scan-rates from 5 mV s−1 to 100 mV s−1 in 0.5 M NaCl aqueous solutions. The effect of the SnO2 content on the electrosorption behavior of the rGO–SnO2 composite electrode was investigated. All introduced electrodes showed a quasi-rectangular shape and retain its shape even at the high applied potential range with no redox peaks. Suggesting the ions are attracted to the electrode surface due to columbic interactions in an electric double layer rather than redox reaction at the surface.21 It is evident that increment in CV curve area due to of ion-adsorption capacity and results in high specific capacitance. Its worth mentioning that the rGO–SnO2 composite electrodes display better cyclic voltammetry performance than rGO at all the NaCl concentrations. These CV curves shape are symmetric in about the current–potential axes without any distortion and no redox peaks at higher scan rates, which suggests ideal electric double-layer capacitive behavior and reversibility in ion electrosorption characteristics of the electrodes.As also noted in Fig. 4c, the CV area is changing little and saturated even with changing the NaCl concentration from 0.5 M to 1.0 M, which depicts that the rGO–SnO2 electrode provides sufficient adsorption sites for those ion concentrations. Compared to pristine rGO, rGO–SnO2 nano-composite has higher accessibility to accumulate a large amount of the salt ions attributing to the high wettability and hydrophilicity after incorporating SnO2 nanoparticles. rGO–SnO2 nano-composite electrode shows good electrochemical performance with increasing NaCl concentration solution which indicates high electrosorption capacity and hard saturation. Another interesting finding can be observed in Fig. 4c, all CV curves of the fabricated nanocomposite electrode illustrate that the amount of the incorporated SnO2 into graphene plays vital role in adsorption/desorption capacity.
Based on the ion adsorption mechanism pathway in both electrodes, the excellent adsorption efficiency for the rGO–SnO2 electrode can be attributed to: (i) incorporation of the SnO2 nanoparticles onto rGO sheets increases the hydrophilicity, (ii) agglomeration of rGO sheet has been prevented by uniform distribution of SnO2 nanoparticles which provide a quick and easy ions accumulation pathway on electrode surface, and (iii) polarization of pristine rGO has been reduced due to the more surface charge of SnO2 which can be attributed to improved capacitance and ion concentration on the double-layer.
The specific capacitance (CS) is a key factor to evaluate the CDI electrode materials behavior. The specific capacitances have been calculated from CV curves (eqn (1)) (cf. Experiment section). Generally, the specific capacitance dramatically decreases with increasing scan rate. The specific capacitances retention plot of the electrode materials corresponding to scan rates are shown in Fig. 4d. At 5 mV s−1 scan rate, the estimated specific capacitances were 48.2 F g−1 for rGO and 142.0 F g−1 for the rGO–SnO2 electrode. Although the estimated specific capacitance decreases with increasing the scan rate, as shown in Fig. 4d, the specific capacitance values for rGO–SnO2 electrode are always superior to those for rGO electrode. This effect of SnO2 in rGO–SnO2 composite electrode is possibly attributed to the increase in the specific surface area of rGO sheets when the SnO2 nanoparticles are doped.
Desalination performance
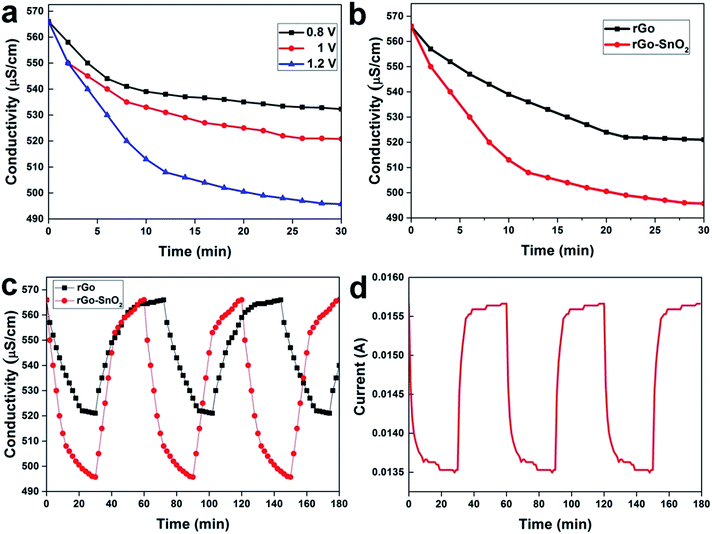
Batch mode experiments have been performed to evaluate the desalination performances of the fabricated electrodes as shown in Fig. 5, which were conducted in NaCl aqueous solution having an initial conductivity of 566 μS cm−1. Different voltages have been applied between two symmetrical electrodes in a CDI cell, and then the changes in the conductivity of the NaCl electrolyte are measured as in Fig. 6a. Namely, the decrease in the conductivity of the electrolyte is due to the capacitive deionization (or desalination) from the electrolyte by the applied potential on the electrodes. As a result of the ion removal from the electrolyte solution to the electrode surface, the conductivity of the electrolyte decreased rapidly in the first few minutes. The available surface on the electrode for the ions to be adsorbed gradually reduces until the electrodes become saturated; this is the equilibrium point where the solution conductivity reaches a time-independent value.In Fig. 6a, it is clearly seen that the rate of adsorption in the first stage is faster when a higher voltage is applied. At the potential of 1.2 V, the rate of adsorption was much higher than the other electrode materials reported earlier in the literature under the same condition (see Table S1 in the ESI†).
It can be observed that the concentration of NaCl aqueous solution varies directly with the conductivity, and from this relation, the ion electrosorption behavior of electrode under specific applied potential can be studied. As shown in Fig. 6a, the plot demonstrates conductivity decrement at the initial stage, which reflects initial adsorption rate of the salt ions. It shows the ion electrosorption capability of the investigated materials. When the time increases the conductivity of an effluent decreases and becomes constant, this can be attributed to the equilibrium point due to the saturation of electrode. The electrosorption capacity, calculated from the ratio of amount of salt removed at equilibrium to the weight of the active materials, is about 17.62 mg g−1 at 1.2 V. This value is higher than that of activated carbon, CNT, or any other rGO-based electrodes in other previous researches, which represents that the high porosity of the activated graphene electrode creates more accessible surface-sites for the ion adsorption.40–42 Enhancement of the electrosorption capacity at high salt concentration is attributed to two reasons; (1) the electrochemical double layer is more compacted at high salt concentration, resulting in higher electrostatic force and therefore more ions can be adsorbed on the electrode, and (2) the stronger ionic strength accelerates the ion transportation and consequently enhances the electrosorption capacity.42
The capacitive deionization behaviors of rGO–SnO2 and rGO electrodes were examined in 15 mL NaCl aqueous solution with an initial conductivity of 566 μS cm−1 and a flow rate of 5 mL min−1. The conductivity variation along with desalination time on the electrode with or without SnO2 doping on rGO is plotted in Fig. 6b when the applied voltage was 1.2 V and the desalination test was carried out for 30 min. Apparently, the rGO–SnO2 electrodes removed the ions from the solution faster and more than the rGO only electrode. The rGO–SnO2 electrode shows the highest electrosorption capacity of 17.62 mg g−1, whereas the electrosorption capacity of rGO electrode is 6.3 mg g−1. It is because the SnO2 nanoparticles well incorporate into the graphene sheets with low agglomeration. Fig. S5† demonstrate the electrosorption rate of rGO–SnO2 and rGO electrodes. The desorption ability of electrode is also important as same as electrosorption capacity, which represents electrode materials regeneration rate. Fig. 6c and d presents the conductivity of the solution and the current flow, respectively, during CDI adsorption–desorption cycles on the rGO–SnO2 and the rGO electrodes. The regeneration process of rGO–SnO2 electrode also shows high desorption efficiency-rate than that of rGO electrode. This can be convincingly inferred by the favorable porous structure, as well as the large surface area of the rGO–SnO2 electrodes. This demonstration in this study opens the scale-up possibility of CDI devices, using the high-surface-area, stable, and porous electrode materials of rGO–SnO2 nano-composite.
Conclusion
Efficient, facile, and environmentally friendly synthesis of rGO–SnO2 nano-composite has been accomplished. The SnO2 nanoparticles in rGO matrix are uniformly encapsulated with rGO sheets, and they have good morphology and high-surface-area. The synthesized rGO–SnO2 nano-composite, when it is used as electrode materials for symmetric CDI cell, reveals much better desalination performance than rGO. The rGO–SnO2 composite electrode demonstrates the remarkable adsorption–desorption capacity of 17.62 mg g−1, whereas the rGO only electrode presents only 6.3 mg g−1. This effect of SnO2 is possibly attributed to the increase in the specific surface area of rGO sheets when the SnO2 nanoparticles are incorporated. The synthesized rGO–SnO2 nano-composite can be considered as potential and efficient electrode materials on capacitive deionization for sea-water desalination.Conflicts of interest
There are no conflicts to declare.Acknowledgements
This research was supported by the Basic Science Research Program through the National Research Foundation of Korea (NRF) funded by the Ministry of Science, ICT and Future Planning (NRF-2016R1A2A2A05005327), and the Technology Innovation Program funded by the Ministry of Trade, Industry and Energy (MI, Korea) (10047681, Development of Low-Cost Conductive Paste Capable of Fine Pattern for Touch Panel and High Conductivity for Solar Cell Using Metal Composite with Core–Shell Structure Prepared by Highly Productive Wet Process).Notes and references
- M. A. Shannon, P. W. Bohn, M. Elimelech, J. G. Georgiadis, B. J. Mariñas and A. M. Mayes, Nature, 2008, 452, 301–310 CrossRef CAS PubMed.
- Y. Han, Z. Xu and C. Gao, Adv. Funct. Mater., 2013, 23, 3693–3700 CrossRef CAS.
- Y. Li, J. Shen, J. Li, X. Sun, J. Shen, W. Han and L. Wang, Carbon, 2017, 116, 21–32 CrossRef CAS.
- S. Porada, R. Zhao, A. Van Der Wal, V. Presser and P. M. Biesheuvel, Prog. Mater. Sci., 2013, 58, 1388–1442 CrossRef CAS.
- G. G. Lin and J. G. Scott, NIH Public Access, 2012, 100, 130–134.
- P. Liu, T. Yan, L. Shi, H. S. Park, X. Chen, Z. Zhao and D. Zhang, J. Mater. Chem. A, 2017, 5, 13907–13943 CAS.
- K. Adams, A. C. Greiner and J. M. Corrigan, Executive Summary, 2004 Search PubMed.
- L. Zou, G. Morris and D. Qi, Desalination, 2008, 225, 329–340 CrossRef CAS.
- A. G. El-Deen, R. M. Boom, H. Y. Kim, H. Duan, M. B. Chan-Park and J. H. Choi, ACS Appl. Mater. Interfaces, 2016, 8, 25313–25325 CAS.
- P. Xu, J. E. Drewes, D. Heil and G. Wang, Water Res., 2008, 42, 2605–2617 CrossRef CAS PubMed.
- C. J. Gabelich, T. D. Tran and I. H. Suffet, Environ. Sci. Technol., 2002, 36, 3010–3019 CrossRef CAS PubMed.
- H. H. Jung, S. W. Hwang, S. H. Hyun, K. H. Lee and G. T. Kim, Desalination, 2007, 216, 377–385 CrossRef CAS.
- M. Andelman, J. Mater. Chem. Eng., 2014, 2, 16–22 CAS.
- C. Nie, L. Pan, H. Li, T. Chen, T. Lu and Z. Sun, J. Electroanal. Chem., 2012, 666, 85–88 CrossRef CAS.
- D. Zhang, L. Shi, J. Fang and K. Dai, J. Mater. Sci., 2007, 42, 2471–2475 CrossRef CAS.
- M. S. Zoromba, M. H. Abdel-Aziz, M. Bassyouni, S. Gutub, D. Demko and A. Abdelkader, ACS Sustainable Chem. Eng., 2017, 5, 4573–4581 CrossRef CAS.
- H. Lei, T. Yan, H. Wang, L. Shi, J. Zhang and D. Zhang, J. Mater. Chem. A, 2015, 3, 5934–5941 CAS.
- S. Porada, B. B. Sales, H. V. M. Hamelers and P. M. Biesheuvel, J. Phys. Chem. Lett., 2012, 3, 1613–1618 CrossRef CAS PubMed.
- J. Kuipers and S. Porada, Sep. Purif. Technol., 2013, 120, 6–11 CrossRef CAS.
- G. Wang, C. Pan, L. Wang, Q. Dong, C. Yu, Z. Zhao and J. Qiu, Electrochim. Acta, 2012, 69, 65–70 CrossRef CAS.
- M. W. Ryoo, J. H. Kim and G. Seo, J. Colloid Interface Sci., 2003, 264, 414–419 CrossRef CAS PubMed.
- N. A. M. Barakat, A. G. El-Deen, G. Shin, M. Park and H. Y. Kim, Mater. Lett., 2013, 99, 168–171 CrossRef CAS.
- A. G. El-Deen, N. A. M. Barakat and H. Y. Kim, Desalination, 2014, 344, 289–298 CrossRef CAS.
- H. Duan, T. Yan, G. Chen, J. Zhang, L. Shi and D. Zhang, Chem. Commun., 2017, 53, 7465–7468 RSC.
- X. Yang, J. Zhu, L. Qiu and D. Li, Adv. Mater., 2011, 23, 2833–2838 CrossRef CAS PubMed.
- Z. Wang, L. Yue, Z.-T. Liu, Z.-H. Liu and Z. Hao, J. Mater. Chem., 2012, 22, 14101–14107 RSC.
- X. Huang, Z. Zeng, Z. Fan, J. Liu and H. Zhang, Adv. Mater., 2012, 24, 5979–6004 CrossRef CAS PubMed.
- H. Li, L. Zou, L. Pan and Z. Sun, Environ. Sci. Technol., 2010, 44, 8692–8697 CrossRef CAS PubMed.
- P. Liu, H. Wang, T. Yan, J. Zhang, L. Shi and D. Zhang, J. Mater. Chem. A, 2016, 4, 5303–5313 CAS.
- H. Wang, T. Yan, P. Liu, G. Chen, L. Shi, J. Zhang, Q. Zhong and D. Zhang, J. Mater. Chem. A, 2016, 4, 4908–4919 CAS.
- P. Liu, T. Yan, J. Zhang, L. Shi and D. Zhang, J. Mater. Chem. A, 2017, 5, 14748–14757 CAS.
- H. Seema, K. Christian Kemp, V. Chandra and K. S. Kim, Nanotechnology, 2012, 23, 355705 CrossRef PubMed.
- J. Liang, Y. Zhao, L. Guo and L. Li, ACS Appl. Mater. Interfaces, 2012, 4, 5742 CAS.
- F. Li, J. Song, H. Yang, S. Gan, Q. Zhang, D. Han, A. Ivaska and L. Niu, Nanotechnology, 2009, 20, 455602 CrossRef PubMed.
- M. S. A. Sher Shah, A. R. Park, K. Zhang, J. H. Park and P. Yoo, ACS Appl. Mater. Interfaces, 2012, 3893–3901 CAS.
- H. Li, L. Pan, Y. Zhang, L. Zou, C. Sun, Y. Zhan and Z. Sun, Chem. Phys. Lett., 2010, 485, 161–166 CrossRef CAS.
- L. Shen, X. Zhang, H. Li, C. Yuan and G. Cao, J. Phys. Chem. Lett., 2011, 2, 3096–3101 CrossRef CAS.
- J. Gao, F. Liu, Y. Liu, N. Ma, Z. Wang and X. Zhang, Chem. Mater., 2010, 22, 2213–2218 CrossRef CAS.
- H. Zhang, H. Song, X. Chen, J. Zhou and H. Zhang, Electrochim. Acta, 2012, 59, 160–167 CrossRef CAS.
- X. Wen, D. Zhang, T. Yan, J. Zhang and L. Shi, J. Mater. Chem. A, 2013, 1, 12334–12344 CAS.
- H. Wang, D. Zhang, T. Yan, X. Wen, J. Zhang, L. Shi and Q. Zhong, J. Mater. Chem. A, 2013, 1, 11778–11789 CAS.
- H. Wang, L. Shi, T. Yan, J. Zhang, Q. Zhong and D. Zhang, J. Mater. Chem. A, 2014, 2, 4739–4750 CAS.
Footnote |
| † Electronic supplementary information (ESI) available. See DOI: 10.1039/c7ra12764b |
| This journal is © The Royal Society of Chemistry 2018 |

