 Open Access Article
Deep insights into the viscosity of small molecular solutions for organic light-emitting diodes
Shu Feng*ab,
Dongxin Ma*a,
Yong Qiua and
Lian Duan ac
ac
aKey Lab of Organic Optoelectronics & Molecular Engineering of Ministry of Education, Department of Chemistry, Tsinghua University, Beijing 100084, P. R. China. E-mail: fengshu@rdfz.cn; madongxin@mail.tsinghua.edu.cn
bThe High School Affiliated to Renmin University of China, Beijing 100037, P. R. China
cCenter for Flexible Electronics Technology, Tsinghua University, Beijing 100084, P. R. China
First published on 23rd January 2018
Abstract
Film quality plays a significant role in the performance of solution-processed organic small molecular light-emitting diodes, while it largely depends on the precursor solution properties like solution viscosity. In order to gain deep insights therein, we dissolve four typical organic small molecules into aromatic and non-aromatic solvents, and then systematically investigate their viscosities. We find that the viscosities of small molecular solutions mainly depend on the solvent viscosity, while they are slightly enhanced with increasing solution concentration; this behavior is quite different from that of polymer solutions. Attractive solute–solvent interactions lead to more obvious enhancements and the effective volume of the flowing unit becomes larger in non-aromatic rather than in aromatic solutions. The temperature dependence of viscosity is also studied and explained by the Arrhenius equation. Raising the temperature decreases the solution viscosity, while the activation energy increases when the solution concentration increases. Moreover, we prepare spin-coated thin films and investigate the effect of various solvents and different solution concentrations on the surface morphology, finally achieving good-quality films cast from chlorobenzene with a root-mean-square of about 0.4 nm, much lower than those of the corresponding vacuum-deposited films. Our results offer deep insights into the viscosity of small molecular solutions toward fabricating high-performance devices.
Introduction
Solution-processed organic light-emitting diodes (OLEDs) have drawn researchers' attention owing to their low cost and large-area manufacturability in applications such as flat-panel displays and solid-state lighting.1–3 Both polymers and small molecules are now used to fabricate OLEDs by solution processes.4,5 For polymers, simple solution processes such as spin-coating or ink-jet printing can be utilized,6–8 and it is well-known that polymer solution properties play an important role in fabricating good-quality film. For example, Xing et al. compared the film properties of solution-processed organic emissive materials cast from three different types of mixed solvents and demonstrated that solvents with high boiling point and viscosity would increase the liquid film thickness and lead to uniform thin films.9 Significant progress has been made in the development of solution-processed small molecular OLEDs since organic small molecules present better reproducibility of synthesis and purification with respect to polymers, and feature comparable performance to their vacuum-deposited counterparts.10–19 However, the previous reports mainly focused on designing novel materials or optimizing the preparation processes to improve device efficiency,20 while few systematic investigations have been devoted to exploring the interrelation between the viscosity properties of organic small molecular solutions and the corresponding solution-processed films. A deep understanding of the fundamental solution properties of organic small molecular solutions remains elusive, although it is crucial for practical processing toward high-performance devices. Here we prepare both precursor solutions and spin-coated films based on various organic small molecules in different solvents at varying concentrations, systematically investigate the solution viscosities and film surface morphologies, and finally give deep insights into the fabrication of high-performance OLEDs by solution-processes.Results and discussion
Initially we selected four typical organic small molecules widely used in OLEDs: 4,4′,4′′-tris(3-methylphenylphenylamino)triphenylamine (m-MTDATA, a hole-injection layer material), 2,2′,2′′-(1,3,5-benzenetriyl)-tris(1-phenyl-1H-benzimidazole) (TPBi, a hole-blocking layer material), N,N′-di(3-methylphenyl)-N,N′-diphenyl-(1,1′-biphenyl)-4,4-diamine (TPD, a hole-transport layer material) and 1,3-bis[(4-tert-butylphenyl)-1,3,4-oxadiazolyl]phenylene (OXD-7, an electron-transport layer material) (Fig. 1), since they would produce a range of solute–solute and solute–solvent interactions. Their solubility in several different solvents is summarized in Table 1. At room temperature, most of the organic small molecules show good solubility in non-aromatic solvents such as chloroform (CHCl3) and tetrahydrofuran (THF) even at high concentrations, and the incorporation of alkyl groups further enhances solubility, consistent with the previous reports.9,21| Compound | Solubility in different solutions | |||
|---|---|---|---|---|
| CB | DCB | CHCl3 | THF | |
| m-MTDATA | >30 mg mL−1 | >30 mg mL−1 | >30 mg mL−1 | >30 mg mL−1 |
| TPBi | >30 mg mL−1 | — | >30 mg mL−1 | <10 mg mL−1 |
| TPD | >30 mg mL−1 | >30 mg mL−1 | >30 mg mL−1 | >30 mg mL−1 |
| OXD-7 | <20 mg mL−1 | <20 mg mL−1 | >30 mg mL−1 | >30 mg mL−1 |
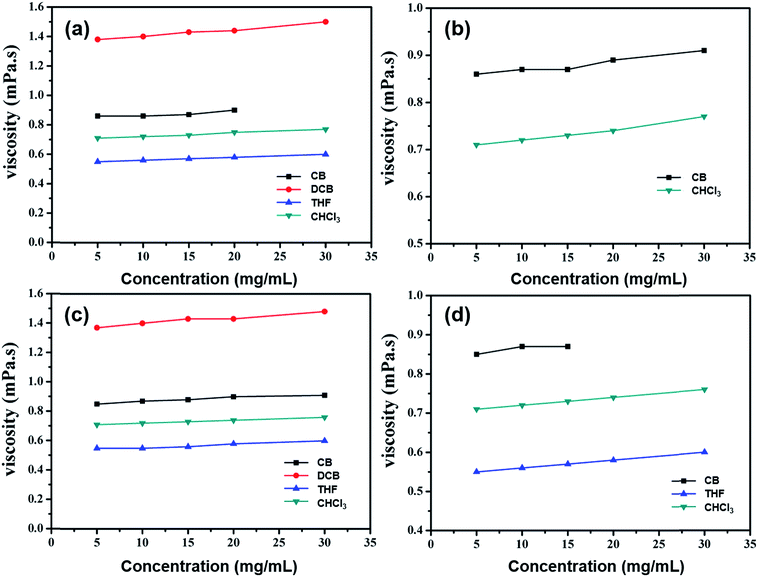
Unlike polymers, the viscosity values of organic small molecular solutions are constant with varying shear rates, indicating that they are typical Newtonian fluids. The variation of viscosity values at different concentrations in chlorobenzene (CB), 1,2-dichlorobenzene (DCB), THF and CHCl3 solutions is depicted in Fig. 2. At room temperature, the viscosity values of these pure solvents are 0.84, 1.37, 0.54 and 0.71 mPa s, respectively. By way of example, TPD, at the concentration of 10 mg mL−1, has solution viscosities in CB, DCB, THF and CHCl3 of 0.87, 1.40, 0.56 and 0.73 mPa s, respectively, which are mainly dependent on the solvent viscosity, while they are enhanced slightly with increasing solution concentrations. When the solution concentration is increased 5 fold, the viscosity is enhanced by only 5–8%, which is quite different from the way in which polymers behave. For polymers, there exists a region corresponding to the concentrations for loose aggregation (CLA) of the polymer chains. At concentrations above the CLA, the viscosity increases rapidly (10 times or even more) when the concentration doubles.6 This is because when the solution concentration increases, polymer chains entangle with each other to form ‘strong aggregates’, while organic small molecules do not, and so display only slightly enhanced viscosity.
As is well-known, solute–solvent interactions depend upon the molecular structure and concentration of solutes, solvent type, and temperature of solutions, and viscosity characterizations can help to infer the microstructure of small molecular or polymer solutions for which aggregate formation is a primary concern. The relative solution viscosity can be expressed as a sum of terms in different powers of concentration (c), as given by:22
| ηr = 1 + Bc + Dc2 | (1) |
The B-coefficient is related to the size and shape of solute molecules, and describes the solute effect on the solvent structure. Negative B values result from the breaking up of the solvent structure, whereas positive ones imply that the solution is more ordered than the pure solvent. The D-coefficient includes the contribution due to the higher terms of the hydrodynamic effects and interactions arising from changes in solute–solute interactions with varying concentration.23
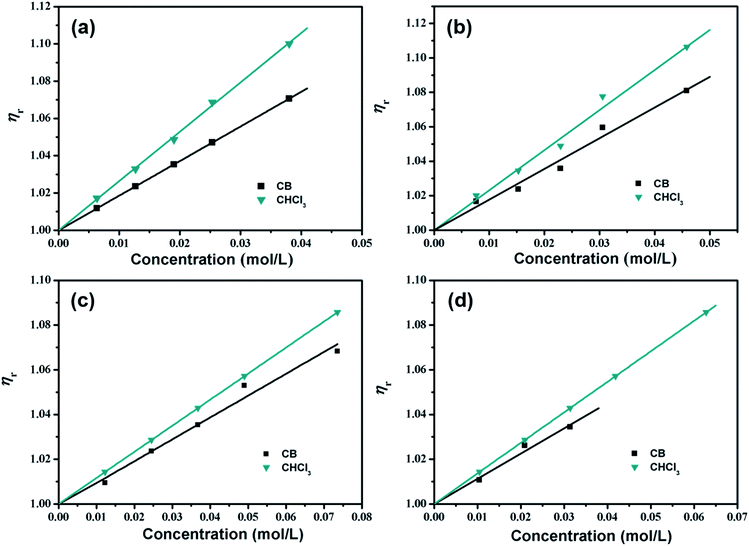
The variation in the relative viscosity (ηr) of four various organic small molecules in CB and CHCl3 solutions at varying concentrations is shown in Fig. 3, and indicates that ηr as a function of the solution concentration in both aromatic CB and non-aromatic CHCl3 solutions is linear. Thus it is sufficient to retain only the B-coefficient in eqn (1) for representation of these data, as given by:
| ηr = 1 + Bc | (2) |
B-coefficients and equation correlation data for the four various organic small molecules in both CB and CHCl3 solutions are summarized in Table 2.
| Compound | Solvent | Fitting equation | Correlation | B-Coefficient |
|---|---|---|---|---|
| m-MTDATA | CB | ηr = 1 + 1.85c | 0.98 | 1.85 |
| CHCl3 | ηr = 1 + 2.64c | 1 | 2.64 | |
| TPBi | CB | ηr = 1 + 1.78c | 0.97 | 1.78 |
| CHCl3 | ηr = 1 + 2.34c | 0.98 | 2.34 | |
| TPD | CB | ηr = 1 + 0.98c | 0.97 | 0.98 |
| CHCl3 | ηr = 1 + 1.17c | 1 | 1.17 | |
| OXD-7 | CB | ηr = 1 + 1.13c | 0.95 | 1.13 |
| CHCl3 | ηr = 1 + 1.37c | 1 | 1.37 |
As depicted, for the above organic small molecules, positive slopes are observed, indicating that the fluids are more ordered than the pure solvents. In CB solutions, the B-coefficient values of m-MTDATA and TPBi solutions are 1.85 and 1.78, respectively, which are much higher than those of TPD and OXD-7 solutions (0.98 and 1.13, respectively), indicating that the effect of star-shaped organic small molecular structures on CB is greater than that of twist-shaped ones. In CHCl3 solutions, the B-coefficient values of m-MTDATA and TPBi solutions are 2.64 and 2.34, respectively, which are also higher than those of the TPD and OXD-7 solutions (1.17 and 1.37, respectively). Meanwhile, for the same solute, the B-coefficients in CHCl3 solutions are all higher than those in CB solutions, suggesting enhanced attractive solute–solvent interactions in the former.
The B-coefficient is related to the effective volume of the flowing unit, Ve, by an extension to the Einstein equation:24–27
| B = 2.5Ve | (3) |
 | (4) |
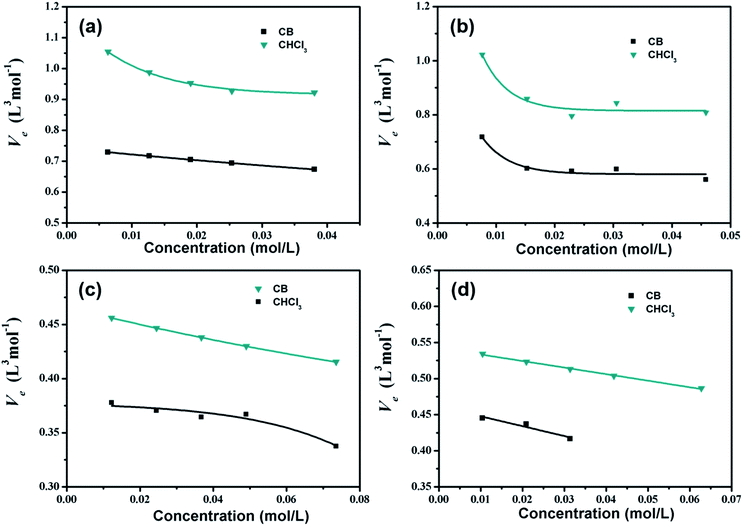
Fig. 4 depicts Ve values as a function of solution concentrations at room temperature in CB and CHCl3 solutions, respectively. For all of the organic small molecules, Ve values in CHCl3 solutions are higher than those in CB solutions, indicating that there are more CHCl3 solvent molecules attached to the solutes in one flowing unit. Hence, we suggest that interactions between the CHCl3 solvent and organic small molecules are much stronger than those between the CB solvent and the solutes, consistent with the B-coefficient results.
Although the organic small molecular structures are different, their molecular weights increase only from 400 to 800 with concentration, while the solution viscosity values stay almost equal, as shown in Fig. 5. This phenomenon is rather different from that seen with polymers, whose molecular weights increase greatly and whose solution viscosities enhance rapidly, 10 times or even more, as the concentration doubles.
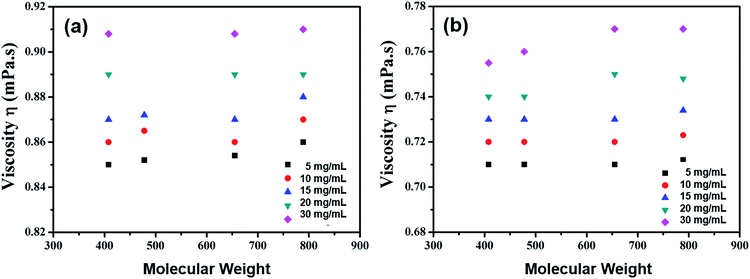 | ||
| Fig. 5 Viscosity as a function of molecular weight at varying solute concentrations in (a) CB and (b) CHCl3 solutions. | ||
The simplest equation that can be used to describe the temperature dependence of viscosity is the Arrhenius equation:
 | (5) |
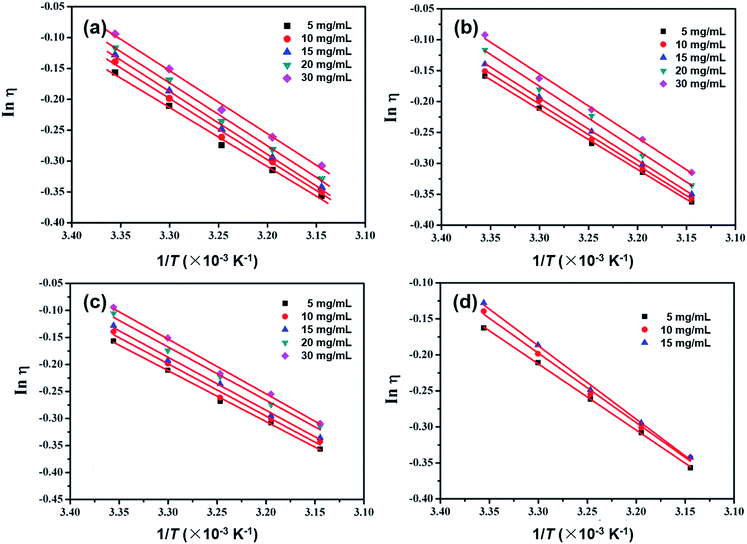 | ||
| Fig. 6 The Arrhenius data plotted as a function of 1/T for (a) m-MTDATA; (b) TPBi; (c) TPD; and (d) OXD-7 in CB solutions at varying concentrations. | ||
The activation energy E values and correlation R values are summarized in Table 3. For example for the TPD solutions in CBD, the E values are 7.84, 8.03, 8.15, 8.18 and 8.41 kJ mol−1 at 5, 10, 15, 20 and 30 mg mL−1, respectively, obviously increasing with higher solution concentrations; the other small molecules behave similarly. We suggest that when the solution concentration increases, both the solute–solute and solute–solvent interactions become stronger, leading to higher E values. In accordance with the B-coefficient and Ve results, m-MTDATA and TPBi show higher E values than TPD and OXD-7 solutions at the same concentrations, also demonstrating stronger solute–solvent interactions.
| Concentration [mg mL−1] | m-MTDATA | TPBi | TPD | OXD-7 | ||||
|---|---|---|---|---|---|---|---|---|
| E [kJ mol−1] | R | E [kJ mol−1] | R | E [kJ mol−1] | R | E [kJ mol−1] | R | |
| 5 | 7.94 | 0.992 | 8.04 | 0.981 | 7.84 | 0.997 | 7.64 | 0.999 |
| 10 | 8.24 | 0.994 | 8.20 | 0.997 | 8.03 | 0.990 | 8.03 | 0.996 |
| 15 | 8.45 | 0.997 | 8.34 | 0.999 | 8.15 | 0.995 | 8.47 | 0.997 |
| 20 | 8.47 | 0.996 | 8.57 | 0.996 | 8.18 | 0.992 | ||
| 30 | 8.49 | 0.995 | 8.59 | 0.995 | 8.41 | 0.994 | ||
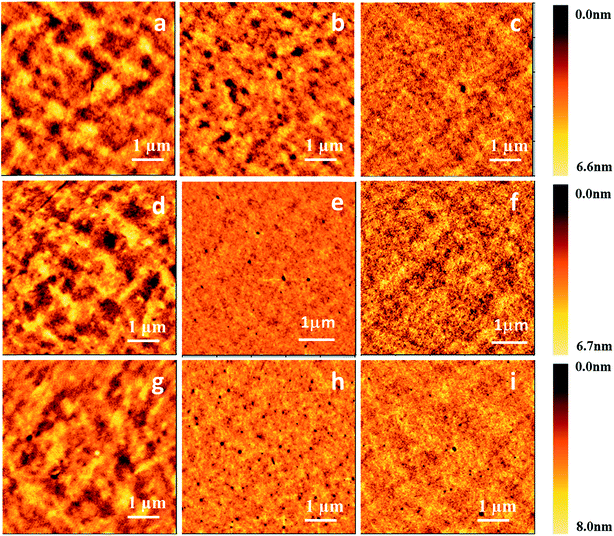
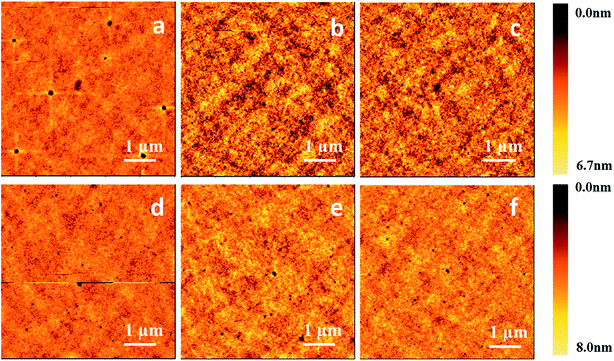
Since a good-quality film plays a critical role in fabricating high-performance OLEDs, next we prepared thin films on ITO substrates by both vacuum evaporation deposition and a spin-coating process to investigate the effect of organic small molecular solutions on surface morphology. For the spin-coating process, three compounds, m-TTDATA, TPBi and TPD, were dissolved into CB and CHCl3 solutions at different concentrations, and then spin-coated onto the substrates. The obtained films were then baked at 50 °C for 25 min on a hot plate in a nitrogen atmosphere. For vacuum evaporation deposition, the control films were prepared at a deposition rate of 2–3 Å s−1 at 10−5 torr. Fig. 7 displays the AFM images of both vacuum-deposited and spin-coated thin films, with the corresponding root-mean-square (RMS) roughness values shown in Table 4. RMS roughness values of the spin-coated TPD films cast from CB and CHCl3 solutions are 0.46 and 0.91 nm, respectively, much lower than that of the vacuum-deposited film (1.01 nm). Similar phenomena were found for the other molecules. Besides, the spin-coated films processed from CB solutions are smoother than those from CHCl3 solutions. RMS roughness values of the spin-coated m-MTDATA films cast from CB and CHCl3 solutions are 0.46 and 0.89 nm, respectively. RMS roughness values of the spin-coated TPBi films cast from CB and CHCl3 solutions are 0.62 and 1.11 nm, respectively.
| Compound | Film | RMS [nm] | Film thickness [nm] |
|---|---|---|---|
| TPD | Vacuum-deposited film | 1.01 | 100 ± 3 |
| Spin-coated film from CB | 0.46 | 100 ± 10 | |
| Spin-coated film from CHCl3 | 0.91 | 100 ± 10 | |
| m-MTDATA | Vacuum-deposited film | 1.07 | 100 ± 3 |
| Spin-coated film from CB | 0.46 | 100 ± 12 | |
| Spin-coated film from CHCl3 | 0.89 | 100 ± 10 | |
| TPBi | Vacuum-deposited film | 1.15 | 100 ± 3 |
| Spin-coated film from CB | 0.62 | 100 ± 15 | |
| Spin-coated film from CHCl3 | 1.11 | 100 ± 10 |
Then we obtained AFM images of the spin-coated thin films processed from CB solutions of m-MTDATA and TPBi at different concentrations, as shown in Fig. 8. When the solution concentration increases from 5 to 20 mg mL−1, the viscosity of the m-MTDATA solution increases from 0.86 to 0.90 mPa s and the RMS roughness values decrease from 0.65 to 0.44 nm. Similarly, RMS roughness values of the spin-coated TPBi films decrease from 0.71 to 0.60 nm as the solution viscosity increases from 0.86 to 0.89 mPa s, see Table 5. Thus we found that increasing solution concentration and solution viscosity always resulted in smoother film.
| Compound | Concentration [mg mL−1] | Solution viscosity [mPa s] | Film RMS [nm] | Film thickness [nm] |
|---|---|---|---|---|
| m-MTDATA | 5 | 0.86 | 0.65 | 13 ± 2 |
| 10 | 0.87 | 0.46 | 25 ± 3 | |
| 20 | 0.90 | 0.44 | 40 ± 3 | |
| TPBi | 5 | 0.86 | 0.71 | 16 ± 2 |
| 10 | 0.88 | 0.62 | 28 ± 4 | |
| 20 | 0.89 | 0.60 | 45 ± 3 |
Experimental
Materials
Chemicals such as m-MTDATA, TPBi, TPD and OXD-7 were purchased from Nichem Fine Technology Co. Ltd. Solvents such as CB, DCB, THF and CHCl3 were purchased from Beijing Chemical Reagent Co. Ltd., P. R. China, and purified by reflux distillation in nitrogen for 12 h.Solution preparation and viscosity measurement
Sample solutions were prepared by dissolving appropriate amounts of the above organic small molecules into the solvents CB, DCB, THF and CHCl3, and treating with ultrasound for 20 s. The solution concentrations were 5, 10, 15, 20, 30 mg mL−1. During viscosity measurements, the sample solutions were well-sealed to avoid solvent evaporation. Viscosity values were acquired using a cone/plate viscometer (Brookfield DV-II-+Pro) at a fixed share speed of 100 rpm. The viscosity accuracy is ±1.0% of the full scale range and the viscosity repeatability is ±0.2%. In experiments involving thermal treatment, sample solutions were heated or cooled using a thermal control system. A bath with 60 L capacity was used such that temperatures were maintained almost constant (tiny variations of 0.01 K) by circulating the thermostated liquid from a U-10 ultrathermostat through an electroplated copper coil suspended inside. The temperature fluctuations were monitored by a Beckman thermometer. Each measurement started about 15 min after the control system indicated thermal equilibrium. Viscosity data were collected at every 5 °C in the temperature range from 25 to 45 °C.Film fabrication and characterization
Thin films were prepared on clean glass substrates by both vacuum evaporation deposition and a spin-coating process. Vacuum evaporation deposition was carried out at a deposition rate of 2–3 Å s−1 at 10−5 torr. The spin-coating process was performed at 1000 rpm, with CB and CHCl3 solutions of organic small molecules at different concentrations, and then the samples were baked at 50 °C for 25 min in a nitrogen atmosphere to evaporate the residual solvents and form thin films. Surface morphology was finally examined by atomic force microscope (AFM, Seiko instrument SPA 400) operated in tapping mode.Conclusions
In summary, we prepared precursor solutions with four various organic small molecules dissolved in different solvents at varying concentrations, and then investigated both the solution properties and the surface morphologies of the corresponding spin-coated films. Experiments indicated that (i) the viscosity enhanced slightly along with increasing concentration, (ii) both the attractive solute–solvent interactions and the effective volume of the flowing unit became larger in non-aromatic solutions, and (iii) raising the temperature decreased the solution viscosity, while the activation energy rose with increasing concentration. Films cast from higher-concentration solutions showed better surface morphology, and the chlorobenzene solvent achieved the best-quality thin films of organic small molecules, which were even superior to those obtained from vacuum evaporation deposition. Our results provide deep insights into the nature of organic small molecular solutions and films, toward fabricating solution-processed OLEDs with high performance.Conflicts of interest
The authors declare no conflicts of interest.Acknowledgements
This research was supported by the National Natural Science Foundation of China (Grant No. U1601651), the National Basic Research Program of China (Grant No. 2015CB655002) and the National Social Science Foundation of China (Grant No. ADA160004).Notes and references
- C. Zhong, C. Duan, F. Huang, H. Wu and Y. Cao, Chem. Mater., 2011, 23, 326 CrossRef CAS.
- L. Duan, L. Hou, T.-W. Lee, J. Qiao, D. Zhang, G. Dong, L. Wang and Y. Qiu, J. Mater. Chem., 2010, 20, 6392 RSC.
- S.-C. Lo and P. L. Burn, Chem. Rev., 2007, 107, 1097 CrossRef CAS PubMed.
- A. C. Grimsdale, K. L. Chan, R. E. Martin, P. G. Jokisz and A. B. Holmes, Chem. Rev., 2009, 109, 897 CrossRef CAS PubMed.
- Y. Shirota, J. Mater. Chem., 2000, 10, 1 RSC.
- Y. Shi, J. Liu and Y. Yang, J. Appl. Phys., 2000, 87, 4254 CrossRef CAS.
- J. H. Burroughes, D. D. C. Bradley, A. R. Brown, R. N. Marks, K. Mackay, R. H. Friend, P. L. Burns and A. B. Holmes, Nature, 1990, 347, 539 CrossRef CAS.
- S. Xia, K.-O. Cheon, J. J. Brooks, M. Rothman, T. Ngo, P. Hett, R. C. Kwong, M. Inbasekaran, J. J. Brown, T. Sonoyama, M. Ito, S. Seki and S. Miyashita, J. Soc. Inf. Disp., 2009, 17, 167 CrossRef CAS.
- Z. Ding, R. Xing, Q. Fu, D. Ma and Y. Han, Org. Electron., 2011, 12, 703 CrossRef CAS.
- S. Feng, L. Duan, L. Hou, J. Qiao, D. Zhang, G. Dong, L. Wang and Y. Qiu, J. Phys. Chem. C, 2011, 115, 14278 CAS.
- L. Hou, L. Duan, J. Qiao, D. Zhang, G. Dong, L. Wang and Y. Qiu, Org. Electron., 2010, 11, 1344 CrossRef CAS.
- T.-W. Lee, T. Noh, H.-W. Shin, O. Kwon, J.-J. Park, B.-K. Choi, M.-S. Kim, D. W. Shin and Y.-R. Kim, Adv. Funct. Mater., 2009, 19, 1625 CrossRef CAS.
- K.-H. Kim, S.-Y. Huh, S. Seo and H. H. Lee, Appl. Phys. Lett., 2008, 92, 093307 CrossRef.
- X. Xing, L. Zhong, L. Zhang, Z. Chen, B. Qu, E. Chen, L. Xiao and Q. Gong, J. Phys. Chem. C, 2013, 117, 25405 CAS.
- Z. Liu, J. Xiao, Q. Fu, H. Feng, X. Zhang, T. Ren, S. Wang, D. Ma, X. Wang and H. Chen, ACS Appl. Mater. Interfaces, 2013, 5, 11136 CAS.
- N. Aizawa, Y.-J. Pu, M. Watanabe, T. Chiba, K. Ideta, N. Toyota, M. Igarashi, Y. Suzuri, H. Sasabe and J. Kido, Nat. Commun., 2014, 5, 5756 CrossRef PubMed.
- S. Höfle, C. Bernhard, M. Bruns, C. Kübel, T. Scherer, U. Lemmer and A. Colsmann, ACS Appl. Mater. Interfaces, 2015, 7, 8132 Search PubMed.
- L. Derue, S. Olivier, D. Tondelier, T. Maindron, B. Geffroy and E. Ishow, ACS Appl. Mater. Interfaces, 2016, 8, 16207 CAS.
- X. Yang, Z. Feng, J. Zhao, J.-S. Dang, B. Liu, K. Zhang and G. Zhou, ACS Appl. Mater. Interfaces, 2016, 8, 33874 CAS.
- Y. Shirota, J. Mater. Chem., 2005, 15, 75 RSC.
- Z. Xu, H. Tsai, H.-L. Wang and M. Cotlet, J. Phys. Chem. B, 2010, 114, 11746 CrossRef CAS PubMed.
- G. Jones and M. Dole, J. Am. Chem. Soc., 1929, 51, 2950 CrossRef CAS.
- J. E. Desnoyers and G. Perron, J. Solution Chem., 1972, 1, 199 CrossRef CAS.
- K. J. Patil, R. B. Pawar and P. D. Patil, J. Mol. Liq., 2000, 84, 223 CrossRef CAS.
- T. Tominaga, J. Phys. Chem., 1975, 79, 1664 CrossRef CAS.
- B. R. Breslau and I. F. Miller, J. Phys. Chem., 1970, 74, 1056 CrossRef CAS.
- D. G. Thomas, J. Colloid Sci., 1965, 20, 267 CrossRef CAS.
| This journal is © The Royal Society of Chemistry 2018 |


