 Open Access Article
Creative Commons Attribution 3.0 Unported Licence
Improved conductivity and electrochemical properties of LiNi0.5Co0.2Mn0.3O2 materials via yttrium doping
Xinxin Zhaoabc,
Guangchuan Liang *abc,
Hao Liuabc and
Yuanyuan Liuabc
aInstitute of Power Source and Ecomaterials Science, Hebei University of Technology, Tianjin 300130, China. E-mail: liangguangchuan@hebut.edu.cn
bKey Laboratory of Special Functional Materials for Ecological Environment and Information (Hebei University of Technology), Ministry of Education, Tianjin 300130, China
cKey Laboratory for New Type of Functional Materials in Hebei Province, Hebei University of Technology, Tianjin 300130, China
First published on 23rd January 2018
Abstract
A series of LiNi0.5Co0.2−xMn0.3YxO2 (x = 0, 0.01, 0.02, 0.03) materials was synthesized using a co-precipitation method, and the impact of yttrium doping on the crystalline structure, particle morphology, particle size, electronic conductivity and electrochemical performances was investigated. The PXRD refinement, SEM, EDS and XPS results indicate that yttrium ions have been successfully incorporated into the matrix structure of the materials, and that the crystalline structure and particle morphology of the LiNi0.5Co0.2Mn0.3O2 cathode material is not changed after yttrium doping. Electrochemical test results show that the rate capability, cycling stability and low-temperature performance of the yttrium doped materials are remarkably improved. Especially, the LiNi0.5Co0.18Mn0.3Y0.02O2 sample exhibits the best electrochemical performance, delivering a high discharge capacity of 125.6 mA h g−1 at a rate of 10C, with a capacity retention of 83.0% after 150 cycles at a rate of 1C in the voltage range of 3.0–4.5 V. The material also shows a discharge capacity of 148.9 mA h g−1 at −20 °C at a rate of 0.2C, which is 81.0% of the same discharge rate at 25 °C, with a capacity retention of 81.5% after 50 cycles. CV and EIS measurements show that LiNi0.5Co0.18Mn0.3Y0.02O2 exhibits lower polarization, lower charge transfer resistance and a larger lithium ion diffusion coefficient than LiNi0.5Co0.2Mn0.3O2. Additionally, the electronic conductivity of the LiNi0.5Co0.18Mn0.3Y0.02O2 sample is 2.69 × 10⁻² S cm−1, which is fourteen times higher than that of LiNi0.5Co0.2Mn0.3O2. Therefore, both the electronic conductivity and ionic conductivity of LiNi0.5Co0.2Mn0.3O2 are improved by yttrium doping, which are beneficial to enhancing electrochemical performance.
Introduction
Layer-structured ternary LiNixCoyMn1−x−yO2 cathode materials have been intensively researched owing to their characteristics of having relatively lower toxicity, higher capacity and energy density than LiCoO2 and LiFePO4 cathodes.1–5 The material LiNi0.5Co0.2Mn0.3O2 is one of the most widely used cathodes in commercialized lithium ion batteries, due to its excellent general properties compared with those of other layered oxide materials.6–8 Unfortunately, the fast capacity degradation and poor rate capability at a high current density and high voltage, and the poor low-temperature performance of LiNi0.5Co0.2Mn0.3O2, largely limits its further applications.9,10 This poor electrochemical performance might be due to the low electronic and lithium ionic conductivity of the electrode material, and the instability of the structure during the cycling process.A tremendous amount of research has been dedicated to resolving the aforementioned problems. Surface coating and ion doping are considered to be effective strategies for modifying the electrochemical performance of LiNi0.5Co0.2Mn0.3O2 cathode materials. On the one hand, coating with composites (such as metal oxide, lithium metal oxide and graphene) to form a protect layer on the surface of cathode materials can prevent direct contact between the electrodes and the electrolyte to suppress side reactions and inhibit phase transformation, thus resulting in an improvement in the electrochemical properties.11–15 On the other hand, coating with graphene or lithium metal oxide can also improve the electronic conductivity and lithium ion conductivity, leading to a better electrochemical performance.16–22 Doping with Na+,23 K+,24 Zr2+,25 Ce2+,26 Al3+ (ref. 27 and 28) and V5+,29 have been reported to improve the cycling performance of the LiNi0.5Co0.2Mn0.3O2 cathode material by enhancing the structure stability and enhancing the rate capability by reducing the charge transfer resistance. In addition, as one of a number of heavy rare earth metals, yttrium has been verified to improve the electrochemical performance of different cathode materials.30–35 Li1.2Mn0.6−xNi0.2YxO2 materials have been synthesized using an oxalate co-precipitation method, which led to the resultant materials exhibiting a high capacity retention and a superior rate capability, due to the “super-large” Y3+ ion that can expand the Li+ ion diffusion channels in the layered structures and stabilize the structures of the materials.30 LiNi0.33−xCo0.33Mn0.33YxO2 samples have been successfully synthesized using a sol–gel method and the results identified that Y-doping can improve the high rate capability and capacity retention of the samples.28 Kang et al.34 have synthesized Li[Li0.20Mn0.534Ni0.133Co0.133−xYx]O2 using a coprecipitation method and found that the rate capability and cycling performances of Li[Li0.20Mn0.534Ni0.133Co0.133]O2 were improved after yttrium doping. However, the influence of the yttrium doping on the electronic conductivity of the electrode materials and on the low-temperature performance of lithium ion batteries has still not been researched. In this study, yttrium doped LiNi0.5Co0.2Mn0.3O2 materials are synthesized using a co-precipitation method, and the effects of yttrium doping on the crystalline structure, particle morphology, electronic and ionic conductivity, and the electrochemical performance (including rate capability, cycle stability and low-temperature properties) of LiNi0.5Co0.2Mn0.3O2 cathode materials are intensively investigated.
Experimental
Preparation of the samples
The precursors were prepared using a co-precipitation method. A stoichiometric ratio (0.5![[thin space (1/6-em)]](https://www.rsc.org/images/entities/char_2009.gif) :
:![[thin space (1/6-em)]](https://www.rsc.org/images/entities/char_2009.gif) 0.2 − x
0.2 − x![[thin space (1/6-em)]](https://www.rsc.org/images/entities/char_2009.gif) :
:![[thin space (1/6-em)]](https://www.rsc.org/images/entities/char_2009.gif) 0.3
0.3![[thin space (1/6-em)]](https://www.rsc.org/images/entities/char_2009.gif) :
:![[thin space (1/6-em)]](https://www.rsc.org/images/entities/char_2009.gif) x) (x = 0, 0.01, 0.02, 0.03) of NiSO4·6H2O, CoSO4·7H2O, MnSO4·H2O, and Y(NO3)3·6H2O was dissolved in an amount of distilled water to form a solution with a concentration of 2 mol L−1 (M). The solution was pumped into a reactor under a nitrogen atmosphere with a continuous stirring speed of 500 rpm. Subsequently, 0.5 M NH3·H2O and 4 M NaOH solutions were added into the above solution simultaneously. The reaction that followed was then maintained at 60 °C with a pH value of 11 for 12 h. After that, the suspension was washed, filtered and dried at 120 °C for 12 h under vacuum.
x) (x = 0, 0.01, 0.02, 0.03) of NiSO4·6H2O, CoSO4·7H2O, MnSO4·H2O, and Y(NO3)3·6H2O was dissolved in an amount of distilled water to form a solution with a concentration of 2 mol L−1 (M). The solution was pumped into a reactor under a nitrogen atmosphere with a continuous stirring speed of 500 rpm. Subsequently, 0.5 M NH3·H2O and 4 M NaOH solutions were added into the above solution simultaneously. The reaction that followed was then maintained at 60 °C with a pH value of 11 for 12 h. After that, the suspension was washed, filtered and dried at 120 °C for 12 h under vacuum.
LiNi0.5Co0.2−xMn0.3YxO2 cathode materials were obtained by a solid-state reaction. An appropriate ratio of Li2CO3 and precursor were well mixed in a ball milling machine with a rotation rate of 480 rpm for 1 h, and then the different mixtures were calcined at 500 °C for 4 h and 850 °C for 12 h under an air atmosphere. To make up for the lithium loss during the high temperature calcination, a 3 wt% extra amount of lithium source was added into all the materials. The final obtained samples were labeled as Y-0 (x = 0), Y-0.01 (x = 0.01), Y-0.02 (x = 0.02), and Y-0.03 (x = 0.03).
Characterization and electrochemical measurements
The crystalline phase and structure of the as-synthesized samples were investigated using X-ray diffraction (SMART APEX, Germany) with a CuKα radiation source (λ = 0.15406 nm). The microstructure and morphology of the samples were analyzed by scanning electron microscope (JSM6700F). X-ray photoelectron spectroscopic (XPS, ULVAC-PHI, PHI quanteda ii) measurements were used to determine the oxidation states of Ni, Co, Mn, and Y in the layered structure with AlKα radiation, and the binding energies of the elements were collected using C 1s as the reference. The electronic conductivity was measured using the two-point probe method, and calculated according to the following equation:| G = 4(L1 − L)/πRd2 | (1) |
The electrochemical performances of the LiNi0.5Co0.2−xMn0.3YxO2 (x = 0, 0.01, 0.02, 0.03) samples were measured using coin-type (CR2430) cells. The positive electrodes were prepared by mixing 80 wt% as-prepared material, 15 wt% acetylene black and 5 wt% polytetrafluoroethylene (PTFE). The mixture was pressed into a film with a thickness of about 0.13 mm. Then, the film was dried at 80 °C for 1 h under vacuum and cut into circular slices with a diameter of 12 mm. The mass loading of active material in the working electrode was about 13.5 mg. The CR2430 cells were assembled in an Ar-filled glove box utilizing lithium foil as the anode, porous polyethylene film (Celgard 2400) as the separator, and 1 M lithium hexafluorophosphate (LiPF6) dissolved in a mixture of the solvents dimethyl carbonate (DMC) and ethylene carbonate (EC) (1![[thin space (1/6-em)]](https://www.rsc.org/images/entities/char_2009.gif) :
:![[thin space (1/6-em)]](https://www.rsc.org/images/entities/char_2009.gif) 1 v/v) as the electrolyte. The initial charge/discharge capacity, rate capability, and cycling performance were tested using a Land CT-2001A battery tester in the voltage range of 3–4.5 V. The low temperature performance of the samples was measured using a high-low temperature box (YSGDW-150, Shanghai, China). After the first two galvanostatic charge/discharge cycles at a rate of 0.2C at 25 °C, the cell was fully charged at 0.2C rate, then the battery was placed in the high-low temperature box for 10 h at −20 °C, subsequently discharged at 0.2C rate. Repeated the previous steps to measure the cycling performance of samples at −20 °C.
1 v/v) as the electrolyte. The initial charge/discharge capacity, rate capability, and cycling performance were tested using a Land CT-2001A battery tester in the voltage range of 3–4.5 V. The low temperature performance of the samples was measured using a high-low temperature box (YSGDW-150, Shanghai, China). After the first two galvanostatic charge/discharge cycles at a rate of 0.2C at 25 °C, the cell was fully charged at 0.2C rate, then the battery was placed in the high-low temperature box for 10 h at −20 °C, subsequently discharged at 0.2C rate. Repeated the previous steps to measure the cycling performance of samples at −20 °C.
Electrochemical impedance spectroscopy (EIS) and cyclic voltammetry (CV) measurements were conducted using an electrochemical workstation (CHI660, Shanghai, China). EIS tests were executed by applying an amplitude of 5 mV over a frequency range from 10 mHz to 100 kHz at a fully discharged state. The CV curves were recorded at a scanning rate of 0.1 mV s−1 between 2.5–4.5 V at a fully charged state.
Results and discussion
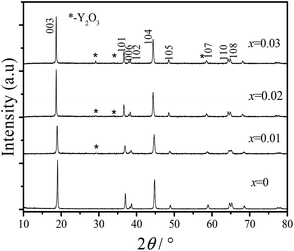
The PXRD patterns of all of the prepared samples are presented in Fig. 1. All of the diffraction peaks of the materials are indexed to the α-NaFeO2 structure with the R![[3 with combining macron]](https://www.rsc.org/images/entities/char_0033_0304.gif) m space group.36 Obvious splitting of the (006)/(102) and the (108)/(110) peaks indicated the formation of a layered structure. For yttrium doped materials, the main peaks were coincident with those of the undoped sample, whereas some low intensity residual peaks (which are pointed out by asterisks) occur with an increase in the Y3+ amount, which might be attributed to the formation of Y2O3.37
m space group.36 Obvious splitting of the (006)/(102) and the (108)/(110) peaks indicated the formation of a layered structure. For yttrium doped materials, the main peaks were coincident with those of the undoped sample, whereas some low intensity residual peaks (which are pointed out by asterisks) occur with an increase in the Y3+ amount, which might be attributed to the formation of Y2O3.37
The lattice parameters of the as-prepared samples are given in Table 1. If the lattice parameters are changed after doping, it indicates that the foreign ion should be incorporated into the crystal structure,38 so the yttrium ions might be successfully incorporated into the host structure, as shown in Table 1. As is well known, the lattice constant a signifies the metal–metal interlayer space, while c represents the metal–oxygen interlayer distance. It can be obviously seen that the lattice parameters a and c became larger after doping, indicating an expanded pathway for Li+ insertion and extraction in the doped materials, which might be attributed to the large size of the Y3+ ions (rY3+ = 0.090 nm) being substituted in place of the small Co3+ ions (rCo3+ = 0.055 nm). Generally, the ratio of the lattice constant c/a is employed as an indicator of the layered structure of materials, with a higher c/a value preferred for a well-ordered hexagonal α-NaFeO2 structure. The results inferred that the yttrium doped materials have a better layered structure, as presented in Table 1. Also, the ratio of I(003)/I(104) indicates the degree of cation mixing of the layer-structured materials, and when the value is higher than 1.2, the material has lower cation mixing. The value of I(003)/I(104) increased after Y3+ doping, representing that the degree of cation mixing is reduced by yttrium.
| Samples | a (Å) | c (Å) | c/a | I003/I104 |
|---|---|---|---|---|
| Y-0 | 2.8639 | 14.2155 | 4.9636 | 1.4925 |
| Y-0.01 | 2.8665 | 14.2285 | 4.9637 | 1.4968 |
| Y-0.02 | 2.8700 | 14.2384 | 4.9650 | 1.6181 |
| Y-0.03 | 2.8702 | 14.2448 | 4.9630 | 1.6066 |
In order to further confirm the effects of yttrium doping on the lattice parameters of the LiNi0.5Co0.2Mn0.3O2 materials, the PXRD patterns of the samples were analyzed by Rietveld refinement via the RIETAN-2000 software, as shown in Fig. 2, Tables 2 and 3. It is presumed that the lithium ions, transition metal ions, and oxygen ions are located at the 3a (0, 0, 0) sites, 3b (0, 0, 0.5) sites and 6c (0, 0, 0.2411) sites, respectively. Depending on the value of Rwp and S (Rwp < 10, S < 1.5), the results of the refinement are reliable. The lattice parameters obtained from the Rietveld refinement were similar to the values obtained from the experimental, and it can be deduced that the Y3+ ions have been successfully incorporated into the bulk structure. It turns out that the cation mixing degree was reduced after yttrium doping and the Y-0.02 sample showed the minimum value (0.0259), which resulted in an improved electrochemical performance. Moreover, the thickness of the inter-slab space (lithium slab) I(LiO2) and the thickness of the slab space (transition metal slab) S(MO2)39 were obtained from the Rietveld analysis, and the results are shown in Table 2. Obviously, the lithium slab thickness increased after yttrium doping, which is beneficial for lithium ion transportation. On the contrary, the transition metal slab thickness decreased after yttrium doping, which is favorable for structural stability. This can be attributed to the larger radius of the Y3+ ions and the stronger bonding energy of Y–O (ΔHf298 (Y–O) = 1816.65 kJ mol−1) than that of Co–O (ΔHf298 (Co–O) = 368 kJ mol−1).40 To investigate the occupancy of the yttrium ions, the atom occupancies obtained from the Rietveld refinement for the Y-0 and Y-0.02 samples are shown in Table 3. It is observed that the yttrium element of the Y-0.02 sample occupied the 3b site with a ratio of 2.15%, while the ratio of cobalt reduced to 17.85%, which means that Y3+ ions occupied the Co3+ ion sites.
 | ||
| Fig. 2 Rietveld refinement of the LiNi0.5Co0.2−xMn0.3YxO2 materials: (a) Y-0; (b) Y-0.01; (c) Y-0.02; (d) Y-0.03. | ||
| Sample | a (Å) | c (Å) | Li/Ni disorder | I(LiO2) (Å) | S(MO2) (Å) | Rwp | S |
|---|---|---|---|---|---|---|---|
| Y-0 | 2.8640 | 14.2165 | 0.0525 | 2.6196 | 2.1192 | 9.87 | 1.4255 |
| Y-0.01 | 2.8665 | 14.2280 | 0.0308 | 2.6250 | 2.1177 | 8.59 | 1.6733 |
| Y-0.02 | 2.8693 | 14.2382 | 0.0259 | 2.6293 | 2.1167 | 7.36 | 1.2792 |
| Y-0.03 | 2.8700 | 14.2437 | 0.0336 | 2.6303 | 2.1176 | 8.12 | 1.2471 |
| Atom | Site | x | y | z | Occupancy | |
|---|---|---|---|---|---|---|
| Y-0 | Y-0.02 | |||||
| Li | 3a | 0 | 0 | 0 | 0.9475 | 0.9741 |
| Ni | 3a | 0 | 0 | 0 | 0.0525 | 0.0259 |
| Ni | 3b | 0 | 0 | 0.5 | 0.4475 | 0.4741 |
| Co | 3b | 0 | 0 | 0.5 | 0.2000 | 0.1785 |
| Mn | 3b | 0 | 0 | 0.5 | 0.3000 | 0.3000 |
| Y | 3b | 0 | 0 | 0.5 | 0 | 0.0215 |
| O | 6c | 0 | 0 | 0.2411 | 2.0000 | 2.0000 |
The microstructure and morphology of the LiNi0.5Co0.2−xMn0.3YxO2 samples were observed by SEM. The SEM images of all of the materials at different magnifications are displayed in Fig. 3. It can be observed from the figure that all of the samples have a similar spherical morphology on the micrometre scale, and that the morphology of the LiNi0.5Co0.2Mn0.3O2 material does not change after yttrium doping. However, the surface of the material became smoother and more compact after yttrium doping, which might be due to the stronger bonding energy of Y–O. Fig. 4 shows the local areas of the materials and the corresponding EDS images. From the EDS results, it is clearly seen that the Y content in Y-0, Y-0.01, Y-0.02 and Y-0.03 is 0.00%, 1.06%, 2.26% and 3.05%, respectively, which is similar to the experimental values.
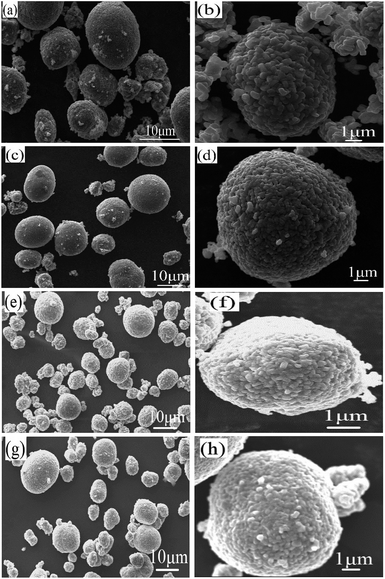 | ||
| Fig. 3 SEM images of all of the samples: (a, b) Y-0, (c, d) Y-0.01, (e, f) Y-0.02 and (g, h) Y-0.03. | ||
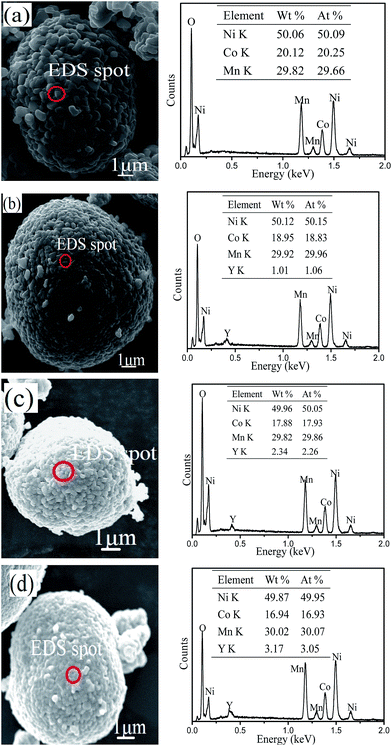 | ||
| Fig. 4 SEM images of the materials (a) Y-0, (b) Y-0.01, (c) Y-0.02, and (d) Y-0.03 and the corresponding EDS images. | ||
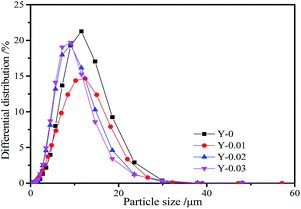
To study the effect of yttrium doping on the particle size of the LiNi0.5Co0.2Mn0.3O2 materials, the particle size distribution curves of all of the samples are displayed in Fig. 5 and the parameters are given in Table 4. From the figure, we can see that the curves of all of the samples are in accordance with a normal distribution, demonstrating that all of the materials have uniform particle size distributions. From Table 4 it can be seen that the particle sizes (D10, D50 and D90) of the yttrium doped materials are smaller than that of the undoped sample, which indicates that the particle size of the LiNi0.5Co0.2Mn0.3O2 material is reduced by yttrium doping. The results are in agreement with the SEM images.
| Sample | D10 (μm) | D50 (μm) | D90 (μm) |
|---|---|---|---|
| Y-0 | 4.713 | 9.203 | 15.645 |
| Y-0.01 | 3.662 | 8.395 | 14.881 |
| Y-0.02 | 3.648 | 7.361 | 13.390 |
| Y-0.03 | 3.561 | 7.056 | 12.745 |
X-ray photoelectron spectroscopy measurements were used to confirm the oxidation states of the transition metals and yttrium element on the surface of the Y-0.02 sample. As shown in Fig. 6a, in the Ni XPS spectra, the Ni 2p3/2 binding energy peak is situated at 854.73 eV. According to the literature, the Ni 2p3/2 binding energy peaks of NiO and Ni2O3 are located at 854.0 eV and 856.0 eV,41 respectively. Therefore, the oxidation state of Ni near the surface is a mixture of Ni2+ and Ni3+.25 From Fig. 6b, it can be seen that Co 2p3/2 has a binding energy of 779.63 eV which is in agreement with the value for Co3+ in LiCoO2.42 The Mn 2p3/2 binding energy peak is centred at 642.18 eV (Fig. 6c), which is similar to the value of Mn4+ in LiNi1/2Mn1/2O2.43 The binding energy peaks of Y 3d5/2 and Y 3d3/2 are 156.2 eV and 158.1 eV (Fig. 6d), which are in keeping with the value reported for Y3+.44
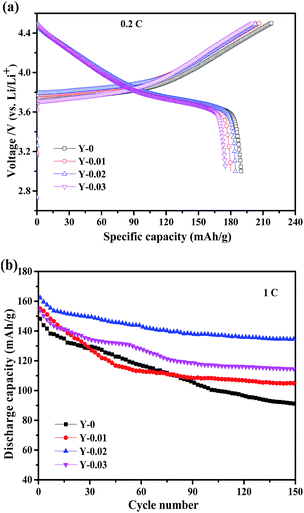
To investigate the effects of yttrium doping on the electrochemical performance, electrochemical tests were conducted utilizing the CR2430 coin cells in the voltage range of 3.0–4.5 V at ambient temperature. Fig. 7a shows the initial charge–discharge curves at 0.2C (1C = 160 mA h g−1) of the samples. It can be seen that all of the charge–discharge curves are smooth and stable, signifying that no phase transformation occurs during the charge–discharge process. From the figure we can see that the samples Y-0, Y-0.01, Y-0.02 and Y-0.03 exhibit charge/discharge capacities of 218.1/189.8, 206.5/180.1, 203.8/184.4 and 200.2/175.3 mA h g−1, respectively, with coulombic efficiencies of 87.0%, 87.2%, 90.5% and 87.6%, respectively. The results indicate that although the discharge capacities of the yttrium materials have decreased, the coulombic efficiencies have improved. The reduced initial discharge capacity of the yttrium doped materials may be ascribed to a decrease in the number of active ions resulting from the substitution by Y3+ ions.
The cycling performance curves of the as-obtained materials at a rate of 1C are presented in Fig. 7b. It can be observed from the figure that the yttrium-doped samples reach a stable discharge capacity at a low current density of 1C after 150 cycles. The discharge capacities at the initial and 150th cycle for the samples Y-0, Y-0.01, Y-0.02 and Y-0.03 are 148.2/91.0, 155.0/104.8, 162.4/134.8 and 153.8/114.6 mA h g−1, respectively, resulting in capacity retention ratios of 61.4%, 67.6%, 83.0% and 74.5% after 150 cycles at a rate of 1C, which indicates the better cycling stability of the yttrium-doped materials. The enhanced cycling performance may be attributed to the more stable structure of the yttrium doped materials, resulting from the stronger bonding energy of Y–O than that of Co–O. The discharge curves of the Y-0 and Y-0.02 materials after the 1st and 100th cycle at a rate of 1C are displayed in Fig. 8. It can be seen from Fig. 8, that the discharge voltage platform of the Y-0.02 material is higher and longer than that of the Y-0 sample both in the 1st and 100th cycles, which means that the doped cathode exhibits good voltage stability during the cycling process.
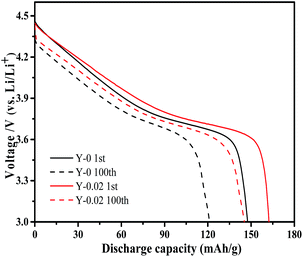 | ||
| Fig. 8 Discharge curves of the Y-0 and Y-0.02 samples after the 1st and 100th cycle at a rate of 1C. | ||
Fig. 9a shows the rate capacity curves for all of the synthesized materials, which were measured at rates of 0.2, 0.5, 1, 2, 3, 4, 5 and 10C in the voltage range of 3.0–4.5 V. The discharge capacities of all of the batteries declined with an increase in the current density. Although the Y-0 samples exhibited the highest initial discharge capacity, it declined steeply with an increase in the C-rates, only delivering a discharge capacity of 90.8 mA h g−1 at a rate of 10C. However, the rate capability of the yttrium doped materials was improved, and the Y-0.02 sample showed the best rate capacity, with a discharge capacity of 125.6 mA h g−1 at a rate of 10C. It can be observed from Fig. 9b–e that the discharge voltages of the yttrium doped samples were higher than that of the pristine one, especially at high rates, which implies that the electrode polarization was suppressed by yttrium doping. The improved high rate capacity could be ascribed to the lower polarization of the yttrium doped materials.
 | ||
| Fig. 9 Rate capability of the prepared materials (a), and the corresponding initial discharge curves of the (b) Y-0, (c) Y-0.01, (d) Y-0.02 and (e) Y-0.03 samples. | ||
As is well known, cathode materials with good low-temperature performance can expand their range of applications. The impact of yttrium doping on the low-temperature performance was examined. Fig. 10a shows the discharge curves of the LiNi0.5Co0.2−xMn0.3YxO2 samples at −20 °C at a rate of 0.2C. The Y-0.02 cathode exhibited the highest discharge capacity of 148.9 mA h g−1, which is 81% of the same discharge rate at 25 °C, whereas the discharge capacities of Y-0, Y-0.01 and Y-0.03 were 132.9, 135.1 and 126.7 mA h g−1, respectively, which correspond to 70%, 75%, and 72% of the same discharge rate at 25 °C. The results demonstrated that yttrium doping can improve the low-temperature performance of LiNi0.5Co0.2Mn0.3O2, which might be attributed to the expanded lithium ions diffusion channels, the reduced cation mixing and the lower polarization. Fig. 10b shows the cycling performance curves of the Y-0 and Y-0.02 materials at −20 °C at a rate of 0.2C. It can be seen that the discharge capacities at the 1st and 50th cycles for the samples Y-0 and Y-0.02 are 132.8/85.0 and 148.1/120.7 mA h g−1, respectively, leading to capacity retention rates of 63.8% and 81.5% after 50 cycles at a rate of 0.2C, which implies a better cycling stability of the yttrium doped materials even at a low temperature of −20 °C.
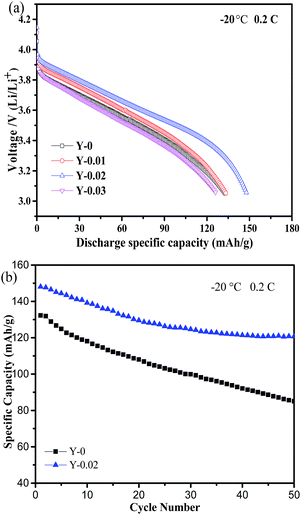 | ||
| Fig. 10 (a) Discharge curves of the samples at a rate of 0.2C at −20 °C and (b) the cycling performance curves of the samples Y-0 and Y-0.02 at a rate of 0.2C at −20 °C. | ||
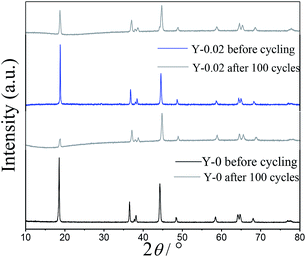
To further investigate the influence of yttrium doping on the structure of LiNi0.5Co0.2Mn0.3O2, PXRD patterns of the Y-0 and Y-0.02 materials after 100 cycles at a rate of 1C were measured and are presented in Fig. 11. It can be clearly observed that the intensities of all of the diffraction peaks of both samples decrease after the cycling process, which suggests that the crystallinity of both cathodes was subjected to varying degrees of damage. The decline in the value of I(003)/I(104) of both of the materials after 100 cycles indicated that the degree of cation mixing increased after cycling, as shown in Table 5. Moreover, the R-factor (R = (I006 + I102)/I101) stands for the ordering of the hexagonal structure of materials, and the higher the value is, the lower the ordering degree of the sample. The Y-0.02 material shows little change in the R value, which confirms that yttrium doping is favorable for stabilizing the layered structure of LiNi0.5Co0.2Mn0.3O2 cathode materials.
| Samples | I003/I104 | (I006 + I102)/I101 |
|---|---|---|
| Y-0 before cycling | 1.4925 | 0.4498 |
| Y-0 after 100 cycles | 0.5012 | 1.2702 |
| Y-0.02 before cycling | 1.6181 | 0.4011 |
| Y-0.02 after 100 cycles | 1.0523 | 0.6558 |
The SEM morphologies of the Y-0 and Y-0.02 materials after 100 cycles are shown in Fig. 12. It can be seen that the morphology of the Y-0 sample was subjected to serious damage, whereas the Y-0.02 particles still retain an integrated morphology after 100 cycles, which is consistent with the PXRD results. A possible reason for this is that the total metal–oxygen bonding energy of the Y-0.02 material is stronger than that of Y-0, resulting in an improvement in the structure stability.
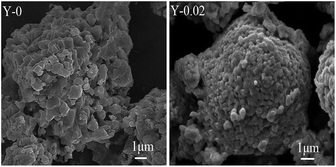 | ||
| Fig. 12 SEM images of the Y-0 and Y-0.02 materials after 100 cycles at a rate of 1C between 3.0–4.5 V. | ||
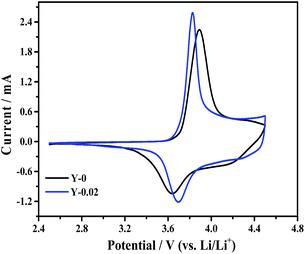
Cyclic voltammetry measurements were recorded to study the oxidation and reduction behaviors of the Y-0 and Y-0.02 samples and the curves were acquired at a scanning rate of 0.1 mV s−1 from 2.5 to 4.5 V, presented in Fig. 13. Both materials show a major oxidation peak at around 3.9 V corresponding to a Ni2+/Ni4+ redox couple. Generally, the polarization degree could be evaluated by the potential difference (ΔΦ) between the oxidation (Φox) and reduction (Φred) peaks, with a higher value indicating a larger polarization. It can be seen from Table 6 that the Y-0.02 sample shows a smaller potential difference than that of the material Y-0, that is, the Y-0.02 material has a smaller polarization, indicating that the electrochemical kinetics of LiNi0.5Co0.2Mn0.3O2 are enhanced by yttrium doping, leading to an enhanced electrochemical performance.
| Sample | Φox (V) | Φred (V) | ΔΦ (V) |
|---|---|---|---|
| Y-0 | 3.895 | 3.640 | 0.255 |
| Y-0.02 | 3.827 | 3.691 | 0.136 |
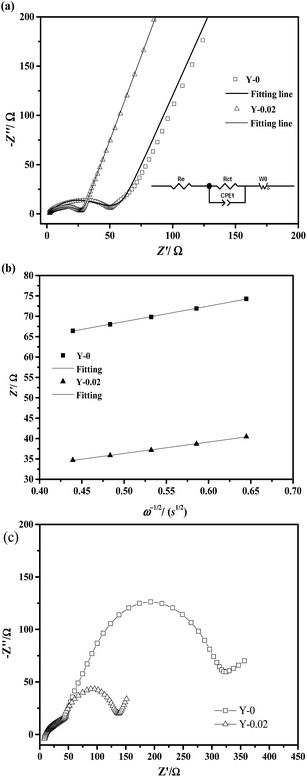
The ability of cathode materials to intercalate lithium ions is closely linked to both their electronic and ionic conduction. In order to investigate the effects of yttrium doping on the electronic and ionic conduction of the materials, the electronic conductivity and lithium ion diffusion coefficients were calculated and are summarized in Table 7. EIS measurements on the Y-0 and Y-0.02 samples were carried out at a fully discharged state after the first cycles, the Nyquist plots of which are shown in Fig. 14a, and the experimental results were fitted using the equivalent circuit model (the inset of Fig. 14a). The Nyquist plots of both materials displayed a similar profile, including a semicircle in the high frequency region and a straight line in the low frequency region. The semicircle in the high frequency region is caused by charge transfer resistance (Rct) and the sloping line in the low frequency region represents the Warburg impedance (W0) caused by the diffusion of the lithium ions in the solid electrode.45,46 As provided in Table 7, the Rct values of the Y-0 and Y-0.02 samples were 43.27 Ω and 26.74 Ω, respectively, indicating that the Y-0.02 material exhibited a lower charge transfer resistance and better electrochemical kinetics, inducing a higher rate capability.
| Samples | Rct (Ω) | σ (Ω s1/2) | DLi+ (cm2 s−1) | G (S cm−1) |
|---|---|---|---|---|
| Y-0 | 43.27 | 38.241 | 2.486 × 10⁻¹² | 1.90 × 10⁻³ |
| Y-0.02 | 26.74 | 28.044 | 7.729 × 10⁻¹⁰ | 2.69 × 10⁻² |
The lithium ion diffusion coefficient can be calculated using the following equation:
 | (2) |
| Z′ = Rct + Rs + σω−1/2 | (3) |
The EIS measurements of the Y-0 and Y-0.02 samples after 50 cycles in a fully discharged state were also carried out to investigate the influence of yttrium on the electrode impedance vs. cycling, as shown in Fig. 14c. In general, small interruptions in the high frequency region correspond to the impedance of the electrolyte (Rs). The semicircle in the high frequency region represents the impedance of the solid-electrolyte interface layer (RSEI), the semicircle in the middle frequency region represents the charge transfer impedance (Rct) at the electrode/electrolyte interface and the sloping line in the low frequency region corresponds to the diffusion of lithium ions in the solid electrodes (ZW). The electrolyte resistance (Rs) is almost the same because of the same electrolyte and fabrication parameters. The RSEI value of the Y-0 sample is equal to that of the Y-0.02 sample after 50 cycles, which indicates that there is no real difference between the solid-electrolyte interface layer formed on the surfaces of the Y-0 and Y-0.02 electrodes. It also denotes that yttrium ions are doped into the crystal lattice rather than coated on the surface of the material on account of the fact that the RSEI value is closely related to the surface composition. However, there is a big difference between the charge transfer resistance (Rct) values of the Y-0 and Y-0.02 materials after 50 cycles. Combined with Fig. 14a and c, the Rct values of the Y-0 sample after the first and 50th cycle are 43.27 and 275.12 Ω, respectively, and the Rct values of the Y-0.02 sample after the first and 50th cycle are 26.74 and 92.67 Ω, respectively. Therefore, yttrium doping is beneficial for decreasing the charge transfer resistance after the cycling process. In other words, yttrium doping has a big influence on suppressing the increase in the charge transfer resistance during the cycling process.
Conclusions
Layered LiNi0.5Co0.2−xMn0.3YxO2 (x = 0, 0.01, 0.02, 0.03) cathode materials were synthesized using a co-precipitation method. All of the yttrium doped materials exhibited a better cycling performance, superior rate capability and low-temperature performance at a higher voltage than the undoped material, and this might be attributed to the reduced cation mixing, expanded lithium ion diffusion path, lower polarization and stabilized structure of the yttrium doped samples. In particular, the Y-0.02 sample exhibited the best electrochemical performance, delivering a high discharge capacity of 125.6 mA h g−1, even at a rate of 10C, with a capacity retention of 83.0% after 150 cycles at a rate of 1C, and showed a high discharge capacity of 148.9 mA h g−1 at −20 °C at a rate of 0.2C, with a capacity retention of 81.5% after 50 cycles at −20 °C at a rate of 0.2C. CV and EIS results revealed that the Y-0.02 sample exhibits lower polarization, lower charge transfer resistance and higher lithium ion diffusion coefficient, which enhance the lithium ion kinetics. In addition, the electronic conductivity of Y-0.02 is improved by approximately fourteen times that of the Y-0 material. On the one hand, the enhanced rate capability and low-temperature performance could be attributed to the improvement of the electronic and ionic conductivity, the decrease of the cation mixing degree and polarization after yttrium doping; on the other hand, the improved cycling stability might be attributed to the more stable structure after yttrium doping. Therefore, this study details new information about the function of ion doping.Conflicts of interest
There are no conflicts to declare.References
- Z. Liu, A. Yu and J.-Y. Lee, J. Power Sources, 1999, 81–82, 416 CrossRef CAS.
- Y. Chen, G.-X. Wang, K. Konstantinov, H.-K. Liu and S.-X. Dou, J. Power Sources, 2003, 119, 184 CrossRef.
- Y.-K. Sun, S.-T. Myung, B.-C. Park, J. Prakash, I. Belharouak and K. Amine, Nat. Mater., 2009, 8, 320 CrossRef CAS PubMed.
- L. Wang, J. Li, X. He, W. Pu, C. Wan and C. Jiang, J. Solid State Electrochem., 2009, 13, 1157 CrossRef CAS.
- H. Kitaura, A. Hayashi, K. Tadanaga and M. Tatsumisago, Electrochim. Acta, 2010, 55, 8821 CrossRef CAS.
- M. Noh and J. Cho, J. Electrochem. Soc., 2013, 160, A105 CrossRef CAS.
- K. Wu, F. Wang, L. Gao, M.-R. Li, L. Xiao, L. Zhao, S. Hu, X. Wang, Z. Xu and Q. Wu, Electrochim. Acta, 2012, 75, 393 CrossRef CAS.
- Y.-H. Cho, D. Jang, J. Yoon, H. Kim, T.-K. Ahn, K.-W. Nam, Y.-E. Sung, W.-S. Kim, Y.-S. Lee, X.-Q. Yang and W.-S. Yoon, J. Alloys Compd., 2013, 526, 219 CrossRef.
- S.-K. Jung, H. Gwon, J. Hong, K.-Y. Park, D.-H. Seo, H. Kim, J. Hyun, W. Yang and K. Kang, Adv. Eng. Mater., 2014, 4, 1 Search PubMed.
- P. Hou, X. Wang, D. Song, X. Shi, L. Zhang, J. Guo and J. Zhang, J. Power Sources, 2014, 265, 174 CrossRef CAS.
- K. Yang, L.-Z. Fan, J. Guo and X. Qu, Electrochim. Acta, 2012, 63, 363 CrossRef CAS.
- J.-Z. Kong, C. Ren, G.-A. Tai, X. Zhang, A.-D. Li, D. Wu, H. Li and F. Zhou, J. Power Sources, 2014, 266, 433 CrossRef CAS.
- W. Liu, M. Wang, X. Gao, W. Zhang, J. Chen, H. Zhou and X. Zhang, J. Alloys Compd., 2012, 543, 181 CrossRef CAS.
- K. Liu, G.-L. Yang, Y. Dong, T. Shi and L. Chen, J. Power Sources, 2015, 281, 370 CrossRef CAS.
- J. Xu, X. Chen, C. Wang, L. Yang, X. Gao, Y. Zhou, K. Xiao and X. Xi, Ceram. Int., 2017, 43, 11848 CrossRef CAS.
- X.-Q. Yang, Z.-F. Tang, H.-Y. Wang, B.-K. Zou and C.-H. Chen, Ionics, 2016, 11, 2235 CrossRef.
- Y. Huang, F.-M. Jin, F.-J. Chen and L. Chen, J. Power Sources, 2014, 256, 1–7 CrossRef CAS.
- Z. Wang, S. Huang, B. Chen, H. Wu and Y. Zhang, J. Mater. Chem. A, 2014, 2, 19983 CAS.
- D. Wang, X. Li, Z. Wang, H. Guo, Z. Huang, L. Kong and J. Ru, J. Alloys Compd., 2015, 647, 612 CrossRef CAS.
- L. Li, Z. Chen, Q. Zhang, M. Xu, X. Zhou, H. Zhu and K. Zhang, J. Mater. Chem. A, 2015, 3, 894 CAS.
- Y. Mo, B. Hou, D. Li, X. Jia, B. Cao, L. Yin and Y. Chen, RSC Adv., 2016, 6, 88713 RSC.
- X. Li, X. Zhao, M.-S. Wang, K.-J. Zhang, Y. Huang, M.-Z. Qu, Z.-L. Yu, D.-S. Geng, W.-G. Zhao and J.-M. Zheng, RSC Adv., 2017, 7, 24359 RSC.
- W. Hua, J. Zhang, Z. Zheng, W. Liu, X. Peng, X.-D. Guo, B. Zhong, Y.-J. Wang and X. Wang, Dalton Trans., 2014, 43, 14824 RSC.
- Z.-G. Yang, X.-D. Guo, W. Xiang, W.-B. Hua, J. Zhang, F.-R. He, K. Wang, Y. Xiao and B.-H. Zhong, J. Alloys Compd., 2017, 699, 358 CrossRef CAS.
- D. Wang, X.-H. Li, Z.-X. Wang, H.-J. Guo, Y. Xu, Y.-L. Fan and J.-J. Ru, Electrochim. Acta, 2016, 188, 48 CrossRef CAS.
- L. Xia, K. Qiu, Y. Gao, X. He and F. Zhou, J. Mater. Sci., 2015, 50, 2914 CrossRef CAS.
- D. Aurbach, O. Srur-Lavi, C. Ghanty, M. Dixit, O. Haik, M. Talianker, Y. Grinblat, N. Leifer, R. Lavi, D.-T. Major, G. Goobes, E. Zinigrad, E.-M. Erickson, M. Kosa, B. Markovsky, A. Volkov, J.-Y. Shin and A. Garsuch, J. Electrochem. Soc., 2015, 162, A1014 CrossRef CAS.
- X. Zhao, G. Liang and D. Lin, RSC Adv., 2017, 7, 37588 RSC.
- H.-L. Zhu, T. Xie, Z.-Y. Chen, L.-J. Li, M. Xu, W.-H. Wang, Y.-Q. Lai and J. Li, Electrochim. Acta, 2014, 135, 77–85 CrossRef CAS.
- N. Li, R. An, Y. Su, F. Wu, L. Bao, L. Chen, Y. Zheng, H. Shou and S. Chen, J. Mater. Chem. A, 2013, 1, 9760 CAS.
- M. Wang, Y. Chen, F. Wu, Y. Su, L. Chen and D. Wang, Electrochim. Acta, 2010, 55, 8815 CrossRef CAS.
- M. Prabu, S. Selvasekarapandian, A. R. Kulkarni, S. Karthikeyan, G. Hirankumar and C. Sanjeeviraja, Ionics, 2011, 17, 201 CrossRef CAS.
- W. Wu, J. Guo, X. Qin, C. Bi, J. Wang, L. Wang and G. Liang, J. Alloys Compd., 2017, 721, 721 CrossRef CAS.
- S. Kang, H. Qin, Y. Fang, X. Li and Y. Wang, Electrochim. Acta, 2014, 144, 22 CrossRef CAS.
- H. Li, Y. Wang, X. Yang, L. Liu, L. Chen and J. Wei, Solid State Ionics, 2014, 255, 84 CrossRef CAS.
- T. Ohzuku and A. Ueda, J. Electrochem. Soc., 1994, 141, 2972 CrossRef CAS.
- R.-V. Mangalaraja, J. Mouzon, P. Hedstrom, I. Kero, K.-V.-S. Raman, C.-P. Camurri and M. Oden, J. Mater. Process. Technol., 2008, 208, 415 CrossRef CAS.
- S.-T. Myung, K. Izumi, S. Komaba, H. Yashiro, H.-J. Bang, Y.-K. Sun and N. Kumagai, J. Phys. Chem. C, 2007, 111, 4061 CAS.
- N. Tran, L. Croguennec, C. Jordy, P. Biensan and C. Delmas, Solid State Ionics, 2005, 176, 1539 CrossRef CAS.
- J.-A. Dean, New York Google Scholar, 1985.
- R. Hang, X. Huang, L. Tian, Z. He and B. Tang, Electrochim. Acta, 2012, 70, 382 CrossRef CAS.
- V.-R. Galakhov, E.-Z. Kurmaev, S. Uhlenbrock and M. Neumann, Solid State Commun., 1996, 99, 221 CrossRef CAS.
- S. Gopukumar, K.-Y. Chung and K.-B. Kim, Electrochim. Acta, 2004, 49, 803 CrossRef CAS.
- H. Pedersen, F. Söderlind, R.-M. Petoral, K. Uvdal, P.-O. Käll and L. Ojamäe, Surf. Sci., 2005, 592, 124 CrossRef CAS.
- N. Takami, A. Satoh, M. Hara and T. Ohsaki, J. Electrochem. Soc., 1995, 142, 371 CrossRef CAS.
- T. Osaka, S. Nakade, M. Rajamaki and T. Momma, J. Power Sources, 2003, 119, 929 CrossRef.
| This journal is © The Royal Society of Chemistry 2018 |

