 Open Access Article
The influence of graphene nanoplatelets (GNPs) on the semi-blunt puncture behavior of woven fabrics impregnated with shear thickening fluid (STF)
Fei-Fei Wanga,
Yan Zhangabc,
Hao Zhanga,
Lan Xua,
Ping Wang *abd and
Chong-bin Guo*e
aNational Engineering Laboratory for Modern Silk, College of Textile and Clothing Engineering, Soochow University, Suzhou, China. E-mail: pingwang@suda.edu.cn; jacob626@126.com
bNantong Textile & Silk Industrial Technology Research Institute, China
cJiangsu Wangong Technology Group Co., Ltd, China
dWujiang Xinfeng Weaving Co., Ltd, China
eShanghai Engineering Center for Microsatellites, Shanghai, China
First published on 30th January 2018
Abstract
Fabrics are widely applied in various fields, such as body armor, aerospace industry and military equipment. This paper reports the semi-blunt puncture behavior of fabrics impregnated with a shear thickening fluid (STF), which is a dispersion system of nano silica/polyethylene glycol (SiO2/PEG). The rheological properties and microstructure of the STF were tested to evaluate the influence of SiO2 particle size and additives (graphene nanoplatelets) on the puncture behavior of the final fabrics. The surface characteristics of neat and STF-treated fabrics were separately measured by field emission scanning electron microscopy (FESEM), which helps study the damage morphology and mechanism of the fabric. The surface characteristics of the silica nanoparticles and additives were also measured by transmission electron microscopy (TEM). The results demonstrated that the puncture behavior of the woven fabric was significantly enhanced due to the presence of STF. Moreover, the presence of additive GNPs induced a relatively lower shear thickening phenomenon, while a significant enhancement in the semi-blunt puncture behavior of the woven fabric was observed.
1 Introduction
Puncture damage is one of the most common failure modes suffered by textile structures during their service periods. There are various methods to improve the puncture or stab performances of textile materials. Researchers have paid increasing attention to shear thickening fluids (STF)1–6 due to their miraculous shear thickening property that has the potential to resist puncture. STF is a type of non-Newtonian fluid in which the viscosity increases as a function of the shear rate.7,8 A particularly dramatic non-Newtonian behavior, known as discontinuous shear thickening, occurs in many densely-packed suspensions and colloids. These suspensions feel like a thin liquid when stirred weakly, but feel very thick when stirred harder, and feel thin again when the stress is removed.9 Therefore, there has been extensive research focused on improving the puncture resistance of fabrics by impregnation with a shear thickening fluid.10–12Numerous studies have made a great effort towards the optimal design of woven fabrics with excellent puncture performances.13–18 A series of process parameters, such as the STF concentration, average particle size of silica, particle hardness, dispersing media, solvent ratio and padding pressure, was systematically evaluated. Majumdar et al.19 found that higher silica concentrations, higher padding pressures and lower solvent ratios lead to higher puncture energy absorption in STF-treated fabrics. Five different weave structures were prepared with different thread densities followed by treatment with 60% (w/w) STF to test for impact resistance.20 Feng et al.17 treated the fabric with fumed and submicron silica particles, respectively, and found that the puncture performance of the latter sample is far better than that of the former. It is explained that submicron silica-STF tends to increase the interface friction of fabrics and the tensile strength of yarns, which leads to greater improvement of puncture resistance. Li et al.21 investigated the influence of a dispersing medium (polyethylene glycol) of different molecular weights and of additives (PEG 6000 and PEG 10000) of different concentrations and molecular chain lengths on the fabric puncture performance. Research suggests that additives greatly improve puncture resistance force and energy absorption. STF-treated fabrics are much stronger in terms of puncture resistance performance than neat fabrics.22 Gurgen et al.23 found that the puncture resistance of STF/fabric systems is enhanced as the particle size of the additive (silicon carbide) becomes coarser in multi-phase STFs. However, the fabric impregnated with a suspension containing carbon nano-tubes (CNTs) showed a lower degree of shear-thickening, which consequently causes a lower puncture resistance performance.22
To the best of our knowledge, however, the semi-blunt puncture performance of woven fabrics impregnated with a colloidal suspension of silica with a shear thickening behavior has not been reported yet. In the present study, two types of silica particles with a diameter of 12 nm and 200–300 nm, respectively, are evenly dispersed into polyethylene glycol (PEG) to prepare the STF. Furthermore, graphene nanoplatelets (GNPs) are considered to assess the influence of additives on the rheological properties of STF and on the puncture performance of the treated woven fabrics. The findings herein will provide a potential design method to improve the puncture resistance of textile structures.
2 Experimental
2.1 Materials
The specifications of the polyester (PET) fabric used in the present study are listed in Table 1.| Structure | Thickness (mm) | Areal density (g m−2) | Warp density (ends per 10 cm) | Weft density (ends per 10 cm) |
|---|---|---|---|---|
| Plain | 0.44 | 250 | 117 | 71 |
Acetone (Analytical Reagent) was supplied by Chinasun Specialty Products Co., Ltd. The PET fabric was first immersed in acetone, followed by an ultrasonic bath (∼10 min), and was finally washed thoroughly with demineralized water and air-dried. GNPs with a thickness of 6–8 nm and width of 5 μm were purchased from Tokyo Chemical Industry Co., Ltd (Japan). Fumed silica nanoparticles (AEROSIL 200) with a primary particle size of 12 nm and specific surface area of 200 m2 g−1 were purchased from Degussa (Germany). Another type of fumed silica nanoparticles with particle size ranging from 200–300 nm (in the form of an aggregate), a specific surface area of 200 m2 g−1 ± 25 m2 g−1 and a density of 1.53 g cm−3 were purchased from Sigma Aldrich, USA. The transmission electron microscopy (TEM) images of the GNPs and fumed silica nanoparticles (12 nm and 200–300 nm) are shown in Fig. 1. PEG (Analytical Reagent) with an average molecular weight of 200 g mol−1 was obtained from Aladdin (Shanghai, China). Ethanol absolute (Analytical Reagent) was offered by Shanghai Lingfeng Chemical Reagent Co., Ltd.
 | ||
| Fig. 1 TEM micrographs of (a) fumed silica nanoparticles (12 nm); (b) fumed silica nanoparticles (200–300 nm); (c) GNPs. | ||
2.2 Preparation of STF
The STF is prepared by dispersing fumed silica nanoparticles into PEG 200 and mixing in a mechanical mixer rotating at 200–500 r per min to avoid initial agglomeration and obtain a uniform and stable suspension liquid system. To enhance the dispersion of the nanosized silica particles, a batch addition strategy was adopted until the desired concentration was achieved. GNPs are added to the well-dispersed and sonicated SiO2/PEG 200 solution to obtain STF with additives. All prepared suspensions are then left undisturbed at room temperature to remove air bubbles. The concentration of the fumed silica nanoparticles (12 nm and 200–300 nm) is set as 20 wt%, and the additive (GNPs) concentration in the STF samples is set as 0.8 wt%. The parameters of the prepared STF specimens are summarized in Table 2.| STF | Dispersing phase (SiO2) | Dispersing medium | Additive mass fraction (%) | |
|---|---|---|---|---|
| Type | Concentration (wt%) | |||
| STF1 | 12 nm | 20 | PEG 200 | 0 |
| STF2 | 200–300 nm | 20 | PEG 200 | 0 |
| STF3 | 12 nm | 20 | PEG 200 | 0.8 |
| STF4 | 200–300 nm | 20 | PEG 200 | 0.8 |
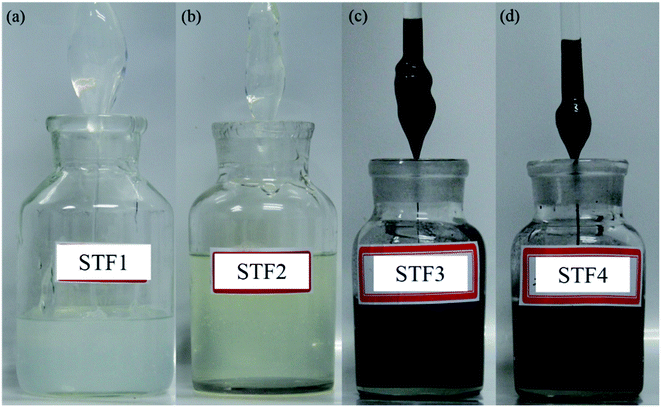
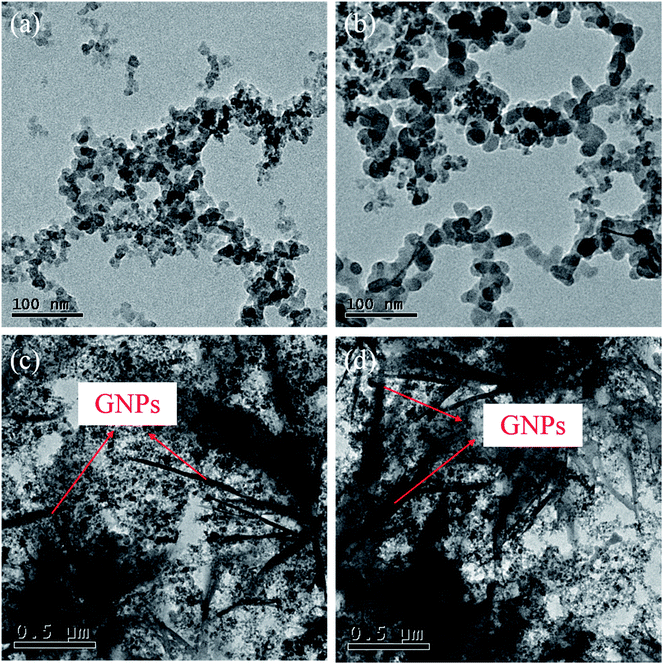
The photos of the four prepared STF samples are shown in Fig. 2. The transmission electron microscopy (TEM) images of all STF samples (defined as STF1, STF2, STF3 and STF4) are shown in Fig. 3. It can be seen from Fig. 3 that the GNPs are rolled up in the STF suspension compared with Fig. 1(c), which is mainly caused by the continual mechanical stirring during the dispersing process.
2.3 Preparation of STF-treated fabrics
The impregnation of the PET fabric with STF is difficult because of the high viscosity and surface tension of the STF. For a better infiltration of the STF suspension into the fibers, the STF is first diluted with ethanol at a 1![[thin space (1/6-em)]](https://www.rsc.org/images/entities/char_2009.gif) :
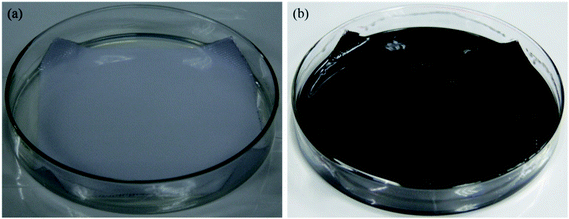
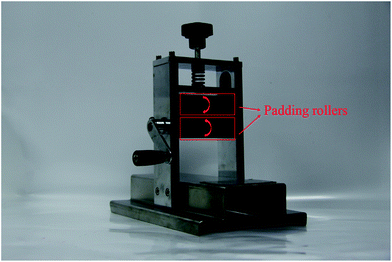
:![[thin space (1/6-em)]](https://www.rsc.org/images/entities/char_2009.gif) 1 volume ratio and irradiated with an ultrasonic wave for about an hour. The 120 × 120 mm fabrics are soaked inside the STF/ethanol solution for 15 minutes (as shown in Fig. 4), then the infiltrated samples are padded by using a padder that has a pair of rubber rollers through which the soaked fabrics can be pressed (Fig. 5). Afterwards, all samples were put into a drying oven at 60 °C for 24 h to evaporate the ethanol from the samples and obtain the STF-treated fabrics.
1 volume ratio and irradiated with an ultrasonic wave for about an hour. The 120 × 120 mm fabrics are soaked inside the STF/ethanol solution for 15 minutes (as shown in Fig. 4), then the infiltrated samples are padded by using a padder that has a pair of rubber rollers through which the soaked fabrics can be pressed (Fig. 5). Afterwards, all samples were put into a drying oven at 60 °C for 24 h to evaporate the ethanol from the samples and obtain the STF-treated fabrics.
2.4 Characterizations
The rheological properties of the STF are characterized using a Rheometer (AR 2000, TA Instruments, USA). All rheological tests are operated in a cone-and-plate (40 mm in diameter and 1° in cone angle) with a gap of 28 μm at a temperature of 25 °C and a shear rate ranging from 0.1 to 1000 s−1.The distribution and morphology of the fumed silica nanoparticles, additives (GNPs) and STF are characterized with a transmission electron microscope (TEM, FEI Tecnai G20, USA) operating at 200 KV.
The add-on% is estimated by using the following formula to assess the actual amount of STF present in the STF-treated fabrics.
 | (1) |
The permeability is measured to determine the air permeability of the fabric according to China textile criteria of GB/T 5453 (China textile criteria of 5453, 1997). The permeability measurement is carried out on an YG461E-III Fully Automatu Permeability Instrument from Ningbo Textile instrument Factory (Zhejiang, China). The process parameters in this study are set as follows: a differential pressure of 200 Pa and an area of 20 cm2.
A flexibility test is performed to examine the effect of STF on the flexibility of the neat fabric. To perform the flexibility test, the treated and neat fabric are cut to 2.5 cm × 20 cm. The flexibility study is carried out using a YG (B) 022D automatic fabric hardness tester (Wenzhou Darong Textile Instrument Co., Ltd, Zhejiang, China) to analyze the flexibility of the samples.
The surface structure and morphology of the neat and STF-treated fabrics are characterized with a field emission scanning electron microscope (FESEM, Hitachi S-4800, Japan). All samples are dried at room temperature, and then sputter-coated with gold by an IB-3 (Eiko, Japan) for 120 s.
An energy dispersive spectrometer (EDS) fitted to a TM3030 scanning electron microscope was used for elemental analysis.
The semi-blunt puncture test is performed using a universal material machine Instron-5967 (Instron Corporation, USA) at a speed of 100 mm min−1. Fig. 6 shows the geometry and detailed dimensions of the penetrator. According to Fig. 7, the 120 × 120 mm fabric samples are fixed between the two steel rings by three screws. Then, the penetrator is placed in the center of the sample, and load–displacement curves are collected for all samples. All measurements are carried out at constant temperature and constant humidity (temperature: 20 ± 2 °C, humidity: 65 ± 3%).
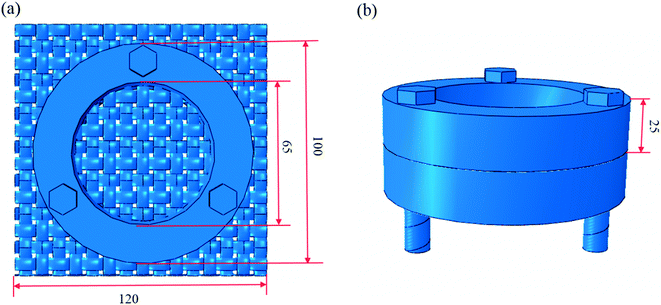 | ||
| Fig. 7 Geometric dimensions of the clamper and fabric in the semi-blunt puncture test. (a) Steel ring and fabric; (b) side view of the steel ring. | ||
3 Results and discussions
3.1 Rheological properties of STFs
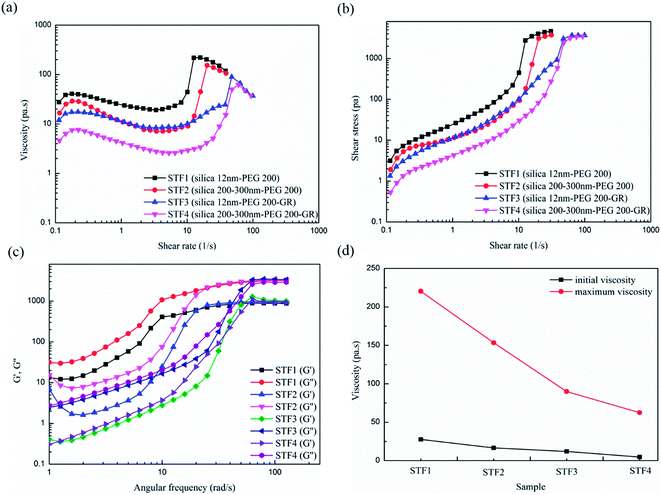
The rheological results of the STF samples show a shear thickening behavior for all the STF suspensions. Fig. 8 depicts the steady rheological properties of STF with different dispersing phases and additives. Shear thinning at low shear rates and shear thickening at relatively high shear rates are both observed in all four samples. Based on the rheological results shown in Fig. 8(a), the influence of the size of the dispersing phase on the viscosity at different shear rates can be summarized in the following three observations: first, a lower particle size generally leads to a higher initial viscosity. Second, the viscosity of STF reaches a higher value for smaller sizes of dispersing phase when the shear thickening effect occurs. Last, the critical shear rate of STF decreases markedly as the size of the dispersing phase decreases.For the same concentration of dispersing phase in the STF suspensions, the number of nanoparticles increases with the decrease in diameter. In addition, for smaller sizes, the average distance between the nanoparticles will decrease, which results in the increase of potential mutual interference between the nanoparticles. The frequent contact between nanoparticles leads to a large effective particle volume as well as a small amount of residual free solvent. As a result, the increase in resistance towards particle movement with shear thickening behavior is much more obvious.
In addition, Fig. 8(a) shows that the degree of shear thickening of the STF decreases with the addition of GNPs. It could be inferred that the addition of GNPs break the arrangement of the fumed silica nanoparticles in PEG 200, thereby reducing the viscosity of the suspension.
Fig. 8(b) shows a gradual increase in shear stress with the increase in shear rate. This gradual increase is followed by a sudden increase in the shear stress until a peak value is achieved, after which there is a slight increase. It is concluded from Fig. 8(b) that the shear stress exhibits the same trend as the viscosity, which is shown in Fig. 8(a).
The relationship between the storage modulus G′ as well as the loss modulus G′′ and the angular frequency is shown in Fig. 8(c). The measurements were conducted at a temperature of 25 °C, strain of 150% and angular frequency ranging from 1 to 200 rad s−1. It can be summarized from Fig. 8(c) that the loss modulus is higher than the storage modulus for every tested sample. Fig. 8(d) summarizes the maximum and minimum values of the viscosity with increasing shear rates for the four samples. It can be seen that the gap in viscosity tends to be smaller for bigger particle sizes as well as in the presence of GNPs additives.
3.2 STF add-on% in fabrics
Table 3 shows the values of STF add-on% on PET fabrics under equivalent process conditions. It is observed that under the same process conditions, the add-on% is highest for STF1/PET fabrics. This result may be attributed to the fact that smaller sizes of silicon dioxide nanoparticles can easily penetrate into the interior of the woven fabrics. Furthermore, the higher viscosity of STF1 will prevent the fluid from squeezing out when passing through the padder.| STF | STF1 | STF2 | STF3 | STF4 |
|---|---|---|---|---|
| Mass of neat fabric (g) | 4.33 | 4.00 | 4.30 | 4.11 |
| Mass of treated fabric (g) | 7.64 | 6.96 | 7.24 | 6.84 |
| Weight gain (g) | 3.31 | 2.96 | 2.94 | 2.73 |
| Add-on (%) | 76.44 | 74.00 | 68.37 | 66.42 |
3.3 Air permeability of the STF/PET fabrics
After impregnation, a number of particles and PEG 200 were left on the surface of the woven fabrics, in yarn gaps as well as in fiber gaps. These additions will increase the fabric tightness and decrease air permeability, as illustrated in Table 4. Compared with the original neat sample, the air permeability of the four treated samples are 26.67%, 22.93%, 19.85% and 11.32%, respectively. This is consistent with the abovementioned weight gain results. With the increase in weight gain, the air permeability drops significantly.| Samples | Sample area (cm2) | Air permeability (L m−2 s−1) | Air permeability drop ratio (%) |
|---|---|---|---|
| PET fabric | 20 | 291.94 | — |
| STF1/PET fabric | 20 | 214.08 | 26.67 |
| STF2/PET fabric | 20 | 225.00 | 22.93 |
| STF3/PET fabric | 20 | 234.00 | 19.85 |
| STF4/PET fabric | 20 | 258.90 | 11.32 |
3.4 Fabric hardness test
The flexibility test results are presented in Table 5. It is clearly seen that the treatments have no significant influence on the flexibility of the targets. Table 5 lists the extension elongation and bending length of the neat and treated fabrics, which correlate with the flexibility of the samples. As the flexibility of the sample increases, the extension elongation and bending length decrease.| Parameters | PET fabric | STF1/PET fabric | STF2/PET fabric | STF3/PET fabric | STF4/PET fabric |
|---|---|---|---|---|---|
| Extension elongation (mm) | 46.60 | 45.90 | 46.50 | 46.57 | 46.57 |
| Bending length (mm) | 22.70 | 22.33 | 22.65 | 22.67 | 22.67 |
3.5 Surface characteristics of neat fabric and STF-treated fabrics
The surface morphologies of the neat and STF-treated fabrics were taken at different magnifications and are shown in Fig. 9(a)–(j). Under minor magnification, a smaller difference can be observed between the surfaces of the neat and STF-treated fabrics. Under larger magnification, the impregnated STF can be seen to evenly cover the entire surface of the component filaments of the tested sample, thus realizing an almost homogeneous coating. It could be inferred that the addition of GNPs break the arrangement of fumed silica nanoparticles in PEG 200, thereby observing the bumps of surface of the filaments.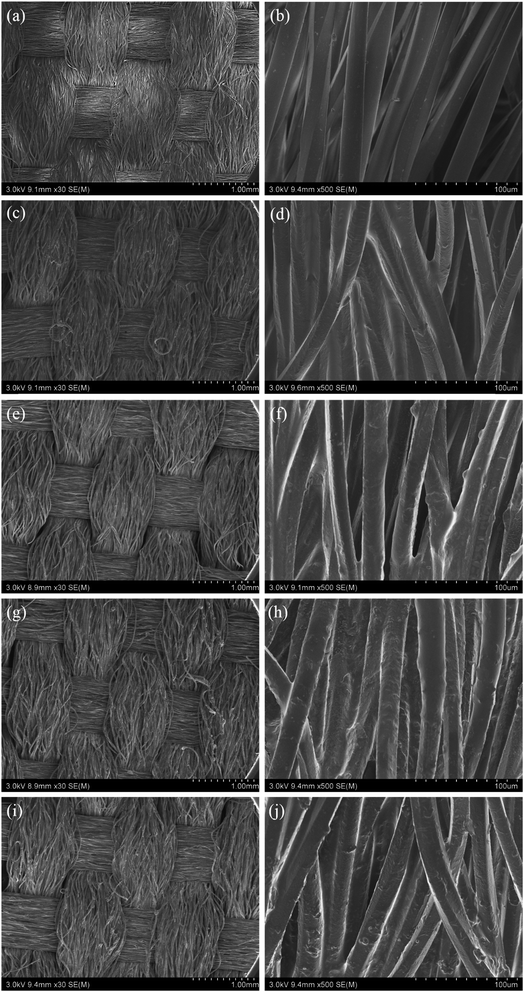 | ||
| Fig. 9 SEM images of (a) (b) PET fabric; (c) (d) STF1/PET fabric; (e) (f) STF2/PET fabric; (g) (h) STF3/PET fabric; (i) (j) STF4/PET fabric. | ||
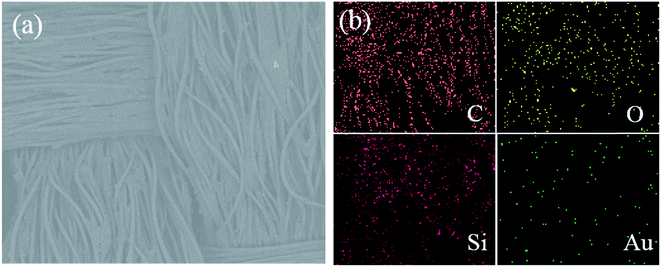
The chemical composition of the STF/PET fabrics was characterized by EDS measurements, which are illustrated in Fig. 10. The selected sample in Fig. 10 is the STF3/PET fabric with GNP additives. The main elements present in the treated sample are C, O, Si and Au. Moreover, the neat PET fabrics mostly consist of C and O, while the GNPs merely consist of C. The elemental mapping picture of Si (Fig. 10(b)) indicates that the SiO2 particles were uniformly distributed on the PET fabric surfaces. It should also be noted that Au was introduced by sputtering metallic gold on the STF/PET fabrics for the scanning electron microscopy (SEM) characterization.
3.6 Semi-blunt puncture test results
Semi-blunt puncture experiments were carried out to determine the penetration resistance performance of the PET and STF/PET fabrics. Fig. 11 shows the load–displacement curves for one neat and four STF-treated PET fabrics. Five repeated experiments were conducted for each sample to exclude the experimental errors caused by the ambient environment and sample treatment. For clarity, in Fig. 11 (new figure number in the revised manuscript), each curve corresponds to the average trend of the five repeated puncture load–displacement curves. From Fig. 11, at the beginning of the semi-blunt puncture process, the penetrator begins to contact with the targeted fabric. As a result, the component yarns are straightened as well as tensioned, and the puncture load increases at a relatively low velocity. With the continuous increase in puncture load, some loaded yarns begin to fracture, leading to zigzag load–displacement curves that arise from the yarn failure asynchronism. The failure strength and displacement for the five samples are summarized in Table 6. Upon combining the observations in Fig. 11 and Table 6, it can be noted that the STF/PET fabric supports comparatively higher loads than the neat PET fabric and the STF1/PET fabric exhibits the highest puncture resistance. The STF1/PET fabric, STF2/PET fabric, STF3/PET fabric and STF4/PET fabric can respectively suffer 30.98%, 19.87%, 10.99% and 2.13% more load than the neat PET fabric. The better semi-blunt puncture resistance of the STF/PET fabric could be attributed to the inherent shear-thickening behavior of the STF, which causes an increase in viscosity during the penetration process and consequently an increase in the rigidity of STF/PET fabric.22 Based on the non-Newtonian behavior and increased viscosity of STF, an accumulation of nanoparticles occurs, and the empty spaces between the fibers of the sample impregnated with the STF are eventually filled and subjected to a load from a penetrator.24 The shear thickening phenomenon is characterized by the formation and percolation of shear-induced transient aggregates, or “hydroclusters”, which cause flow jamming and dramatically increase the viscosity.21,25,26 Furthermore, the presence of STF restricts the movement of the yarns and fibers, making it difficult for the penetrator to puncture the fabrics.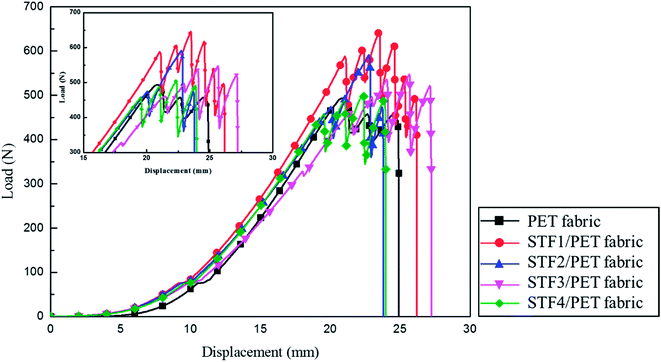 | ||
| Fig. 11 Load–displacement curves for the semi-blunt loading of the PET fabric, STF1/PET fabric, STF2/PET fabric, STF3/PET fabric and STF4/PET fabric. | ||
| Parameters | PET fabric | STF1/PET fabric | STF2/PET fabric | STF3/PET fabric | STF4/PET fabric |
|---|---|---|---|---|---|
| Maximum load (N) | 493.06 | 645.80 | 591.01 | 547.27 | 503.57 |
| Failure displacement (mm) | 24.91 | 26.19 | 23.80 | 27.22 | 23.97 |
Fig. 12 depicts the damage to the PET and STF/PET fabrics after the semi-blunt puncture tests against a penetrator. The formation of a convex crown area on the entire test surface is evident in this figure. However, due to the limited movement of the yarns and fibers, the component fibers are better preserved. Compared with neat PET fabrics (Fig. 12(a) and (b)), the damaged and extracted fibers at the damage zone of the treated STF/PET fabrics (Fig. 12(c)–(j)) are held together by friction forces, which reduce the hairiness entanglement and therefore decrease the puncture damage zone. Fig. 13 shows the micromorphologies of the damaged areas on the PET and STF/PET fabrics. The cross section morphologies for these neat and treated PET fabrics are all brittle fractures, which agree with the failure character of the PET filaments.
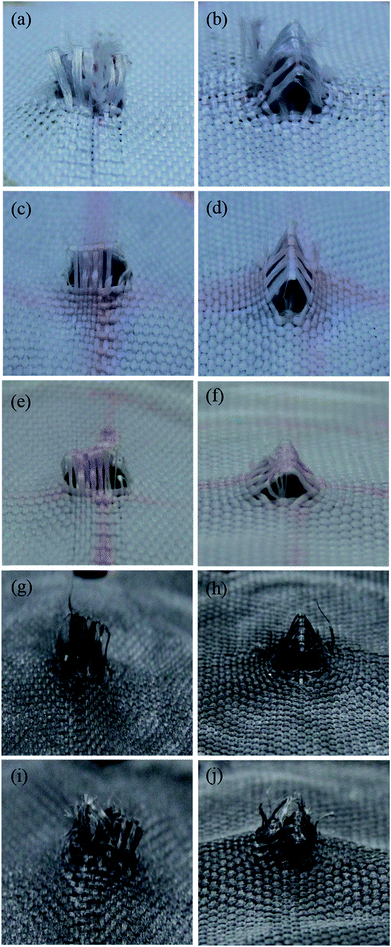 | ||
| Fig. 12 PET fabrics punctured during the semi-blunt puncture testing: (a) (b) PET fabric; (c) (d) STF1/PET fabric; (e) (f) STF2/PET fabric; (g) (h) STF3/PET fabric and (i) (j) STF4/PET fabric. | ||
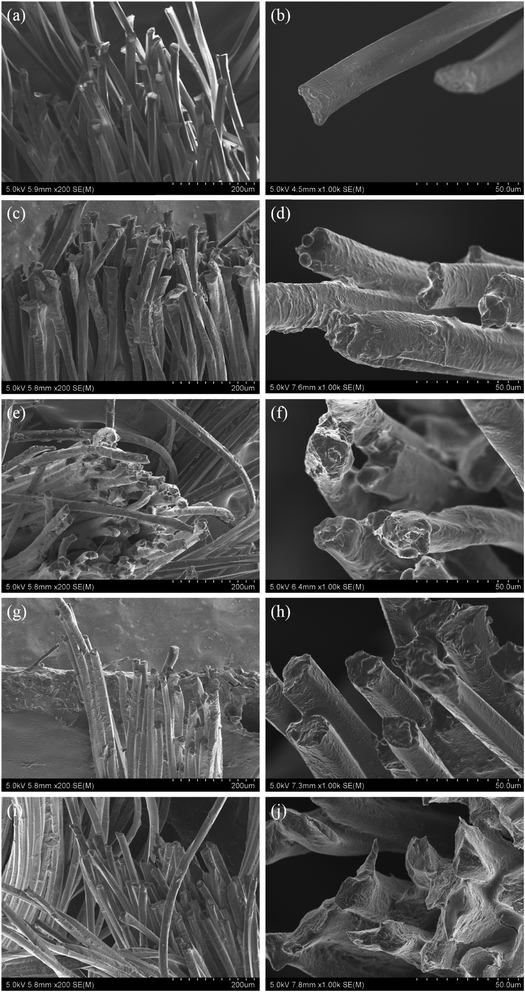 | ||
| Fig. 13 SEM micrographs of the damaged areas on the (a) (b) PET fabric; (c) (d) STF1/PET fabric; (e) (f) STF2/PET fabric; (g) (h) STF3/PET fabric and (i) (j) STF4/PET fabric. | ||
4 Conclusions
The semi-blunt puncture behaviors of neat PET fabric as well as STF-impregnated PET fabrics are systematically investigated in this study. The rheological properties and particle distribution in an STF suspension with or without additive GNPs are examined to assess the physical characteristics of the STF. Before and after impregnation, weight gain, air permeability, hardness as well as semi-blunt puncture tests were conducted. It can be concluded that the presence of STF improves the semi-blunt puncture resistance of woven fabrics, which is meaningful for engineering applications. Moreover, the presence of additive GNPs in the STF suspension leads to a comparatively lower shear thickening behavior while significantly enhancing the semi-blunt puncture performance of woven fabric.Conflicts of interest
There are no conflicts to declare.Acknowledgements
The work is thankfully supported by National Natural Science Foundation of China (grant no. 11402155 and 11602156), Natural Science Foundation of Jiangsu Province (grant no. BK20140396 and BK20140399), Nantong Science and Technology Planning Project (grant no. GY12015013 and GY12016028) and Suzhou Science and Technology Project (grant no. SS201615).References
- I. R. Peters, S. Majumdar and H. M. Jaeger, Direct observation of dynamic shear jamming in dense suspensions, Nature, 2016, 532, 214–217 CrossRef CAS PubMed.
- M. Wyart and M. E. Cates, Discontinuous Shear Thickening without Inertia in Dense Non-Brownian Suspensions, Phys. Rev. Lett., 2014, 112, 098302 CrossRef CAS PubMed.
- N. Fernandez, R. Mani, D. Rinaldi, D. Kadau, M. Mosquet, H. Lombois-Burger, J. Cayer-Barrioz, H. J. Herrmann, N. D. Spencer and L. Isa, Microscopic Mechanism for Shear Thickening of Non-Brownian Suspensions, Phys. Rev. Lett., 2013, 111, 108301 CrossRef PubMed.
- M. Roche, H. Kellay and H. A. Stone, Heterogeneity and the Role of Normal Stresses during the Extensional Thinning of Non-Brownian Shear-Thickening Fluids, Phys. Rev. Lett., 2011, 107, 134503 CrossRef PubMed.
- E. Brown, N. A. Forman, C. S. Orellana, H. Zhang, B. W. Maynor, D. E. Betts, J. M. DeSimone and H. M. Jaeger, Generality of shear thickening in dense suspensions, Nat. Mater., 2010, 9, 220–224 CrossRef CAS PubMed.
- R. P. A. Dullens and C. Bechinger, Shear Thinning and Local Melting of Colloidal Crystals, Phys. Rev. Lett., 2011, 107, 138301 CrossRef PubMed.
- H. A. Barnes, Shear-thickening (dilatancy) in suspensions of nonaggregating solid particles dispersed in newtonian liquids, J. Rheol., 1989, 33, 329–366 CrossRef CAS.
- R. L. Hoffman, Discontinuous and dilatant viscosity behavior in concentrated suspensions 2. theory and experimental tests, J. Colloid Interface Sci., 1974, 46, 491–506 CrossRef CAS.
- E. Brown, H. J. Zhang, N. A. Forman, B. W. Maynor, D. E. Betts, J. M. DeSimone and H. M. Jaeger, Shear thickening and jamming in densely packed suspensions of different particle shapes, Phys. Rev. E, 2011, 84, 11 Search PubMed.
- M. Fahool and A. R. Sabet, Parametric study of energy absorption mechanism in Twaron fabric impregnated with a shear thickening fluid, Int. J. Impact. Eng., 2016, 90, 61–71 CrossRef.
- X. L. Gong, Y. L. Xu, W. Zhu, S. H. Xuan, W. F. Jiang and W. Q. Jiang, Study of the knife stab and puncture-resistant performance for shear thickening fluid enhanced fabric, J. Compos. Mater., 2014, 48, 641–657 CrossRef.
- J. Qin, G. Zhang, L. Zhou, J. Li and X. Shi, Dynamic/quasi-static stab-resistance and mechanical properties of soft body armour composites constructed from Kevlar fabrics and shear thickening fluids, RSC Adv., 2017, 7, 39803–39813 RSC.
- D. Zielinska, B. Delczyk-Olejniczak, L. Wierzbicki, B. Wilbik-Halgas, M. H. Struszczyk and M. Leonowicz, Investigation of the effect of para-aramid fabric impregnation with shear thickening fluid on quasi-static stab resistance, Text. Res. J., 2014, 84, 1569–1577 CrossRef.
- A. Majumdar, B. S. Butola and A. Srivastava, Development of soft composite materials with improved impact resistance using Kevlar fabric and nano-silica based shear thickening fluid, Mater. Des., 2014, 54, 295–300 CrossRef CAS.
- H. R. Baharvandi, P. Khaksari, N. Kordani, M. Alebouyeh, M. Alizadeh and J. Khojasteh, Analyzing the quasi-static puncture resistance performance of shear thickening fluid enhanced p-aramid composite, Fibers Polym., 2014, 15, 2193–2200 CrossRef CAS.
- A. Majumdar, B. S. Butola and A. Srivastava, An analysis of deformation and energy absorption modes of shear thickening fluid treated Kevlar fabrics as soft body armour materials, Mater. Des., 2013, 51, 148–153 CrossRef CAS.
- X. Feng, S. Li, Y. Wang, Y. Wang and J. Liu, Effects of different silica particles on quasi-static stab resistant properties of fabrics impregnated with shear thickening fluids, Mater. Des., 2014, 64, 456–461 CrossRef CAS.
- Z. Lu, X. Jing, B. Sun and B. Gu, Compressive behaviors of warp-knitted spacer fabrics impregnated with shear thickening fluid, Compos. Sci. Technol., 2013, 88, 184–189 CrossRef CAS.
- A. Majumdar, B. S. Butola and A. Srivastava, Optimal designing of soft body armour materials using shear thickening fluid, Mater. Des., 2013, 46, 191–198 CrossRef CAS.
- A. Laha and A. Majumdar, Interactive effects of p-aramid fabric structure and shear thickening fluid on impact resistance performance of soft armor materials, Mater. Des., 2016, 89, 286–293 CrossRef CAS.
- W. Li, D. Xiong, X. Zhao, L. Sun and J. Liu, Dynamic stab resistance of ultra-high molecular weight polyethylene fabric impregnated with shear thickening fluid, Mater. Des., 2016, 102, 162–167 CrossRef CAS.
- M. Hasanzadeh, V. Mottaghitalab, H. Babaei and M. Rezaei, The influence of carbon nanotubes on quasi-static puncture resistance and yarn pull-out behavior of shear-thickening fluids (STFs) impregnated woven fabrics, Composites, Part A, 2016, 88, 263–271 CrossRef CAS.
- S. Gurgen and M. C. Kushan, The stab resistance of fabrics impregnated with shear thickening fluids including various particle size of additives, Composites, Part A, 2017, 94, 50–60 CrossRef CAS.
- E. Balali, N. Kordani and A. S. Vanini, Response of glass fiber-reinforced hybrid shear thickening fluid (STF) under low-velocity impact, J. Text. Inst., Proc. Abstr., 2016, 108.3, 376–384 Search PubMed.
- G. Bossis and J. F. Brady, The rheology of Brownian suspensions, J. Chem. Phys., 1989, 91.3, 1866–1874 CrossRef.
- W. H. Boersma, J. Laven and H. N. Stein, Viscoelastic properties of concentrated shear-thickening dispersions, J. Colloid Interface Sci., 1992, 149.1, 10–22 CrossRef.
| This journal is © The Royal Society of Chemistry 2018 |

