 Open Access Article
Creative Commons Attribution 3.0 Unported Licence
Zeolitic imidazolate framework-8 was coated with silica and investigated as a flame retardant to improve the flame retardancy and smoke suppression of epoxy resin†
Wenzong Xu *,
Guisong Wang,
Yucheng Liu,
Rui Chen and
Wu Li
School of Materials Science and Chemical Engineering, Anhui Jianzhu University, 292 Ziyun Road, Hefei, Anhui 230601, People's Republic of China. E-mail: wenzongxu@ahjzu.edu.cn; Fax: +86-0551-63828157; Tel: +86-0551-63828157
First published on 11th January 2018
Abstract
A material (ZIF-8@SiO2) with a nuclear shell structure was synthesized to improve the flame retardancy and smoke suppression of epoxy resin (EP) through a synergetic catalytic effect. Zeolitic imidazolate framework-8 (ZIF-8) was synthesized and its surface was coated with SiO2 by hydrolyzing tetraethyl orthosilicate. Core–shell structured ZIF-8@SiO2 was obtained. Then ZIF-8@SiO2 was added to EP to explore its effect of flame retardancy and smoke suppression on the EP composite. The results of a cone calorimeter test showed that the peak heat release rate, total heat release, smoke production rate and total smoke production of the material were decreased by 75.9%, 38.9%, 51.1% and 39.8%, respectively, after 2 wt% ZIF-8@SiO2 was added to EP. Besides, through the analysis of char residue, the mechanism of ZIF-8@SiO2/EP's flame retardancy and smoke suppression was determined to be due to the physical barrier effect of SiO2 and the co-effect of SiO2 and ZnO decomposition by ZIF-8.
1. Introduction
Metal–organic frameworks (MOFs) are porous materials comprising metal ions and organic bridging ligands.1 ZIF-8 is a metal–organic framework material with a rhombic dodecahedral structure and is synthesized in organic solvent with zinc ions and 2-methylimidazolate.2 Because ZIF-8 has a high specific surface area, high thermal stability and unique pore structure, it is widely applied in adsorption, catalysis, separation, gas storage and drug delivery.3–8 Due to the diversity of nanometer ZIF-8 materials, their new functions are being explored. Therefore, the application of ZIF-8 as a flame retardant has also attracted attention. For instance, Shi et al.9 prepared ZIF-8/PLA composite materials, and their research indicated that the oxygen index of the composite could reach 26.0% when 3 wt% ZIF-8 was added. The application of ZIF-8 as a new flame retardant is worthy of further exploration.In recent years, the application of silicon-containing compounds in flame retardants has been investigated by many researchers because they not only improve the flame retardant performance, but also form environment-friendly flame retardants.10 The combustion of silicon-containing polymer composites may produce SiO2 which is easy to migrate and accumulate to the polymer surface, and generate Si–O–Si networks inside the char layer structure and ceramic-like protective material on the substrate surface to prevent the polymer's further burning and protect internal polymer. In addition, some compounds containing Si–C structure are also produced, which enhance the thermal stability of composite materials and increase the strength of the char layer.11–13 Meanwhile, SiO2 decomposed by silicon-containing compounds is a solid acid with more acidic sites, which can catalyze the degradation of polymers and have a good co-effect of flame retardancy with metal oxides.14 According to existing literature,15 the use of SiO2 coated brucite as a flame retardant has a better effect of flame retardancy compared with the simple physical mixing of SiO2 and brucite. Jiang et al.16 prepared m-SiO2@Co–Al LDH to study its effect on EP's flame retardancy performance, and their results showed that the thermal stability and flame retardancy performance of EP composites were significantly improved. Therefore, according to the above, it is assumed that polymer may have a better flame retardancy and smoke suppression effect by adopting the core–shell structure of ZIF-8@SiO2.
EP is widely used in coating, adhesives, laminated materials, electronics, etc.17–20 because cured epoxy resin has good physical and chemical properties. However, the flammability of epoxy resin has limited the further development of its application. The flame retardant of a single component does not achieve the ideal effect of flame retardancy. In addition, as far as we know, there has been no report about the application of ZIF-8@SiO2 for the flame retardancy of EP.
This paper presents our study on ZIF-8@SiO2. ZIF-8 nanoparticles were first synthesized at room temperature. SiO2 was then coated on the surface of ZIF-8 by the sol–gel method. The core–shell structure of ZIF-8@SiO2 was duly prepared. The structure and surface microtopography were characterized and analysed. Finally, ZIF-8@SiO2 was added to EP to study its effect of flame retardancy and smoke suppression on EP and the mechanism of its action. Scheme S1† presents the process of sample preparation.
2. Experimental
2.1 Materials
2-Methylimidazolate, Zn(NO3)2·6H2O, absolute methanol, absolute ethanol, tetraethyl orthosilicate (TEOS), ammonium hydroxide and cetyltrimethyl ammonium bromide (TEOS) were purchased from Sinopharm Chemical Reagent Co. Ltd. E-44 epoxy resin was obtained from Changzhou Lebang Composite Materials Corporation. 3,3′-Dichloro-4,4′-diaminodiphenylmethane (MOCA) was obtained from Guangzhou Fufei Chemical Corporation. Deionized water was produced at our laboratory.2.2 Synthesis of SiO2 nanoparticles
SiO2 nanoparticles were synthesized as in ref. 21. In brief, firstly, 4.5 ml TEOS and 4.5 ml ethanol were mixed, and then 9 ml NH3·H2O and 16.3 ml ethanol were added to the above solution and stirred for 1 h at room temperature. After that, the suspension was obtained. Finally, the suspension was centrifuged and washed with deionized water and ethanol (1![[thin space (1/6-em)]](https://www.rsc.org/images/entities/char_2009.gif) :
:![[thin space (1/6-em)]](https://www.rsc.org/images/entities/char_2009.gif) 1) mixture for three times and vacuum freeze dried. SiO2 nanoparticles were obtained as a result.
1) mixture for three times and vacuum freeze dried. SiO2 nanoparticles were obtained as a result.
2.3 Synthesis of ZIF-8 nanocrystals
ZIF-8 nanocrystals were synthesized by means of co-precipitation.22 In short, firstly, 2.933 g Zn(NO3)2·6H2O was dissolved in 200 ml methanol and recorded as solution A. 6.489 g 2-methylimidazole was dissolved in 200 ml methanol, and recorded as solution B. Then, the suspension was obtained by mixing solution A and solution B, with magnetic stirring for 1 h at room temperature. Finally, the suspension was centrifuged and washed with methanol for three times and dried under vacuum conditions at 40 °C. ZIF-8 nanocrystals were thus obtained.2.4 Synthesis of core–shell structure of ZIF-8@SiO2
Firstly, 1.0 g CTAB was dissolved in 80 ml ethanol. Then 0.8 g ZIF-8 was added to it, whose PH was adjusted to 11 with NH3·H2O, and the suspension was treated by ultrasonic dispersing technology for 5–10 min. After that, the mixed solution of 4 ml TEOS and 16 ml ethanol was added into the suspension drop by drop and reacted for 18 h at room temperature. Finally, the product was centrifuged and washed with a mixture of ethanol and deionized water (1![[thin space (1/6-em)]](https://www.rsc.org/images/entities/char_2009.gif) :
:![[thin space (1/6-em)]](https://www.rsc.org/images/entities/char_2009.gif) 1) several times and vacuum freeze dried. In the end, core–shell structure of ZIF-8@SiO2 was obtained.
1) several times and vacuum freeze dried. In the end, core–shell structure of ZIF-8@SiO2 was obtained.
2.5 Preparation of EP composite
First, ZIF-8@SiO2 was evenly distributed in a proper amount of acetone solution, and it was added to epoxy resin under ultrasonication. It was treated with ultrasonication and strong stirring simultaneously until the formation of a homogeneous mixture under 60 °C. Then the molten MOCA was added to the mixture with full stirring to spread evenly, and poured into polytetrafluoroethylene molds to cure at 120 °C for 2 h and at 150 °C for 1 h, respectively. The EP composite was obtained after cooling. SiO2 and ZIF-8 were also mixed with epoxy resin under the same conditions (the specific formula for the experiment is shown in Table 1).| Sample | EP (wt%) | SiO2 (wt%) | ZIF-8 (wt%) | ZIF-8@SiO2 (wt%) |
|---|---|---|---|---|
| EP | 100 | 0 | 0 | 0 |
| SEP | 98 | 2 | 0 | 0 |
| ZEP | 98 | 0 | 2 | 0 |
| ZSEP | 98 | 0 | 0 | 2 |
2.6 Characterization
X-ray diffraction (XRD) patterns were obtained with a D8X diffractometer (Bruker/AXS Company, Germany) at a scanning speed of 2° min−1 and a measurement range of 2θ from 6° to 60°. Fourier transform infrared (FTIR) spectra were obtained with a Nicolet 6700 FTIR spectrophotometer (USA) at a test range of 400–4000 cm−1 by the KBr pellet technique. Scanning electron microscopy (SEM) and energy dispersive X-ray spectroscopy (EDS) were carried out using a XL-30 scanning electron microscope (Dutch Philips Company). Transmission electron microscopy (TEM) tests were performed to use a JEM-2100 transmission electron microscope (Japan) through direct observation to observe surface the microtopography and size of samples. Before measurement, all the samples were dispersed in ethanol with ultrasonication for a while. Thermogravimetric analysis (TGA) was performed with a German Netzsch 209 F3 thermal analyzer. The samples underwent heating from room temperature to 750 °C under air atmosphere at a heating rate of 20 °C min−1. Differential Scanning Calorimetry (DSC) was taken with a TA Q20 (USA). The samples were treated under nitrogen atmosphere at a heating rate of 10 °C min−1. Laser Raman Spectroscopy (LRS) was conducted with a LabRam HR spectrometer (JY, France). X-ray photoelectron spectroscopy (XPS) was determined by an AXIS Ultra XPS spectrometer (Kratos, UK) using Al Kα excitation radiation at the power of 225 W (working voltage: 15 kV; transmitting current: 15 mA). The UL-94 burning test was taken with a UL-94 SCZ-3 (China), the samples size was 125 × 13 × 3 mm3. The limit oxygen index (LOI) was obtained with an HC-2 oxygen index meter (Jiangning Analytical Instrument Company, China). The samples size of the test was 100 × 10 × 3 mm3. The JCZ-2 type cone calorimeter was similar to the one for the LOI in accordance with ISO 5660. The samples size was 100 × 100 × 3 mm3, and the heat flux used was 50 kW m−2.3. Results and discussion
3.1 Characterization of SiO2, ZIF-8 and ZIF-8@SiO2
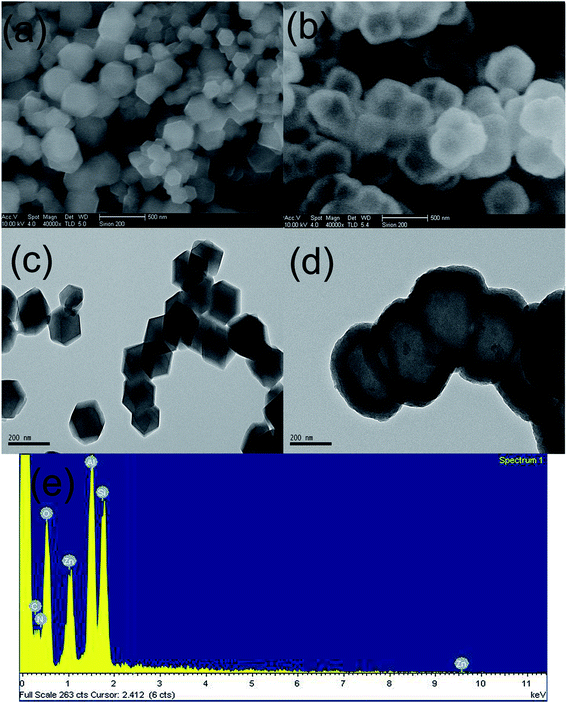 | ||
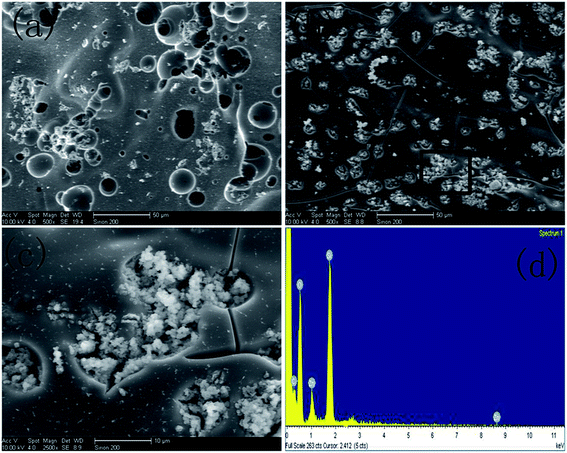
| Fig. 1 SEM images of (a) ZIF-8 and (b) ZIF-8@SiO2, TEM images of (c) ZIF-8 and (d) ZIF-8@SiO2, (e) EDS spectrum of ZIF-8@SiO2. | ||
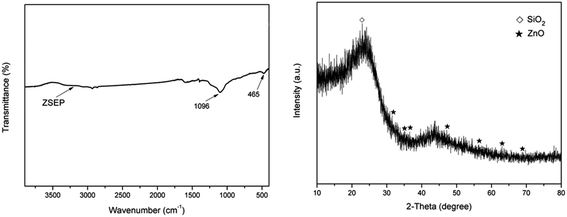
In order to further demonstrate that ZIF-8 is coated with SiO2 successfully and to more directly observe the structure and morphology of ZIF-8 and ZIF-8@SiO2, ZIF-8 and ZIF-8@SiO2 are analyzed by TEM. Fig. 1(c) and (d) are the TEM images of ZIF-8 and ZIF-8@SiO2, respectively. The rhombic dodecahedral structure of ZIF-8 crystal can be seen more clearly from Fig. 1(c) and the crystal size is the same as in Fig. 1(a) of ZIF-8. It is more intuitive to see the core–shell structure of ZIF-8@SiO2 and the surface of ZIF-8 form a layer of SiO2 shell. In addition, the crystal structure of ZIF-8 is not destroyed by the overlaying of SiO2. The presence of element peaks of C, N, O, Zn and Si can be seen in the EDS of Fig. 1(e) of ZIF-8@SiO2, which further demonstrates the successful preparation of the ZIF-8@SiO2 core–shell structure nanocrystal. This is consistent with the previous analysis of XRD and FTIR.
3.2 Characterization of EP and EP composites
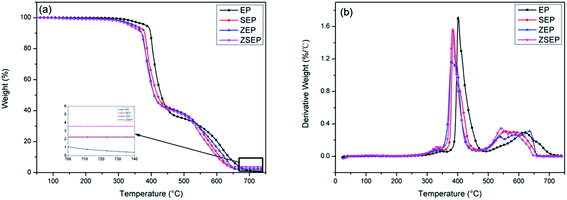
| Sample | T10% (°C) | T50% (°C) | Tmax (°C) | Char yield (%) |
|---|---|---|---|---|
| EP | 397.5 | 430.2 | 402.2 | 0.4 |
| SEP | 380.2 | 418.9 | 385.6 | 2.3 |
| ZEP | 370.4 | 408.3 | 380.5 | 2.2 |
| ZSEP | 371.5 | 409.4 | 383.2 | 3.6 |
It can be seen from the char residue of the TG test that the char residue of pure EP is only 0.4% at 750 °C. Compared with that of EP, the char residue of all the composites are improved to some extent, as shown in Table 2. Among them, ZSEP has the highest rate of char residue, reaching 3.6%. This is because SiO2 can not only play the role as a physical barrier, but can also play a role in strengthening the catalytic activity of metal oxides, which further promotes the formation of a char layer.14
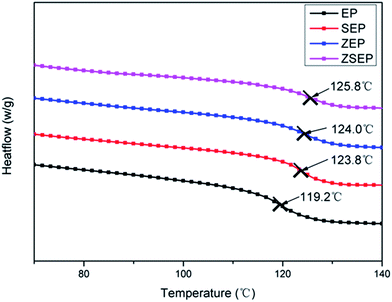
It is well known that the glass transition temperature (Tg) is an important thermal parameter for studying the motion of polymer segments. The effects of SiO2, ZIF-8 and ZIF-8@SiO2 on the Tg of EP are investigated by DSC. Fig. 3 shows the DSC curves for neat EP and EP composites. When SiO2, ZIF-8 and ZIF-8@SiO2 are added to EP, the Tg of the composites is increased by 4–6 °C. However, the change in the Tg is not significant by comparisons between the composites. When 2 wt% ZIF-8@SiO2 is added to EP, the Tg of EP is increased from 119.2 °C to 125.8 °C. This is due to the interfacial interaction between ZIF-8@SiO2 and EP, so ZIF-8@SiO2 as a physical barrier, hinders the chain motion of the polymer.
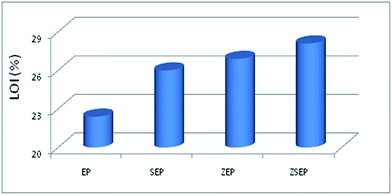
| Sample | PHRR (kW m−2) | THR (MJ m−2) | SPR (m2 s−1) | TSP (m2) | LOI (%) |
| EP | 1054 | 39.1 | 0.88 | 67.8 | 22.4 |
| SEP | 727 | 34.4 | 0.63 | 61.9 | 26.0 |
| ZEP | 431 | 25.3 | 0.69 | 52.2 | 26.9 |
| ZSEP | 254 | 23.9 | 0.43 | 40.8 | 28.1 |
At the same time, EP and EP composites are measured by UL-94 vertical combustion. The results show that SEP and ZEP have no level. However, ZSEP with 2 wt% ZIF-8@SiO2 added can reach the V-1 level. Fig. 5 shows the images of EP and ZSEP during the combustion process. All those indicate that ZIF-8@SiO2 has better flame retardancy.
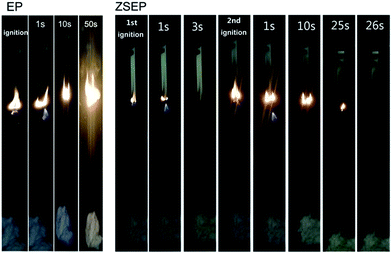 | ||
| Fig. 5 Combustion processes of neat EP and ZSEP during the UL-94 vertical burning test at different times. | ||
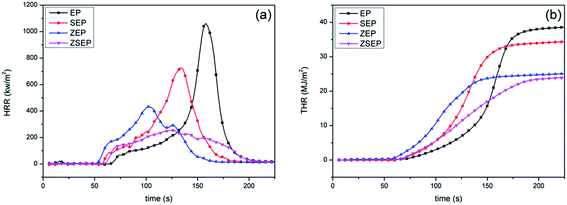
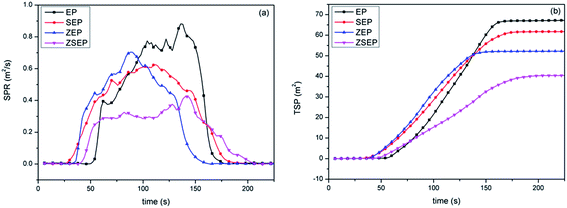
The cone calorimeter may make one of the most ideal experimental tests used to characterize the combustion performance of materials. In order to study the actual combustion of EP and EP composites, the samples are measured by cone calorimeter. The combustion curves and specific data are shown in Fig. 6 and Table 3. In Fig. 6(a), the peak heat release rate (PHRR) can reach 1054 kW m−2 when pure EP is burned, indicating that EP is easy to burn when there is a heat source. Compared to that of EP, the PHRR of SEP is decreased by 31.0%. This is mainly because SiO2 is easy to migrate to the surface of a polymer during the combustion process, and acts as a physical barrier to isolate oxygen and suppress the volatilization of the combustible gases produced by the polymer during combustion, thereby reducing the heat release rate. Compared to that of EP, the PHRR of ZEP is decreased by 59.1%. This is mainly because ZIF-8 is a N-containing material, and N-containing materials in the combustion process may release NH3 and N2 which will dilute the oxygen and the concentration of combustible gas, so as to achieve the purpose of flame retardancy.9 At the same time, ZIF-8 will form a metal oxide during the combustion process and can catalyze the polymer cross-linked into carbon, so that the stability of the char layer has a better barrier effect,32 and achieve better flame retardancy. It is worth noting that compared with that of EP, the PHRR of ZSEP decreases by 75.9%.
From Fig. 6(b), the total heat release (THR) of neat EP is 39.1 MJ m−2. The THR of all EP composites is decreased in different degrees in comparison with that of neat EP, and the THR of SEP, ZEP and ZSEP decrease by 12.0%, 35.3% and 38.9%, respectively. Among them, the THR of ZSEP is decreased most obviously. This is because, in the process of combustion, the generation of SiO2 can enhance the catalytic effect of metal oxide decomposed by ZIF-8, which can effectively promote the formation of decomposition products of the polymer into char, forming a better char layer to isolate heat and oxygen delivery, prevent the further combustion of the polymer matrix, and effectively improve the flame retardancy of the composites.
From the TSP curves in Fig. 7(b), it can be seen that the TSP of pure EP can reach 67.8 m2. Compared with that of neat EP, the TSP of SEP, ZEP and ZSEP are decreased by 8.7%, 23.0% and 39.8%, respectively. Obviously, the TSP of ZSEP falls the most. This is because ZSEP could generate SiO2 and metal oxides during the combustion process, SiO2 covers the surface of the polymer matrix and plays a role of a physical barrier. At the same time, metal oxide's catalytic activity will be further enhanced in the presence of SiO2, and promote the formation of char residue which may form a denser char layer that inhibits the decomposition of the polymer and reduces the amount of smoke released, resulting in a better smoke suppression effect.
3.3 Char residue analysis
![[double bond, length as m-dash]](https://www.rsc.org/images/entities/char_e001.gif) O represent the C atom of the aliphatic and aromatic structures, the C atom of the hydroxyl group or the ether bond and the C atom of the carbonyl group, respectively. The peaks at 284.7 eV, 285.9 eV and 288.2 are ascribed to C–C, C–O and C
O represent the C atom of the aliphatic and aromatic structures, the C atom of the hydroxyl group or the ether bond and the C atom of the carbonyl group, respectively. The peaks at 284.7 eV, 285.9 eV and 288.2 are ascribed to C–C, C–O and C![[double bond, length as m-dash]](https://www.rsc.org/images/entities/char_e001.gif) O, respectively. The calculated values for Cox/Ca in Table 4 are used to study the thermal oxidation resistance of char. And the content of the oxidized carbon atoms (C–O, C
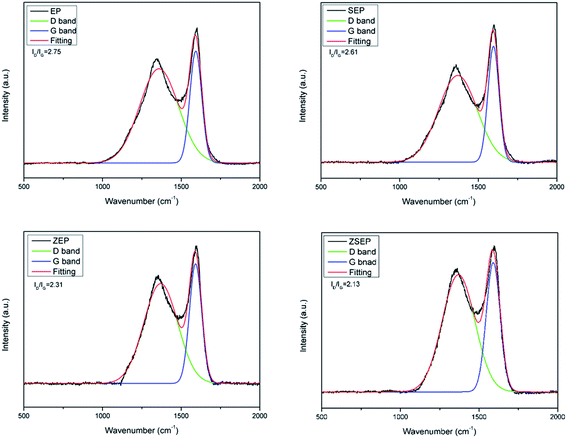
O, respectively. The calculated values for Cox/Ca in Table 4 are used to study the thermal oxidation resistance of char. And the content of the oxidized carbon atoms (C–O, C![[double bond, length as m-dash]](https://www.rsc.org/images/entities/char_e001.gif) O) is represented by Cox, and Ca is used to represent the content of non-oxidized carbon atoms (C–C, C–H). The smaller the value of Cox/Ca, the higher the thermal oxidation resistance of the material which is easy to form a char layer during combustion.36 In Table 4, it can be seen that the values of Cox/Ca for EP, SEP, ZEP and ZSEP are 0.69, 0.54, 0.34 and 0.29, respectively. Compared with that of neat EP, the values of Cox/Ca of all the EP composites are decreased in different degrees, but it is worth noting that of ZSEP is reduced by 58.0%. This is because the formation of a dense char layer on the surface of polymer prevents the contact of the internal material with outside oxygen during the combustion of ZSEP, which effectively reduces the degree of oxidation of the internal material. In addition, Si and Zn are combined with more oxygen atoms to facilitate the formation of a stable char layer. The O1s and Si2p spectra of ZSEP char residue are shown in Fig. 9(e) and (f), respectively. In the O1s spectrum, the peaks at 530.2 eV, 531.7 eV and 533 eV represent the peaks of Zn–O, Si–O–Si and C–O–C, respectively.9,37 And for the Si2p spectrum, the peaks at 101.8 eV and 102.5 eV belong to O–Si–C and Si–O bonds.38,39 This indicates that Si elements migrate to the surface of the polymer matrix to form Si–O–Si structure of the char layer to protect the internal polymer of ZSEP in the combustion process. In addition, the formation of compounds which contain O–Si–C bond is also beneficial to increasing the thermal stability and strength of the char layer. The appearance of Zn–O bond indicates that the char residue may contain zinc oxide. In a previous study,14 SiO2 not only catalyzed the degradation of polymers, but also more efficiently catalyzed the degradation of the polymer into char when metal oxides were present, contributing to the formation of a dense char layer. Therefore, the synergistic effect of SiO2 and ZnO is helpful in improving the flame retardancy and smoke suppression properties of the polymer.
O) is represented by Cox, and Ca is used to represent the content of non-oxidized carbon atoms (C–C, C–H). The smaller the value of Cox/Ca, the higher the thermal oxidation resistance of the material which is easy to form a char layer during combustion.36 In Table 4, it can be seen that the values of Cox/Ca for EP, SEP, ZEP and ZSEP are 0.69, 0.54, 0.34 and 0.29, respectively. Compared with that of neat EP, the values of Cox/Ca of all the EP composites are decreased in different degrees, but it is worth noting that of ZSEP is reduced by 58.0%. This is because the formation of a dense char layer on the surface of polymer prevents the contact of the internal material with outside oxygen during the combustion of ZSEP, which effectively reduces the degree of oxidation of the internal material. In addition, Si and Zn are combined with more oxygen atoms to facilitate the formation of a stable char layer. The O1s and Si2p spectra of ZSEP char residue are shown in Fig. 9(e) and (f), respectively. In the O1s spectrum, the peaks at 530.2 eV, 531.7 eV and 533 eV represent the peaks of Zn–O, Si–O–Si and C–O–C, respectively.9,37 And for the Si2p spectrum, the peaks at 101.8 eV and 102.5 eV belong to O–Si–C and Si–O bonds.38,39 This indicates that Si elements migrate to the surface of the polymer matrix to form Si–O–Si structure of the char layer to protect the internal polymer of ZSEP in the combustion process. In addition, the formation of compounds which contain O–Si–C bond is also beneficial to increasing the thermal stability and strength of the char layer. The appearance of Zn–O bond indicates that the char residue may contain zinc oxide. In a previous study,14 SiO2 not only catalyzed the degradation of polymers, but also more efficiently catalyzed the degradation of the polymer into char when metal oxides were present, contributing to the formation of a dense char layer. Therefore, the synergistic effect of SiO2 and ZnO is helpful in improving the flame retardancy and smoke suppression properties of the polymer.
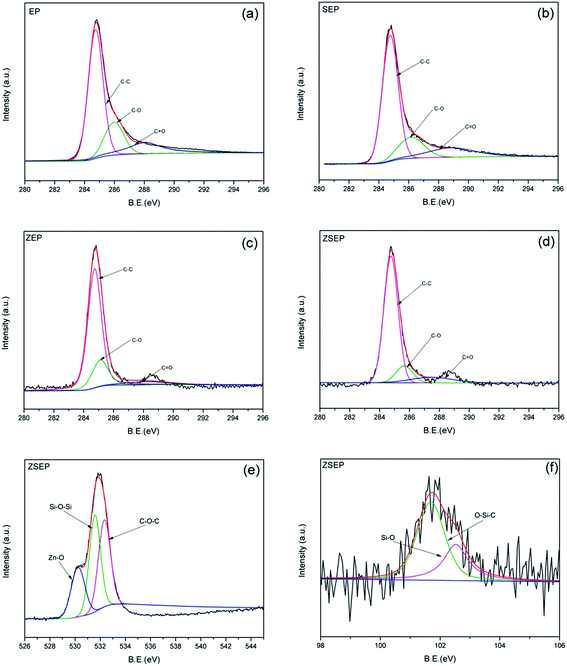 | ||
| Fig. 9 C1s spectra of char residue of EP and EP composites: EP (a), SEP (b), ZEP (c) and ZSEP (d), O1s spectrum of ZSEP (e), Si2p spectrum of ZSEP (f). | ||
| Sample | C–C area (%) | C–O area (%) | C![[double bond, length as m-dash]](https://www.rsc.org/images/entities/char_e001.gif) O area (%) O area (%) |
Cox/Ca |
|---|---|---|---|---|
| EP | 59.3 | 21.7 | 19 | 0.69 |
| SEP | 65.1 | 17.8 | 17.1 | 0.54 |
| ZEP | 74.9 | 19.8 | 5.3 | 0.34 |
| ZSEP | 77.6 | 12.4 | 10.0 | 0.29 |
3.4 Mechanism of flame retardancy and smoke suppression
Based on the above research, the mechanism of ZIF-8@SiO2 to improve the flame retardancy and smoke suppression of the EP composite materials is briefly described as follows. There are three main reasons for the improvement of flame retardancy and smoke suppression performance of the EP composites. Firstly, ZSEP could produce SiO2 during the combustion process, which migrates to the surface of the polymer matrix to form a covering layer, accompanied by the formation of compounds that contain Si–O–Si and O–Si–C structures, which act as a physical barrier to the polymer matrix, protect the internal material and improve its thermal stability. Secondly, ZIF-8 as an N-containing material may release NH3 and N2 during the combustion process, and NH3 and N2 dilute oxygen and the concentration of combustible gas decomposed by EP, so as to achieve a flame retardant effect. In addition, the decomposition of ZIF-8 produces ZnO, which promotes the formation of a char layer. Finally, SiO2 is a solid acid with more acidic active sites which promote carbonization by synergistic catalysis with metal oxide, and thus improve the density of the char layer and further improve the flame retardancy and smoke suppression performance of the composite.4. Conclusions
In this study, a novel material with a core–shell structure of ZIF-8@SiO2 was synthesized by the sol–gel method. The structure, morphology and composition of ZIF-8@SiO2 were characterized by XRD, FT-IR, SEM-EDS, TEM and XPS. Results showed that the ZIF-8@SiO2 core–shell structured material was successfully synthesized. 2 wt% ZIF-8@SiO2 was added into EP to study its thermal stability, flame retardancy and smoke suppression. The results showed that the addition of ZIF-8@SiO2 to EP could significantly improve the char yield. Moreover, the value of LOI reached 28.1% and the UL-94 vertical combustion reached the V-1 level. At the same time, the PHRR, THR, SPR and TSP decreased by 75.9%, 38.9%, 51.1% and 39.8%, respectively. The analysis of char residue led to a better understanding of the mechanism of flame retardancy and smoke suppression as a result of the physical barrier of SiO2, the gas phase flame retardancy of inert gas decomposed by ZIF-8 and the synergistic effect of SiO2 and ZnO that jointly enhanced the flame retardancy and smoke suppression performance of the EP composite.Conflicts of interest
There are no conflicts to declare.Acknowledgements
The authors are grateful to the Anhui Provincial Natural Science Foundation (1708085ME113) and National Key Technology R&D Program (2013BAJ01B05) for their financial support.References
- Z. Shi, C. Xu, F. Chen, Y. Wang, Q. Meng and R. Zhang, RSC Adv., 2017, 7, 49947–49952 RSC.
- A. Schejn, T. Mazet, V. Falk, L. Balan, L. Aranda, G. Medjahdi and R. Schneider, Dalton Trans., 2015, 44, 10136–10140 RSC.
- J. B. James and Y. S. Lin, J. Phys. Chem. C, 2016, 120, 14015–14026 CAS.
- A. M. Sheveleva, A. V. Anikeenko, A. S. Poryvaev, D. L. Kuzmina, I. K. Shundrina, D. I. Kolokolov, A. G. Stepanov and M. V. Fedin, J. Phys. Chem. C, 2017, 121, 19880–199886 CAS.
- Q. Liu, B. Zhou, M. Xu and G. Mao, RSC Adv., 2017, 7, 8004–8010 RSC.
- P. Krokidas, M. Castier and I. G. Economou, J. Phys. Chem. C, 2017, 121, 17999–18011 CAS.
- L. Mu, B. Liu, H. Liu, Y. T. Yang, C. Y. Sun and G. J. Chen, J. Mater. Chem., 2012, 22, 12246–12252 RSC.
- E. Shearier, P. Cheng, J. Bao, Y. H. Hu and F. Zhao, RSC Adv., 2016, 6, 4128–4135 RSC.
- X. Shi, X. Dai, Y. Cao, J. Li, C. Huo and X. Wang, Ind. Eng. Chem. Res., 2017, 56, 3887–3894 CrossRef CAS.
- H. Gu, J. Guo, Q. He, S. Tadakamalla, X. Zhang, X. Yan, Y. Huang, H. A. Colorando, S. Wei and Z. Guo, Ind. Eng. Chem. Res., 2013, 52, 7718–7728 CrossRef CAS.
- X. Chen, Y. Hu and L. Song, Polym. Eng. Sci., 2008, 48, 116–123 CAS.
- J. Ni, L. Chen, K. Zhao, Y. Hu and L. Song, Polym. Adv. Technol., 2011, 22, 1824–1831 CrossRef CAS.
- Q. Li, P. Jiang and P. Wei, J. Polym. Sci., Part B: Polym. Phys., 2010, 43, 2548–2556 CrossRef.
- S. Qiu, W. Xing, X. Feng, B. Yu, X. Mu, R. K. K. Yuen and Y. Hu, Chem. Eng. J., 2016, 309, 802–814 CrossRef.
- H. Pang, X. Wang, X. Zhu, P. Tian and G. Ning, Polym. Degrad. Stab., 2015, 120, 410–418 CrossRef CAS.
- S. D. Jiang, Z. M. Bai, G. Tang, L. Song, A. A. Stec, R. Hull, Y. Hu and W. Z. Hu, ACS Appl. Mater. Interfaces, 2014, 6, 14076–14086 CAS.
- M. Martí, L. Molina, C. Alemán and E. Armelin, ACS Sustainable Chem. Eng., 2013, 1, 1609–1618 CrossRef.
- Z. Ahmad, M. P. Ansell and D. Smedley, Int. J. Adhes. Adhes., 2010, 30, 448–455 CrossRef CAS.
- Y. Gu, M. Li, Z. Zhang and Z. Sun, J. Compos. Mater., 2006, 40, 2257–2277 CrossRef CAS.
- C. Ma, B. Yu, N. Hong, Y. Pan, W. Hu and Y. Hu, Ind. Eng. Chem. Res., 2016, 55, 10868–10879 CrossRef CAS.
- L. Lin, T. Zhang, X. Zhang, H. Liu, K. L. Yeung and J. Qiu, Ind. Eng. Chem. Res., 2014, 53, 10906–10913 CrossRef CAS.
- C. Wu, Q. Liu, R. Chen, J. Liu, H. Zhang and R. Li, ACS Appl. Mater. Interfaces, 2017, 9, 11106–11115 CAS.
- G. Fang, H. Li, Z. Chen and X. Liu, Sol. Energy Mater. Sol. Cells, 2011, 95, 1875–1881 CrossRef CAS.
- M. Isanejad, M. Arzani, H. R. Mahdavi and T. Mohammadi, J. Mol. Liq., 2017, 225, 800–809 CrossRef CAS.
- L. He, L. Li, L. Zhang, S. Xing, T. Wang, G. Li, X. Wu, Z. Su and C. Wang, CrystEngComm, 2014, 16, 6534–6537 RSC.
- J. Hukkamäki and T. T. Pakkanen, Microporous Mesoporous Mater., 2003, 65, 189–196 CrossRef.
- J. Y. Shi, Q. Z. Yao, X. M. Li, G. T. Zhou and S. Q. Fu, PLoS One, 2013, 8, e61164 CAS.
- X. Hu, X. Yan, M. Zhou and S. Komarneni, Microporous Mesoporous Mater., 2016, 219, 311–316 CrossRef CAS.
- A. Schejn, L. Balan, V. Falk, L. Aranda, G. Medjahdi and R. Schneider, CrystEngComm, 2014, 16, 4493–4500 RSC.
- K. Tsutsumi, N. Kurata, E. Takata, K. Furuichi, M. Nagano and K. Tabata, Appl. Catal., B, 2014, 147, 1009–1014 CrossRef CAS.
- D. Y. Wang, A. Das, F. R. Costa, A. Leuteritz, Y. Z. Wang, U. Wagenknecht and G. Heinrich, Langmuir, 2010, 26, 14162–14169 CrossRef CAS PubMed.
- O. Terakado, R. Ohhashi and M. Hirasawa, J. Anal. Appl. Pyrolysis, 2013, 103, 216–221 CrossRef CAS.
- S. Xu, L. Zhang, Y. Lin, R. Li and F. Zhang, J. Phys. Chem. Solids, 2012, 73, 1514–1517 CrossRef CAS.
- W. Xu, B. Xu, A. Li, X. Wang and G. Wang, Ind. Eng. Chem. Res., 2016, 55, 11175–11185 CrossRef CAS.
- W. Xu, B. Zhang, B. Xu and A. Li, Composites, Part A, 2016, 91, 30–40 CrossRef CAS.
- X. Wang, L. Song, H. Yang, W. Xing, B. Kandola and Y. Hu, J. Mater. Chem., 2012, 22, 22037–22043 RSC.
- Y. Qian, P. Wei, P. Jiang, J. Hao and J. Du, Composites, Part B, 2013, 45, 1541–1547 CrossRef CAS.
- Y. Narita, T. Inubushi, K. Yasui and T. Akahane, Appl. Surf. Sci., 2003, 212, 730–734 CrossRef.
- B. P. Swain, Surf. Coat. Technol., 2006, 201, 1589–1593 CrossRef CAS.
- B. Jabeen and U. Rafique, Environ. Eng. Res., 2014, 19, 205–214 CrossRef.
- P. Bazant, I. Kuritka, L. Munster and L. Kalina, Cellulose, 2015, 22, 1275–1293 CrossRef CAS.
Footnote |
| † Electronic supplementary information (ESI) available. See DOI: 10.1039/c7ra12816a |
| This journal is © The Royal Society of Chemistry 2018 |

