 Open Access Article
Redox effects and formation of gold nanoparticles for the nucleation of low thermal expansion phases from BaO/SrO/ZnO/SiO2 glasses
Michael Kracker *a,
Christian Thieme
 b,
Katrin Thiemea,
Christian Patzig
 b,
Lutz Bertholdb,
Thomas Höcheb and
Christian Rüssela
aOtto-Schott-Institut für Materialforschung, Jena University, Fraunhoferstr. 6, 07743 Jena, Germany. E-mail: Kracker.Michael@googlemail.com; Fax: +49 3641 948 500; Tel: +49 3641 948 507
bFraunhofer-Institut für Mikrostruktur von Werkstoffen und Systemen IMWS, Walter-Hülse-Straße 1, 06120 Halle (Saale), Germany
First published on 7th February 2018
Abstract
Glasses in the system BaO/SrO/ZnO/SiO2 containing 0.01 and 0.1 mol% gold were used to study the formation of gold nanoparticles with the aim to use them as nucleation agents. In order to promote gold clustering, the glasses were additionally doped with 0.5 mol% Sb2O3. Depending on the heat treatment schedule, Au particle sizes were in the range from 6 to above 50 nm. In contrast to many other gold ruby glass systems, the clustering is completely prevented by the absence of antimony; then the glasses remain colorless. Surprisingly, at higher temperatures, a re-dissolution of gold clusters was also observed, which now allows the formulation of a more comprehensive model concerning the redox and clustering behavior. This growth model is completed by the fact that a high gold concentration enables the stabilization of much smaller Au clusters. Mie theory with the aid of quantum confined size-dependent dielectric functions was successfully used to describe the optical behavior of the gold nanoparticles also for sizes below 10 nm. These results were confirmed using high resolution scanning transmission electron microscopy, including energy dispersive X-ray spectroscopy. It could also be shown that small gold particles up to a size of 50 nm are not effective as nucleating agents.
1. Introduction
The history of ruby-glass has been documented for several centuries and the origin of the red colorization is due to the special optical properties of small metal nanoparticles. Mostly ruby glasses are used as decorative materials rather than in technical applications. However, if these particles are formed in a glass, which tends to crystallize, then the importance of nanoparticles goes beyond their optical properties. In order to obtain the controlled volume crystallization of a bulk glass, in many cases the addition or formation of appropriate nucleating agents is necessary. Furthermore, the optical properties of small Au particles provide perfect access to the processes and evolution of the particles as well as the glass structure during a further heat treatment.Since Stookey has described the basic principles of modern glass ceramics,1 small metallic nanoparticles are discussed as potential nucleation agents.2,3 But a uniform proof is not given to the best of our knowledge. Not solely the amount of the added metal or the pretreatment is crucial for the suitability as a nucleating agent, rather interplay between temperature and size evolution of the particles near the crystallization temperature should be the focus. The required redox processes within the glass during a heat treatment step can be incredibly complex, and is not fully understood for most systems. Especially the role of other required components, such as antimony or tin must be highlighted concerning the formation of small metal particles inside a glass matrix near to the devitrification temperature. Therefore, a base glass system is required in which no other polyvalent ions are inserted and which does not tend to crystallize in the volume.
Therefore, this work focuses on the system BaO–SrO–ZnO–SiO2, in which a recently described solid-solution phase with the composition Ba1−xSrxZn2Si2O7 and exceptionally low thermal expansion was found.4 This phase can be crystallized in high concentrations from glasses showing wide compositional variations.5 The glasses in this system show predominantly surface crystallization so that up to now only sintered materials based on this system were described in literature to enable the preparation of crack free zero expansion materials.6 Almost all conventional low thermal expansion glass ceramics are based on the Li2O/Al2O3/SiO2 glass system and are produced by volume crystallization of a bulk glass. Hence, also in the new BaO–SrO–ZnO–SiO2 glass system, glasses should crystallize within the bulk and thus, volume nucleation should be triggered by adding appropriate nucleating agents. This has the advantage that large-sized glass ceramics can be produced and no additional milling step is necessary, as required for powder sintering routes.
Bulk crystallization will help to overcome the problems of sintering. As already mentioned, an effective volume nucleation agent is needed and a suitable candidate might be metallic Au if precipitated as small particles all over the glass volume. The low thermal expansion phase might be able to grow on these small Au particles. The preparation of ruby glasses based on the precipitation of such metallic nanoparticles from glasses is known since centuries. Most of such glasses appear colorless after the melting procedure, which is due to the homogeneous dissolution of gold as AuI or metallic Au0 in the glassy network.7 A heat treatment performed slightly below the glass transition temperature of the glass leads to the reddish coloration caused by the precipitation of Au nanoparticles.7 The mechanism of AuI reduction is only possible if a polyvalent constituent, such as antimony, which in glasses might occur as SbIII and SbV is also introduced into the glass network.2 Then the reaction:
| 2AuI + SbIII → 2Au0 + SbV | (1) |
The aim of this work is to precipitate Au nanoparticles in a glass from the system BaO–SrO–ZnO–SiO2 and to study the temperature–time schedules during heat treatment in order to enable a control of the particle size and their evolution up to the crystallization temperature.
The size of the particles is measured using transmission electron microscopy (TEM) and determined from UV-vis-spectra. For the latter, simulated spectra calculated by applying Mie theory were compared. Therefore, at first a glass with an Au concentration typical for gold ruby glasses was prepared and characterized and then a composition with a tenfold higher Au concentration is considered. The results are also compared with a glass, which contains 0.01 mol% of Au and is free of Sb2O3. The effect of the gold particles on the crystallization is reported.
2. Experimental
500 g of glasses with the compositions (in [mol%]) 8BaO·8SrO·34ZnO·(49.5 − x) SiO2·0.5Sb2O3·xAu with x = 0.01 (glass A) and 0.1 (glass B) as well as with an SiO2 concentration of 50 mol% and x = 0.01 but without antimony (glass C) were melted using a batch containing the following raw materials: BaCO3, SrCO3, ZnO, SiO2, Sb2O3. Gold was introduced by dissolving metallic Au in hot aqua regia, which was then dropwise given to the pre-mixed batch. Afterwards, the gold containing batch was dried and carefully homogenized. The glass was subsequently melted in an induction furnace in a temperature range from 1300 to 1350 °C using a Pt crucible and in the case of glass A, the melt shows continuous bubble formation at around 1350 °C, which can be minimized by reducing the temperature to 1300 °C. At the latter temperature, the glass was stirred for 1 h using a Pt stirrer. Afterwards, the glass was cast in a steel mold preheated to 700 °C. Then the glass was transferred into a muffle furnace also preheated to 700 °C, which was switched off in order to allow the glass to cool down slowly.The basic glass properties were determined using dilatometry, differential scanning calorimetry (DSC), pycnometry, as well as the ultrasound technique for the elastic properties. Dilatometry was performed on cylindrically shaped samples using a Netzsch Dil 402 PC equipped with a silica-glass measurement system. A heating rate of 5 K min−1 was applied. DSC was performed with a Linseis DSC Pt-1600 and a heating rate of 10 K min−1. The density was measured using a micromeritics AccuPyc 1330 helium pycnometer. Elastic properties (Young's modulus and Poisson's ratio) were determined by an ultrasound technique, where the velocities of longitudinal and transversal ultrasonic waves inside the glass were measured as described in detail in ref. 9.
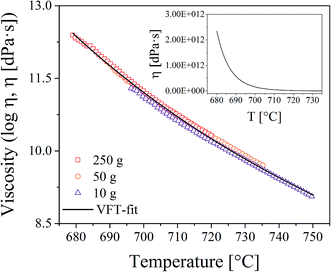
Viscosity measurements were performed with a beam bending viscometer Bähr VIS 401. For this purpose, glass bars with the dimension 3 × 4 × 50 mm3 were heated using a rate of 10 K min−1. In order to increase the temperature range in which viscosity values can be obtained, measurements with different loads (10, 50, and 250 g) were made. The viscosities were fitted using the Vogel–Fulcher–Tammann (VFT) equation.
The formation of metallic Au particles inside the glass volume was characterized by measuring the light transmission using UV-vis-NIR spectroscopy, which was applied to thermally treated glass plates of around 1 mm thickness. Both surfaces were polished before heat treatment. In order to reduce the effect of surface crystallization which can occur during the heat treatment, this surface layer was removed by an additional polishing step. The spectra were recorded with a Shimadzu UV-3102 PC UV-vis-NIR Scanning Spectrophotometer in a wavelength range from 200 to 800 nm with an increment of 0.5 nm and a slit wide of 1 nm.
The refractive indices of the glasses were determined at different wavelengths with a Pulfrich-Refraktometer PR2 equipped with a VoF5 prism using the Fraunhofer lines C, d, e, F, g, and h. The optical dispersion parameters of the glass were calculated using the Wemple equation.10
 | (2) |
 | (3) |
A simulation of the spectra was performed on the basis of Mie theory using the software Mie plot ver. 4.6 by Philip Laven.11 The software is based on the BHMIE algorithm by Bohren and Huffman12 and was used to calculate the optical behavior of Au nanoparticles with different sizes in a surrounding material applying the measured dispersion of the glass as described above.
The required dielectric function of Au with particle sizes larger than 10 nm is based on data provided by Johnson and Christy.13 The simulation for particle diameters below 10 nm can only be performed for certain discrete diameter values of 3.0, 4.1, 5.4, and 7.6 nm because only for these values size dependent dielectric functions have already been published (see ref. 14). The plasmonic resonance wavelengths of the calculated and measured spectra were determined by fitting the peaks with a Gaussian function and locating the center of gravity.
Furthermore, the particle size was directly measured with scanning transmission electron microscopy (STEM), using a cs-aberration corrected FEI TITAN3 80-300 electron microscope and an acceleration voltage of 80 kV. A high-angle annular dark field detector (Fischione Model 3000) was used for scanning TEM, and energy-dispersive X-ray spectroscopy (EDXS) was done with a Super-X EDX detector, equipped with four SDD detectors (FEI company). The TEM sample preparation was done with the mechanical wedge-polishing approach, using a dedicated sample grinding and polishing tool (Multiprep, Allied company), followed by an Ar+ ion broad-beam milling step (precision ion polishing system PIPS, Gatan company).
3. Results
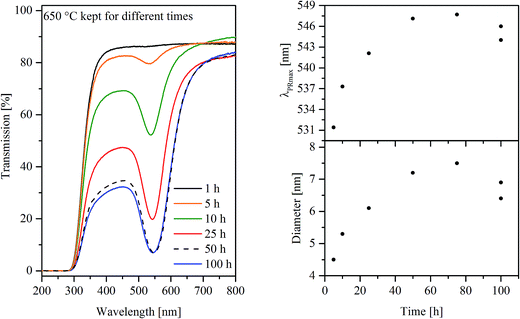
Homogeneous and colorless glasses were obtained after synthesis. The basic properties of glasses A, B, and C are summarized in Table 1. Heat treatments even below the glass transition temperature Tg led to the typical reddish coloration of gold ruby glasses as illustrated in Fig. 1 for a series of samples of glass A, heat treated at 650 °C for different periods of time. Glass B also shows a reddish coloration after heat treatment, whereas glass C (without antimony) remained colorless even after 100 h at 700 °C.| Property | Unit | Method | Value (glass A) | Value (glass B) | Value (glass C) | Measuring error |
|---|---|---|---|---|---|---|
| Tg | °C | Dilatometry | 671 | 667 | 676 | 5 |
| DSC | 660 | 662 | 673 | 5 | ||
| Td | °C | Dilatometry | 713 | 713 | 712 | 5 |
| CTE | 10−6 K−1 | Dilatometry | 7.0 | 7.1 | 7.2 | 0.1 |
| E | GPa | Ultrasound technique | 82.6 | 82.8 | 83.1 | 1.5 |
| ρ | g cm−3 | Pycnometry | 3.859 | 3.840 | 3.831 | 0.001 |
| ν | — | Ultrasound technique | 0.289 | 0.292 | 0.290 | 0.006 |
The coloration is caused by plasmonic resonance of Au nanoparticles, which can also be seen in the UV-vis spectra of glass A in Fig. 2 (left panel), where samples heat treated at 650 °C are shown. With increasing duration of the heat treatment, the transmission at the minimum attributed to the plasmonic resonance decreases which is ascribed to a stronger coloration of the samples. Besides the height of the transmission, the plasmonic resonance primarily characterized by the wavelength at the minimum of transmission (or maximum of absorption) λPRmax, is illustrated as a function of the duration of the heat treatment at 650 °C in the upper right panel of Fig. 2. In the case of glass A, the λPRmax values increase from 531 to 547 nm for samples heat treated for 5 and 75 h, respectively. In order to verify the effect of the furnace and slight compositional differences inside the samples, two specimens were heat treated for 100 h which resulted in λPRmax values of 544 as well as 546 nm. The λPRmax values can be correlated with different particle sizes of the Au particles (see lower right panel in Fig. 2). The calculated diameter increases as a function of the time from 4.5 nm (650 °C, 5 h) to 7.5 nm (650 °C, 75 h). The determination of the Au particle diameters is possible on the basis of the respective λPRmax values correlated with the MIE theory.
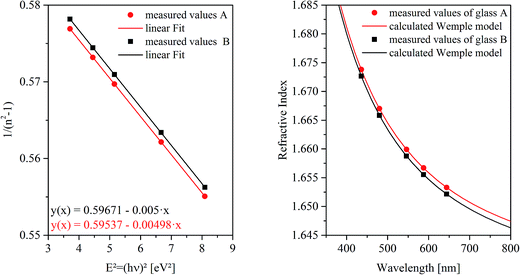
For this purpose, at first the refractive index of the glass has to be measured, which is illustrated for both glass compositions as a function of the wavelength in Fig. 3. The right panel shows the measured refractive indices as a function of the wavelength. At the left side of Fig. 3, 1/(n2 − 1) was plotted against E2 (see eqn (3)). The complex dielectric functions of the metal particles were taken from ref. 13 and are necessary to calculate the spectra for different particle sizes as illustrated in Fig. 4(a). A three-dimensional plot of the simulation results is shown in Fig. 4(b). It can clearly be seen, that with increasing particle size, the resulting Qext maximum (efficiency factor correlates to the plasmonic resonance and represents a superposition of efficiency factors of scattering and absorption) shifts to higher wavelengths and simultaneously, the Qext values increase. In addition, the resonance peak is broadened.
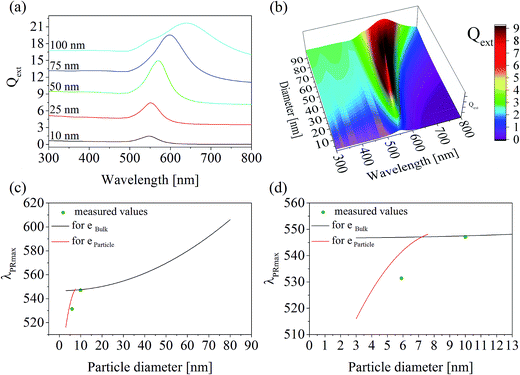 | ||
| Fig. 4 Calculated particle diameters in glass A: (a) calculated spectra of single Au particles with diameters of 10, 25, 50, 75, and 100 nm; (b) three-dimensional plot of the calculated spectra; (c) wavelength of the plasmonic resonance as a function of the particle diameter. The black and red curves represent values calculated by MIE theory on the basis of the bulk and particle complex dielectric function reported in ref. 13 and 14, respectively. The green dots are measured values, where the particle size was determined with TEM and λPRmax was measured with UV-vis-spectroscopy; (d) identical with (b), but with a smaller wavelength as well as particle diameter scale. | ||
In the case of glass A, the correlation between the plasmonic resonance wavelength λPRmax and the corresponding particle diameter is shown with different scales of the x- and y-axes in Fig. 4(c) and (d). The black curve describes the Mie-simulated λPRmax – particle diameter correlation for single particles using the bulk dielectric function according to ref. 13. Below around 10 nm, the complex dielectric function of an Au particle itself changes drastically depending on its size, so that the black curve is not valid anymore. However, the red curve describes the correlation between λPRmax and the particle diameter much more exactly for certain values of 3, 4.1, 5.4, and 7.6 nm (see above), for which a size dependent dielectric function was reported in the literature. Therefore, this curve was calculated once again on the basis of size dependent dielectric functions as listed in ref. 14. The green dots in Fig. 4(c) and (d) are measured values in which the λPRmax values were taken from the respective UV-vis-spectra and the particle size was determined via TEM.
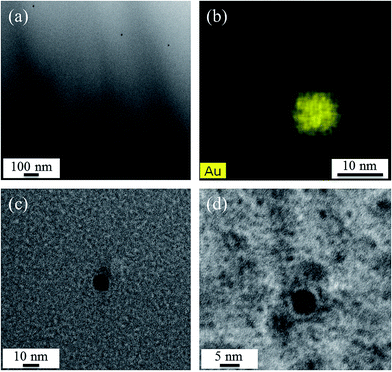
Fig. 5 shows TEM micrographs of sample A. While in Fig. 5(a), at rather low magnification, a number of nanoscaled particles is visible within the glass matrix, the STEM-EDX element distribution map of Au in Fig. 5(b) shows that the observed particles consist of Au. The particles shown in Fig. 5(c) and (d) have diameters of around 10.7 and 5.9 nm, respectively.
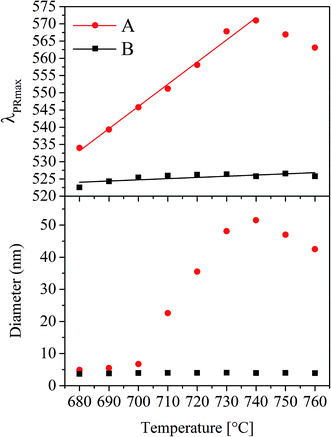
Particle diameters were not only measured as a function of time (as already presented for 650 °C in Fig. 2) but also at different temperatures kept for a constant time (1 h) using UV-vis-spectroscopy. In Fig. 6 for the glasses A and B, λPRmax as well as the Au particle diameters are illustrated as a function of the temperature. In the case of glass A, the plasmonic resonance shows a linear shift from 534 to 571 nm while increasing the temperature of thermal treatment from 680 to 740 °C. At higher temperatures, slight crystallization at the surface occurred. This linear shift of the λPRmax-values leads to a non-linear correlation between the Au particle diameter and the temperature supplied during heat treatment. As illustrated in the lower part of Fig. 6 for the glass with the composition A, the particle size can be adjusted between <10 nm to >50 nm by heat treatments for 1 h at different temperatures in the range from 680 and 760 °C, but the maximum particle size was reached at 740 °C. Glass B shows a different behavior. Here, the λPRmax values only vary in a range between 523 and 526 nm, which both correlate to a particle size of around 4 nm.
In order to correlate the growth of the Au particles with the viscosities of the glasses, viscometry and dilatometry were performed. The results from viscometry are shown in Fig. 7. The viscosities were solely measured for glass A. The temperature range in which viscosity values can be determined is strongly affected by the supplied load. In the inset, the viscosities are shown in a non-logarithmic plot. It becomes apparent that the viscosity significantly drops above the glass transition temperature while the decrease is significantly weakened if the temperature is further increased. Dilatometry was performed for all glasses. The characteristic temperatures (Tg and Td) are summarized in Table 1, where it can be seen that the results do not differ significantly.
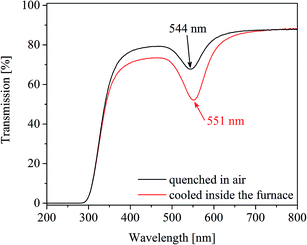
As already mentioned for the samples heat treated at 650 °C for 100 h (Fig. 2, upper right panel), a repetition of the heat treatments led to slightly different values of λPRmax varying by a value of around 2 nm. The effects of the temperature accuracy and the cooling rate of the furnace are illustrated in Fig. 8, where two samples were heat treated at 710 °C for 1 h. One of the samples was subsequently cooled inside the furnace. The other one was taken out of the furnace, i.e. quenched in air. The λPRmax-value of the slowly cooled sample is 7 nm higher than that of the fast cooled one.
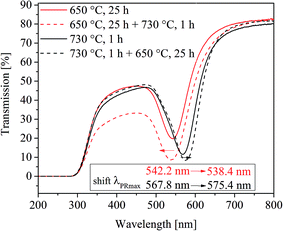
Furthermore, the effect of a two-step heat treatment, which is commonly applied if volume crystallization of glass ceramics is to be achieved, is shown in Fig. 9. There, a comparison of the UV-vis-spectra of four samples is illustrated. One of them was heat treated at 650 °C for 25 h, and another one at 730 °C for 1 h. In order to see the effect of a two-step thermal treatment, a third sample was heated first to 650 °C for 25 h and afterwards further heated to 730 °C for 1 h. By contrast, a fourth sample was heated to 730 °C for 1 h and further cooled to 650 °C and held for another 25 h. All samples were allowed to cool inside the furnace. Interestingly, the samples heat treated at 650 °C and 650 + 730 °C show almost the same plasmonic resonances, which occur 26 to 29 nm below that of the sample heated at 730 °C for 1 h. The highest plasmonic resonance is observed in the sample, which was at first heated to 730 °C followed by a heat treatment at 650 °C. However, even after long heat treatments at different temperatures, volume crystallization could not be induced in glass A.
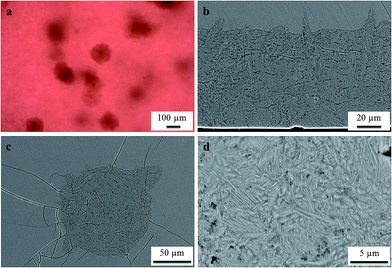
In glass B, melted with a ten times higher Au concentration of 0.1 mol%, volume crystals were observed after a two-step heat treatment, initially heated to 740 °C for 1 h in order to allow the Au particles to grow. Subsequently, the sample was cooled to 710 °C and held for 20 h at this temperature to allow the growth of Ba1−xSrxZn2Si2O7 crystals to a detectable size. As illustrated in Fig. 10, also this sample shows a strong tendency to surface crystallization (see Fig. 10b), but some large volume crystals (see Fig. 10(a) and c) were detected within the sample. The microstructure of the surface layer is shown in Fig. 10(d).
It should be noted again that thermal treatment of the antimony-free glass C did neither lead to a red coloration nor to bulk nucleation.
4. Discussion
4.1. Redox behavior
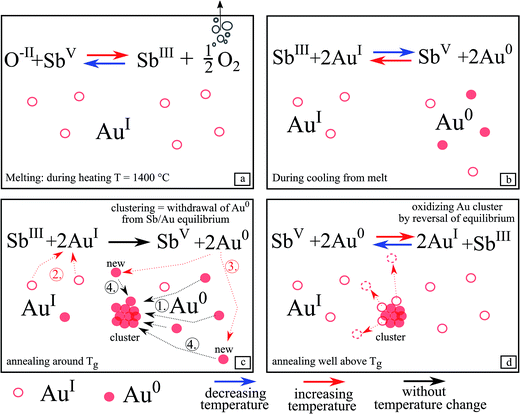
After the heat treatment, both surfaces of the samples were polished to remove on the one hand a possibly existing crystal layer and on the other hand to remove the topmost area of the glass probably influenced by the surrounding atmosphere. This was done because it cannot be ruled out that oxygen has an effect on the redox pairs SbIII/SbV and AuI/Au0. Hence, all presented results concerning the redox behavior and Au particle growth, originate from the inner part of the glass.Fig. 11 illustrates the redox behavior of SbIII/SbV and AuI/Au0 in more detail. During increasing the temperature to 1400 °C, the maximum melting temperature, (Fig. 11a), SbV is reduced to SbIII while gaseous oxygen is formed. Hence, during this step, antimony acts as a “fining agent”. The supplied maximum temperature is decisive for the [SbIII]/[SbV] ratio.
Glass C did not show any red coloration after heat treatment and hence antimony is necessary to form gold nanoparticles within the glass matrix. This is due to the redox reaction between AuI and SbV, which is absolutely necessary to obtain elemental gold.
This redox reaction takes place during cooling (see eqn (1) and Fig. 11b) from the melting temperature of 1400 °C. The equilibrium according to eqn (1) is shifted to the right, i.e. SbIII is oxidized to SbV while part of the AuI is reduced to the metallic state, Au0. This reaction (see eqn (1)) is related to the two redox reactions shown as eqn (4) and (5):
| 4AuI + 2O2− ↔ 4Au0 + O2 | (4) |
| 2SbV + 2O2− ↔ 2SbIII + O2 | (5) |
Unfortunately, data on the equilibrium according to eqn (4) are not known and hence the thermodynamics of eqn (4) and hence also of eqn (1) cannot be quantified. It is, however, known from electrochemical studies in silicate melts (which, however possess fairly different compositions) at high temperatures that the SbV/SbIII/O2 equilibrium (see eqn (5)) has a large reaction enthalpy15 and is hence drastically shifted with decreasing temperature to SbIII, i.e. the right side, while for polyvalent elements in which the number of the transferred electrons is only 1, the reaction enthalpy is usually much lower. That has been reported for AgI/Ag0,16 the CuII/CuI (ref. 15) and the FeIII/FeII (ref. 17) redox equilibria. From equilibria similar to eqn (5) formed by other redox pairs, it is, however, known that the most pronounced changes in the respective concentrations take place at temperatures Tg − 100K < T < Tg + 100 K.18,19 That means that redox reactions are still possible at temperatures below Tg. In this temperature range, the establishment of the equilibrium during temperature change is already affected by the kinetics, as shown by high temperature spectroscopy.18,20,21 Such a chemical reaction will form a “frozen-in metal vapor”, in other words, homogeneously distributed gold atoms.7
During the additional heat treatment near Tg, (Fig. 11c) SbIII is possibly further oxidized to SbV and then even more Au0 is formed because sufficient time is available to overcome the kinetic hindrance.
At this temperature, the Au0 atoms are fairly mobile and start to form gold clusters, responsible for red coloration, based on the optical effects described by Mie theory. Meanwhile, new Au0 is continuously formed (step 2 and 3), since the metallic Au0 is removed from the equilibrium according to eqn (1) and bound in clusters (step 1 and 4). Hence, to maintain an equilibrium, AuI is further reduced by SbIII and new Au0 is formed.
Upon further increase of the temperature (Fig. 11d) (e.g. 740 °C for glass A), the equilibrium according to eqn (1) is shifted to the left and SbV begins to be reduced to SbIII while Au0 is oxidized and hence dissolved in the glass matrix. Thus, the clusters become smaller. This can also be seen in Fig. 6, where the λPRmax values decrease at temperatures above 740 °C. The attributed decrease in the λPRmax-values at treatment temperatures above 740 °C is shown in Fig. 6. The particle diameter is continuously decreased with increasing temperatures.
4.2. Calculation of particle sizes
The correlation of λPRmax with certain diameters of Au nanoparticles calculated by means of MIE theory is in good agreement with the real particle diameters, proved via TEM investigations. In Fig. 4, the measured particle sizes and the respective λPRmax-values are shown. The predicted values from MIE theory and the measured values are in very good agreement in the case of the data point at around 10 nm, which was calculated by using the dielectric function of Au. The complex dielectric function of gold, which is usually a material constant, depends on the particle size if the particles are smaller than 10 nm.12,14,22It is well known, that due to a quantum confinement, broad electron energy bands are split into well-defined energy levels, if the particles become very small. Therefore, the magnitude of the energy band splitting is size dependent. It is also known that the dielectric properties of a material directly arise from the electronic band structure and in consequence, it is not surprising, that optical properties also become highly size dependent. Concerning the quantum confinement effect, using the complex dielectric function for a certain size enables the calculation for the optical properties of Au particles in a known glass matrix as shown in Fig. 4. The predicted particle size should be at around 4.5 nm, whereas the size of the few particles that could be imaged with TEM is around 6 nm. Considering the very limited statistics of TEM with respect to the UV-vis spectroscopy, which is averaging over a large sample volume, these values are considered to be in good agreement.
In the case of glass B, the dispersion shown in Fig. 3 does not differ much from that of glass A. Hence, the effect of the refractive index on the correlation of λPRmax with the particle size induced by a higher Au concentration in glass B is negligible. For that reason, the correlation of λPRmax with the particle size is solely illustrated for glass A in Fig. 4.
However, the particle size is a distribution and λPRmax is only a measure for the mean value of the particle size. This can also be observed in Fig. 9, where two of the illustrated curves show almost the same λPRmax values but with different peak widths of the respective plasmonic resonances. The TEM measurements, which were performed in order to give an idea about the Au particle size, gave access to only a very small number of particles, and hence no size distribution was determined. The micrographs in Fig. 5 show these Au particles.
4.3. Au nanoparticle formation and growth
In order to illustrate the growth processes of the small Au particles, a two-step heat treatment as shown in Fig. 9 was performed. Fig. 12 schematically presents the particle size evolution. In the case of a two-step treatment starting with a long (25 h) heat treatment at 650 °C, followed by a short (1 h) heat treatment at 730 °C (left panel of Fig. 12), a large number of small particles are formed (I–II). After an increase in temperature to 730 °C, the particles decrease in size (III). During cooling, the particles can slightly grow again (IV). The particle size evolution for a heat treatment in a reversed order, beginning with a short (1 h) heat treatment at a higher temperature of 730 °C followed by a treatment at lower temperature (650 °C) for a longer period of time (25 h) is shown in Section V to VIII. A smaller number of larger particles have formed (V and VI). During subsequent treatment at 650 °C, particles grow and form the largest observed particles (VII). During the final cooling step, the particles may show a slight further growth (VIII).The precipitation of Au nanoparticles from glasses depends on time and more strongly on temperature. The time dependency of Au nanoparticles sizes in glass A is illustrated in Fig. 2 and it can clearly be seen that the particles grow up to a certain value, which is between 7 and 8 nm. However, if samples are heat treated for more than 75 h, a decrease in the λPRmax-values was found (two samples were independently prepared). The attributed two data points vary by a wavelength of 2 nm, which is due to a variation in the Au-particle diameter of 0.5 nm, i.e. the particle size varies between 6.4 and 6.9 nm after 100 h of heat treatment. For all heat treatments, the same furnace was used, but as can be seen from the slope in Fig. 6, a variation of the temperature by only 1 K over a period of 1 h can lead to a change in the λPRmax-values of 0.6 nm (in the case of glass A). Hence, it can be assumed that at a temperature of 650 °C, which is around 10 to 20 K below Tg, the particles grow to a certain threshold, where they keep a constant size and further growth was not observed. So, the diffusion path length should be too large for the prevailing diffusion coefficient and Ostwald ripening was not observed. This time dependency, which is much less pronounced than the temperature dependency, was solely verified for glass A because glass B shows only a marginal temperature dependency (Fig. 6).
In Fig. 6, it can be seen that the λPRmax values increase linearly with the temperature applied during thermal treatment, whereas the diameter of the particles increases nonlinearly with temperature. The physical reason of the nonlinear temperature dependency of the particle size can be explained by the viscosity of the glass as follows: the glass transition temperature, Tg can be correlated to a viscosity of about 1013 dPas and in case of samples A and B, it is at around 671 and 667 °C (see Table 1), respectively. The dilatometric softening temperature, Td correlates to a viscosity of 1011.3 dPas and was measured with dilatometry to be at 713 °C for both glasses. Within the limits of error, both characteristic temperatures, Tg and Td are the same for both glasses. Hence, the resulting viscosity curves of both glasses should not differ significantly. This is why viscosities were solely measured for glass A (Fig. 7). The growth behavior of the gold particles in glass A can be correlated with the viscosity, where up to a temperature of around 700 °C, no significant increase in the size can be detected. At temperatures higher than or equal to 710 °C, the Au particle size increases. Here, the dilatometric softening point is reached and the viscosity is low enough to allow a diffusion of the Au as well as the SbIII/SbV ions over a much wider range. It should be noted that Stokes–Einstein equation is not valid in glass melts which is evidenced by the observation that the diffusion coefficients for different species differ by up to several orders of magnitude at the same temperature.23 Nevertheless, for a certain diffusing species, there should be a certain correlation of the diffusivity and the reciprocal viscosity.24
However, this growth behavior was not observed in glass B; here the observed particle size is almost independent from the heat treatment schedule and stays constant at around 4 nm. This size does also not increase if two step heat treatments (as illustrated in Fig. 9 for glass A) are performed for glass B. Such heat treatments lead, in the case of glass B, also to particle sizes of around 4 nm and λPRmax reaches not more than 526 nm. It has already been reported in literature that an increase in the Au concentration leads to a shift of the λPRmax values to lower wavelengths, i.e. a decrease in the size of the Au nanoparticles inside the glass.25 It is also known that there is an effect of the ratio of the concentrations of the noble metal and the reducing agent (antimony), but it was not expected that this effect is as pronounced as demonstrated in Fig. 6. Furthermore, it was not expected that the Au particles are not able to grow larger than 4 nm independent from the heat treatment.
At a first glance, it is surprising that the gold nanoparticles in glass A grow with time and get larger with increasing temperature, while in glass B, which has a tenfold higher Au concentration they do not get larger if thermally treated at higher temperature or for a longer period of time.
In glass A, only a smaller number of nuclei may have formed, due to the smaller gold concentration and hence smaller oversaturation. Thus the residual AuI-ions or homogeneously dissolved gold atoms may diffuse to the gold particles and let them grow to much larger size. The observation that the particles grow with time (see Fig. 2) should be due to the long diffusion paths. As long as the particles grow, there is still an oversaturation of homogeneously dissolved gold. As shown in Fig. 6, the particles get also larger with increasing temperature. Thermal treatment at higher temperatures leads to larger particles and hence a smaller number of particles.
In classical nucleation theory, nucleation and crystal growth are regarded as two separate processes. The nucleation rate has a maximum at lower temperature, around Tg, whereas the maximum of the crystal growth velocity occurs at a much higher temperature. Assuming the sample is heated, the temperature passes through the range of high nucleation rate and is then kept in a range where the nucleation rate is negligible, however, the crystal may grow. Then the number of nuclei should be fairly small and the crystals should grow with time and also exhibit larger diameters if thermally treated at higher temperatures due to the higher growth velocities. This behavior is observed in sample A. By contrast, in sample B, the oversaturation of gold is much higher, hence the nucleation rate should also be higher. If then the sample is heated and passes the range of high nucleation rate, much more nuclei are formed, which accordingly have a much smaller distance from each other. During the subsequent growth, the oversaturation is completely degraded due to the required smaller diffusion paths, the maximum diameters are reached within a relatively short time and hence appear as to be independent on both, time and temperature.
This is also in good agreement with the effects illustrated in Fig. 8 and 9. Under the assumption of a diffusion-controlled process in glass A (see Fig. 8), it is clearly seen, that the diffusion and the attachment of Au atoms to the formed nuclei has not yet been completed. Hence, during slow cooling, it is still enough time for diffusion and the formation of larger particles which results in a higher resonance wavelength. This can be explained as follows: the equilibrium according to eqn (4) is shifted to SbIII if the temperature is increased. That means that some metallic gold is oxidized to AuI. If now the temperature is decreased, AuI is again reduced to metallic gold, which now diffuses to the present Au nanoparticles. If this cooling is performed fast, the growth of the nanoparticles will not occur in a notable extend. If cooling is slowly, then the particles can grow by attachment of diffusing Au atoms.
For the interpretation of Fig. 9, the effect of viscosity has additionally to be introduced and Fig. 12 illustrates the process during a two-step heat treatment. As already mentioned, higher temperatures lead to larger particles in the case of sample A. This is clearly seen in the difference of the wavelength of the plasmonic resonance, shifted from 542.2 (650 °C, 25 h) to 567.8 nm (730 °C, 1 h) which is equal to a particle size of 6.1 and 48.1 nm, respectively. At 650 °C, the nucleation rate is higher than at 730 °C and hence at 650 °C, the number of nuclei formed should be larger and thus also the particles should be smaller which explains the shift in the plasmonic resonance during thermal treatment at 730 °C (compare Section II to IV in Fig. 12). As already mentioned, the process is diffusion controlled, at lower temperatures leading to smaller particles.
The two step thermal treatment, (650 °C for 25 h and 730 °C for 1 h) results, however, in a lower plasmon resonance of 538.4 nm. After increasing the temperature to 730 °C, the redox ratio is shifted towards AuI, i.e., mobile gold atoms become oxidized and consequently, gold nanoparticles are partially dissolved until a new equilibrium is reached. This is considered to be the reason of the minor decrease in particle size during the second step of thermal treatment at 730 °C and is illustrated in Section II and III in Fig. 12. The same behavior is also shown in Fig. 2 and 6, where for treatment times longer than 75 h and temperatures above 740 °C a steady decrease of the particle size occurred. If the sample is heated to 730 °C and then to 650 °C, at first a comparatively small number of huge gold nanoparticles are formed. These particles can grow further if the temperature is decreased to 650 °C, due to smaller solubility of the Au in the glass caused by the SbIII/SbV redox equilibrium shifted towards SbV. New gold atoms are formed which are mainly attached to the existing Au particles (see Fig. 12 Section VI and VII). It is not excluded that additional small particles might form between the larger Au particles due to the short diffusion paths at lower temperatures.
4.4. Suitability of Au nanoparticles as nucleating agent
Fig. 10 shows a low number of volume crystals in a sample with the composition B. These crystals might have grown on the Au particles. However, this could not be proved because it is almost impossible to find the Au particles in the center of these large crystals using SEM due to its low information depth. After the applied heat treatment, a few and very large crystals were formed. It should be noted that also in other glass systems quite numerous primarily formed tiny crystals composed of nucleating agents occur. In the case of the well investigated Li2O/Al2O3/SiO2 system, some 100 ZrTiO4 nuclei are necessary for the formation of only one LAS crystal.26–28 Hence, the observation that many gold nanoparticles lead to the formation of only few BSZS crystals is not in contradiction.According to literature, a precipitated noble metal nanocrystal must have a certain size to trigger nucleation. This size is (in the case of other glass systems) reported to be below 10 nm.1 Surprisingly, volume crystallization is only triggered in glass B, in which the gold particles are as small as around 4 nm. In glass A in which the gold particles are up to 50 nm in diameter, volume crystallization is not observed.
Nevertheless, triggering volume crystallization in this system with Au nanoparticles is not an appropriate procedure. Hence, in this glass system, at least under the supplied conditions, Au is not suitable as effective nucleation agent and cannot trigger volume crystallization in a sufficient extend.
5. Conclusions
Two glasses with different Au- and antimony oxide concentrations were synthesized and ruby color was reached after different heat treatments. Additionally, a glass without antimony was studied, which did not show red coloration whatever the thermal treatment was. The glass with the lower Au-concentration showed a strong dependency of the particle size on the applied temperature of the heat treatment. From UV-vis-spectroscopic investigations, the particle size of metallic nanoparticles was determined to be within the range from below 5 to above 50 nm using Mie theory and a size-dependent, complex dielectric function. At higher temperatures, the particles become smaller due to the shifted redox equilibrium with antimony and, consequently, an oxidation of gold nanoparticles. In the second glass with a ten-fold higher Au-concentration, only very small particles with a size of around 4 nm were formed. These particles were not able to grow to a significantly larger size, even when the temperature of the heat treatment was increased. The formation of the gold nanoparticles is a two-step process. The first step is a redox reaction of SbIII and AuI ions which react to metallic gold and SbV. This redox reaction takes place during cooling and is reversible if re-heated. The second step is the formation of the gold nanoparticles by diffusion. This clustering removes homogeneously dissolved metallic gold from the glass and hence causes a further reduction of AuI by SbIII.Both glasses show a strong tendency to surface crystallization. However, in glass B also a low number of large volume crystals were able to form. Hence, Au is able to act as a nucleation agent in BaO–SrO–ZnO–SiO2-glasses, but the probability that a crystal really grows on such a metallic particle is quite low.
Conflicts of interest
There are no conflicts of interest to declare.Acknowledgements
This work was funded by the German Federal Ministry of Education and Research (BMBF) under Grant Numbers 03VP01701 and 03VP01702.References
- S. D. Stookey, Ind. Eng. Chem., 1959, 51, 805–808 CrossRef CAS.
- S. D. Stookey, J. Am. Ceram. Soc., 1949, 32, 246–249 CrossRef CAS.
- S. D. Stookey, Ind. Eng. Chem., 1949, 41, 856–861 CrossRef CAS.
- C. Thieme, H. Görls and C. Rüssel, Sci. Rep., 2015, 5, 18040 CrossRef CAS PubMed.
- C. Thieme, G. B. de Souza and C. Rüssel, J. Am. Ceram. Soc., 2016, 99, 3097–3103 CrossRef CAS.
- C. Thieme, M. Schlesier, C. Bocker, G. Buzatto de Souza and C. Rüssel, ACS Appl. Mater. Interfaces, 2016, 8, 20212–20219 CAS.
- F. E. Wagner, S. Haslbeck, L. Stievano, S. Calogero, Q. A. Pankhurst and K. P. Martinek, Nature, 2000, 407, 691–692 CrossRef CAS PubMed.
- U. Kreibig and M. Vollmer, Optical properties of metal clusters, Springer, Berlin, Heidelberg, 1st edn, 1995 Search PubMed.
- U. Veit and C. Rüssel, Ceram. Int., 2016, 42, 5810–5822 CrossRef CAS.
- S. H. Wemple, Phys. Rev. B: Solid State, 1973, 7, 3767–3777 CrossRef CAS.
- P. Laven, J. Quant. Spectrosc. Radiat. Transfer, 2004, 89, 257–269 CrossRef CAS.
- C. F. Bohren and D. R. Huffman, Absorption and scattering of light by small particles, Wiley, New York, 1983 Search PubMed.
- P. B. Johnson and R. W. Christy, Phys. Rev. B: Solid State, 1972, 6, 4370–4379 CrossRef CAS.
- U. Kreibig, J. Phys. Colloques, 1977, 38, C2–97–C2–103 Search PubMed.
- C. Rüssel and E. Freude, Phys. Chem. Glasses, 1989, 30, 62–68 Search PubMed.
- O. Clauβen and C. Rüssel, J. Mol. Liq., 1999, 83, 295–302 CrossRef.
- S. Gerlach, O. Claußen and C. Rüssel, J. Non-Cryst. Solids, 1998, 238, 75–82 CrossRef CAS.
- G. Gravanis and C. Rüssel, Glastech. Ber., 1989, 62, 345–350 CAS.
- L. Kido, M. Müller and C. Rüssel, Chem. Mater., 2005, 17, 3929–3934 CrossRef CAS.
- L. Kido, M. Müller and C. Rüssel, Phys. Chem. Glasses, 2004, 45, 21–26 CAS.
- L. Kido, M. Müller and C. Rüssel, J. Chem. Phys., 2012, 136, 224502 CrossRef PubMed.
- M. Quinten, Optical properties of nanoparticle systems, Wiley-VCH, Weinheim, 2011 Search PubMed.
- O. Clauβen and C. Rüssel, J. Non-Cryst. Solids, 1997, 215, 68–74 CrossRef.
- C. Rüssel and A. Wiedenroth, Chem. Geol., 2004, 213, 125–135 CrossRef.
- J. A. Williams, G. E. Rindone and H. A. McKinstry, J. Am. Ceram. Soc., 1981, 64, 709–713 CrossRef CAS.
- S. Bhattacharyya, T. Höche, J. R. Jinschek, I. Avramov, R. Wurth, M. Müller and C. Rüssel, Cryst. Growth Des., 2010, 10, 379–385 CAS.
- T. Höche, C. Patzig, T. Gemming, R. Wurth, C. Rüssel and I. Avramov, Cryst. Growth Des., 2012, 12, 1556–1563 Search PubMed.
- T. Höche, M. Mäder, S. Bhattacharyya, G. S. Henderson, T. Gemming, R. Wurth, C. Rüssel and I. Avramov, CrystEngComm, 2011, 13, 2550–2556 RSC.
| This journal is © The Royal Society of Chemistry 2018 |


