 Open Access Article
Creative Commons Attribution 3.0 Unported Licence
Effects of oxygen functional groups and FeCl3 on the evolution of physico-chemical structure in activated carbon obtained from Jixi bituminous coal†
Dongdong Liu ad,
Boyin Jia*b,
Xiujuan Liuc,
Bojun Zhaod,
Jihui Gao*d,
Qingxi Caod,
Shaohua Wud and
Yukun Qind
aCollege of Engineering and Technology, Jilin Agricultural University, Changchun 130118, China
bCollege of Animal Science and Technology, Jilin Agricultural University, Changchun 130118, China. E-mail: jiaboyin@139.com
cPetrochina Daqing Petrochemical Company, Daqing 163000, China
dSchool of Energy Science and Engineering, Harbin Institute of Technology, Harbin 150001, China. E-mail: gaojihui0809@163.com
First published on 26th February 2018
Abstract
It is crucial to increase the values of SBET/burn-off ratio to achieve activated carbon (AC) with a higher SO2 adsorption capacity at a low cost from flue gas. In this study, at first, Jixi bituminous coal was used as a raw material to prepare a series of pre-treated samples by oxidation treatment and adding different amounts of the FeCl3 catalyst. Then, the AC samples were prepared by pyrolysis under a N2 atmosphere and physical activation with CO2. Finally, the change in the physico-chemical structure of different samples was determined to study the effects of oxygen functional groups and FeCl3. The results show that the rapid growth of mesopores is mainly influenced by the evolution of oxygen functional groups, whereas the micropores are mainly influenced by the FeCl3 catalyst during pyrolysis. These effects can also further improve the size and the carbon type of the aromatic structure from a different perspective to promote the disordered microstructure of treated chars (1FeJXO15-800H, 3FeJXO15-800H and 6FeJXO15-800H) as compared to the ordered microstructure and less pores of the un-pretreated char (JX-800). Then, the active sites can no longer be consumed preferentially in the presence of the catalyst; this results in the continuous disordered conversion of the microstructure as compared to the ordered conversion of JX-800 char during activation. On the one hand, the developed initial pores of 1FeJXO15-800H, 3FeJXO15-800H, and 6FeJXO15-800H chars promote the favorable diffusion of activated gas, following the non-hierarchical development. On the other hand, the presence of Fe-based catalysts facilitates the etching of carbon structure and the rapid and continuous development of the micropores, hindering the severe carbon losses on the particle surface. Finally, the 3FeJXO15-800H char with a high value of SBET (1274.64 m2 g−1) at a low burn-off value (22.5%) has the highest SBET/burn-off ratio value of 56.65 m2 g−1/%, whereas the JX-800 char with a low value of SBET (564.19 m2 g−1) at a burn-off value of 58.2% has the lowest SBET/burn-off ratio value of 9.69 m2 g−1/%. Therefore, the presence of oxygen functional groups and FeCl3 has obviously changed the evolution of the physico-chemical structure in activated carbon to effectively enhance the values of SBET/burn-off.
1 Introduction
At present, biomass is mainly used as a raw material for the preparation of activated carbon (AC). Because of the limited sources of raw materials, the production of biomass-based AC is relatively low and its price is relatively high. However, anthropogenic SO2 emission from large coal-fired power plants has been considered as a major gas pollutant for a long time. Traditional biomass-based AC is unable to satisfy the desulfurization requirements in coal-fired power plants; therefore, AC can be produced by coal as the most suitable raw material instead of traditional biomasses and some wastes and the traditional physical activation with steam or CO2 resulting from high-temperature flue gas. A higher specific surface area (SBET) is conducive for desulfurization in the existence of a hierarchical structure (micro- and mesopores).1–4 At present, industrial application of coal-based AC has been hindered owing to the relatively low desulfurization property and the relatively high cost, and these are associated with more carbon loss on the particle surface that cannot promote the number of pores during activation; this results in lower values of the SBET/burn-off ratio. In previous years, coal-based AC with the SBET values between 500 and 800 m2 g−1 at the high burn-off values of approximately around 40–60% during activation has been produced by most of the researchers using physical activation.5–7 Substantially, higher values (200–1100 m2 g−1) have been reported by San Miguel et al.8 for activation with steam and CO2 at 925–1100 °C, but with burn-off levels up to 80%. These results show that it is necessary to operate at high burn-off to reach a higher SBET via physical activation. However, it is difficult to obtain coal-based AC with a higher SBET at low burn-offs during activation only by adjusting the activation conditions (such as temperature and type and dosage of the activating gases).9,10 The specific analysis is as follows: the number of initial pores of precursors produced by pyrolysis and the conversion tendency of the carbon structure of precursors during activation have important effects on the ideal AC production. At first, in the beginning of the activation process, a small amount of initial pores can hinder the diffusion of the activated gas into the particles' interior to produce more pores; this leads to the occurrence of more reactions on the particle surfaces.11–14 Then, with an increase in the activation time, the highly ordered conversion of the carbon structure at high temperatures can reduce the number of active sites; this hinders the sustained growth of micropores inside the particles and continually increases the external loss of quality.15 Therefore, the simultaneous resolution of the abovementioned two problems is the key to achieve a high SBET/burn-off value.Most of the studies reported in literature suggest that the simultaneous introduction of oxygen functional groups produced by air pre-oxidation and metal catalysts may solve the abovementioned problems. At first, more pores in precursors can be produced by the evolution of oxygen functional groups during pyrolysis.5,6,16 Francisco et al.17–21 showed that the evolution of oxygen functional groups changed the pore development, and the mesopores were first produced followed by the formation of micropores with an increase in the cyclic oxygen chemisorption–desorption number. In a former study,22 we reported that more active sites and a porous structure of oxidized chars were created by the evolution of oxygen-containing structures with different stabilities; this led to the rapid diffusion of the activated gas into the particles' interior during activation. However, the rapid consumption of oxygen-containing active sites and ordered conversion of carbon structure occurred with an increase in the activation time; this led to high burn-off. Then, the existence of metal catalysts may improve the conversion of the carbon structure that promotes gasification efficiency. The catalytic mechanism of gasification has been investigated by some researchers.23–26 They believed that some intermediates (such as C(O) and M–C–O) were formed first in the presence of catalysts, and then, these intermediates acted as active sites that could react with a gasifying agent to increase the gasification rate. In addition, in our previous study,27 we found that FeCl3 at different amounts could improve the decomposition and condensation of the microstructures during pyrolysis in various degrees. However, the rapid polymerization of Fe-based catalysis led to severe deactivation of catalysts, and there were not enough initial pores in the Fe-based precursor to ensure gas diffusion during activation; this led to a relatively low SBET/burn-off ratio value, which was in a good agreement with other studies.28,29 Therefore, the effects of each oxygen functional group and FeCl3 catalysts have been independently analyzed in our previous study. However, the effects of oxygen functional groups and Fe-based catalyst on the evolution of the physico-chemical structure in the process of formation of AC have rarely been studied in detail.
In this study, a series of coal samples were prepared by pre-oxidation in air at 200 °C for 15 h and loading various amounts of the FeCl3 catalyst (1 wt%, 3 wt%, and 6 wt%) as a cheap metal catalyst into the coal. The effects of oxygen functional groups and FeCl3 catalyst on the physical and chemical structure of coal char in the whole preparation process were investigated. The feature parameters of all the samples were obtained by transmission electron microscopy (TEM), scanning electron microscopy (SEM), nitrogen adsorption, X-ray diffraction (XRD), and Raman spectroscopy.
2 Experimental
2.1. Sample preparation
Jixi bituminous coal from China was used in this experiment, which was crushed and sieved to a particle size of 250–380 μm. To eliminate the interference of ash in coal, the sample coal was processed using 6 mol L−1 HCl and 40 wt% HF sequentially in accordance with the demineralization procedure.30 After the demineralization procedure, the proximate and ultimate analysis data of the acid-treated samples were obtained, as shown in Table 1. The ash content in the acid-treated sample was below 1%, and this sample was denoted as JX. Then, JX was oxidized in air at 200 °C for 15 h and was denoted as JXO15; moreover, a predetermined amount of FeCl3 powder (0.03 g, 0.09 g, and 0.18 g) and 3 g of oxidized coal (JXO15) were added to an aqueous solution. The resulting mixture was stirred for 24 h in a sealed beaker at ambient temperature, evaporated under vacuum, and dried at 100 °C overnight before the pyrolysis experiment; these samples were denoted as 1FeJXO15, 3FeJXO15, and 6FeJXO15.| Sample | Proximate analysis (wt%) | Ultimate analysis (wtdaf%) | |||||||
|---|---|---|---|---|---|---|---|---|---|
| Vad | FCad | Aad | Mad | Cdaf | Hdaf | Odafa | Ndaf | Sdaf | |
| a By difference; ad (air-dried basis): the coal in dry air was used as a benchmark; daf (dry ash free basis): the remaining component after the removal of water and ash in coal was used as a benchmark. | |||||||||
| JX | 39.66 | 56.60 | 0.12 | 3.62 | 74.81 | 19.49 | 4.01 | 1.31 | 0.38 |
2.2. Experimental process
The activated carbon was prepared by a conventional fixed bed reactor, and the more detailed process is as follows: (1) pyrolysis experiment: 3 g of the sample coals (JX, 1FeJXO15, 3FeJXO15, and 6FeJXO15) were placed in a three-stage fixed-bed reactor that was then heated at 8 °C min−1 to 800 °C and then maintained for 60 min in a N2 flow of 450 mL min−1. Next, the sample coals were rapidly cooled under a N2 atmosphere and denoted as JX-800, 1FeJXO15-800, 3FeJXO15-800, and 6FeJXO15-800. To eliminate the interference of Fe-based compounds in chars for the results of XRD and Raman, some char samples including Fe-based compounds were treated with 0.2 mol L−1 HCl and washed with distilled water to remove chloride ions; these samples were denoted as 1FeJXO15-800H, 3FeJXO15-800H, and 6FeJXO15-800H. Fig. S1† shows the XRD phase analysis results of 6FeJXO15-800 and 6FeJXO15-800H. (2) Activation experiment: these typical chars were continuously heated up to 900 °C under a N2 atmosphere and then held for appropriate times under a CO2 flow of 450 mL min−1 to obtain AC with different porous structures at different burn-offs. After activation, the CO2 flow was replaced with N2 to cool them down to room temperature. In addition, the char samples still included Fe-based compounds, which could interfere with the measurements and curve-fitted results of XRD and Raman owing to their fluorescence effects.31,32 In order to obtain accurate results, some AC samples including Fe-based compounds was treated using 0.2 mol L–1 HCl, and these treated samples were denoted as JX-800, 1FeJXO15-800H, 3FeJXO15-800H, and 6FeJXO15-800H-burn-off values.2.3. Measurement analysis
The transmission electron microscope (TEM, Tecnai G2 F30) was operated at 200 kV to visualize the structural changes. SEM (Quanta 200) was performed using an instrument operated at 200 kV to visualize the surface topography of samples. Structural parameters of the crystalline structures were obtained by the D/max-RB X-ray diffractometer, with the measurements performed in the 2θ range from 10° to 80° at a scan rate of 3° min−1. Next, the char powders were investigated by Raman spectroscopy using a 532 nm wavelength laser and observing the scattering in the range of 1000–1800 cm−1. The pore structure characteristics of the prepared samples were obtained by nitrogen adsorption at the analysis temperature of 77 K using a Micromeritics adsorption apparatus (ASAP2020), with the measurements performed for the adsorption data in the relative pressure (P/P0) range from 10−7 to 1.33 The prepared samples were degassed under vacuum at 473 K for 12 h before N2 adsorption analysis. The specific surface area (SBET), the micropore area (Smic), the micropore volume (Vmic), and pore size distribution were calculated using the Brunauer–Emmett–Teller (BET) equation, t-plot method, Horvath-Kawazoe (HK) method, and the nonlocal density functional theory (NLDFT), respectively.34–36 In addition, the total pore volume (Vt) was determined at the 0.98 relative pressure.3 Results & discussion
3.1. TEM analysis of coal chars produced by pyrolysis
Several TEM images of different coal chars at a high resolution are shown in Fig. 1. A large amount of ordered crystalline layers could be found near a small quantity of amorphous carbon for JX-800, as shown in Fig. 1(a). Then, as the amount of FeCl3 additive increased from 1 wt% to 3 wt%, there were more interlaced arrangements between amorphous carbon and crystallite layers and a lot of amorphous regions for 1FeJXO15-800 and 3FeJXO15-800, as shown in Fig. 1(b) and (c), indicating that the degree of order in microstructure decreased obviously. However, sphere-like particles encapsulated by multi-layer amorphous carbons can be found near some long, parallel-aligned crystallite layers having different orientations for 6FeJXO15-800, as shown in Fig. 1(d), and this phenomenon is related to the mechanism of metal-catalyzed graphitization.37–39 Compared to the literature27 regarding the TEM image (unoxidized coal chars with 6 wt% FeCl3), closely arranged crystalline layers of 6FeJXO15-800 were broken, and blurred boundaries of crystalline layers, smaller diameter, and more amorphous regions were also observed in Fig. 1(d). The abovementioned results show that the existence of oxygen functional groups can hinder the concentration and amalgamation of the FeCl3 catalyst at high temperatures; thus, the effects of oxygen functional groups and FeCl3 catalyst can promote the obvious disordered arrangement of the microstructure during pyrolysis.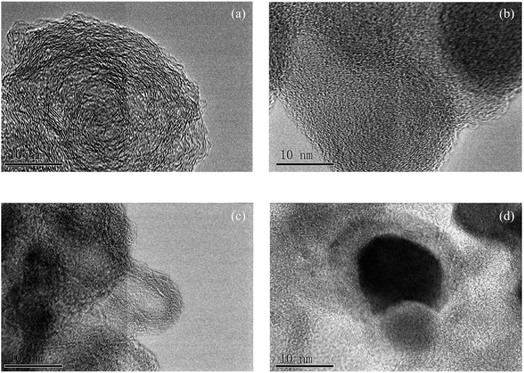 | ||
| Fig. 1 TEM images of coal chars with different amounts of FeCl3 (a) JX-800; (b) 1FeJXO15-800; (c) 3FeJXO15-800; and (d) 6FeJXO15-800. | ||
3.2. Pore structure analysis of coal chars produced by pyrolysis
The N2 adsorption isotherms and the pore-size distribution of different coal chars are shown in Fig. 2. At first, the N2 adsorption capacities of JX-800 were very small, indicating fewer pores. This result is related to the formation of metaplast materials that block the pores during pyrolysis. Then, the N2 adsorption isotherms of 1FeJXO15-800H, 3FeJXO15-800H, and 6FeJXO15-800H were related to a type I at low pressures and type IV at high pressures according to the IUPAC classification. These isotherms began to branch, and a hysteresis loop could be observed as the relative pressure continued to increase; this indicated the formation of mesopores. With an increase in the amount of FeCl3 additive from 1 wt% to 3 wt%, the N2 adsorption capacities at low pressures increased evidently and their knee became broader; however, 6FeJXO15-800H exhibited an obvious decrease at low pressures; then, there were no obvious changes in their isotherms at high pressures. Alternatively, the pore-size distributions of different coal chars were relatively broad, where the size range was 0.6–20 nm, as observed from Fig. 2(b). As the amount of FeCl3 addition increased from 1 wt% to 3 wt%, the volume of the micropores obviously increased; this indicated an increase in the micropore quantity and the presence of wider micropores. These changes might be related to catalytic cracking characteristics of FeCl3. Gong et al.30 proved that the cleavage of the microcrystalline structure was occurred by adding Fe-based catalysts to release more volatile matter (such as CO or CO2); this led to formation of pores. However, the micropore volume in 6FeJXO15-800H exhibited an obvious decrease, which was related to the concentration and amalgamation of FeCl3 catalyst at high temperatures. In addition, the size distribution of their mesopores was similar, but an increase in mesopore volume from 3 to 5 nm for 6FeJXO15-800H was observed by removing the nanoparticles occupying the inner space of coal chars. These results indicated that the evolution of oxygen functional groups mainly facilitated the development of mesopores, and the FeCl3 catalyst could efficaciously promote the formation of micropores during pyrolysis. Therefore, the effects of oxygen functional groups and FeCl3 catalyst can simultaneously promote the development of mesopores and micropores of coal chars during pyrolysis.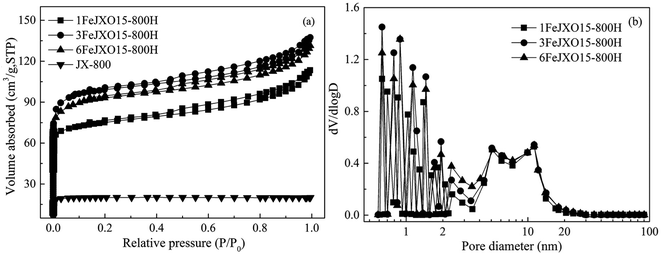 | ||
| Fig. 2 N2 adsorption isotherms and pore-size distributions of different coal chars obtained at 800 °C. | ||
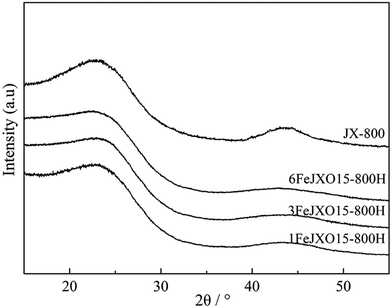
3.3. Crystal structure analysis of coal chars produced by pyrolysis
The XRD profiles of different coal chars are given in Fig. 3. There were two obvious broad diffraction peaks at 2θ = 24°–27° and 41°–44° in all the samples, which were related to an interplanar spacing between two aromatic layers and the degree of condensation of aromatic layers.40 According to the peak fitting treatment used by Liu et al.,27 the XRD profiles of all the samples were processed to obtain some important parameters (such as the aromatic structure layer distance d002, stacking height Lc, width La, and the number of aromatic layers N = Lc/d002) regarding the microcrystalline structure, as shown in Table 2.| JX-800 | 1FeJXO15-800H | 3FeJXO15-800H | 6FeJXO15-800H | |
|---|---|---|---|---|
| La (Å) | 24.91 | 25.71 | 25.55 | 25.13 |
| Lc (Å) | 13.72 | 12.95 | 12.86 | 12.43 |
| d002 (Å) | 3.50 | 3.69 | 3.72 | 3.76 |
| N | 3.77 | 3.51 | 3.50 | 3.31 |
The 002 and 100 peaks observed for JX-800 were most obvious, the d002 value reached a minimum of 3.50 Å, and the Lc value reached a maximum of 13.72 Å as compared to that of other samples. The microcrystalline structure of JX-800 was transformed into a highly ordered graphite-like structure because of the presence of a plastic behavior. The appearance of the metaplast material facilitated the movement and orientation adjustment of aromatic layers during pyrolysis; this resulted in the rapid stacking and condensation of aromatic layers.5,6,11–14 Then, the La, Lc, and N values of 1FeJXO15-800H, 3FeJXO15-800H, and 6FeJXO15-800H decreased, and the d002 values increased; this indicated that the microcrystalline structure was transformed into a type of disordered structure during pyrolysis in the presence of FeCl3 catalyst and oxygen functional groups. Compared to that of the oxidized char (JXO15-800) without the addition of the FeCl3 catalyst reported in our previous study,22 the degree of disorder in 1FeJXO15-800H, 3FeJXO15-800H, and 6FeJXO15-800H was further promoted by increasing the amount of FeCl3 catalyst, and Fe might penetrate into an aromatic structure during pyrolysis to enlarge the aromatic structure layer distance (d002). Alternatively, the decrease in the La and Lc values was related to the catalytic cracking characteristics of the FeCl3 catalyst during pyrolysis. Murakami and William et al.41,42 found that Fe-based compounds promoted the decomposition of aromatic structure to form more free radicals at the beginning of pyrolysis and then also hindered the further polymerization of free radicals to form a disordered microstructure at a later stage of pyrolysis. The abovementioned results indicated that the effects of oxygen functional groups and FeCl3 catalyst can further simultaneously improve the size of the microcrystalline structure from a different perspective to promote the degree of disorder in aromatic structure during pyrolysis; however, the catalytic cracking characteristics of the FeCl3 catalyst might play a more important role in hindering the vertical stacking and condensation of aromatic layers during pyrolysis.
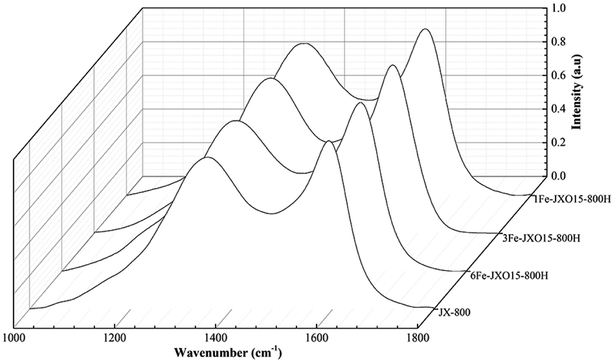
3.4. Carbon structure analysis of coal chars produced by pyrolysis
The Raman spectra of the different coal chars are shown in Fig. 4. The assignment of the five bands was carried out according to the peak fitting treatment using five bands reported by Li et al.43 The Raman spectra of all the samples were processed with a smoothing function, baseline correction, and normalization using the Origin 9.1 software to obtain the parameters of different hybrid carbon structures. Importantly, the different band area ratios represent relative structure,44,45 and this is ascribed to the following: (1) AD1/AG can be related to defect degree of the microcrystalline structure; (2) AD3/AG is considered as amorphous carbon; (3) AD1/AD3 can indicate the ratio between big rings relative to small fused rings in chars; and (4) AD4/AG can be described as the relative quantity of cross-linking bonds. In particular, the defect (AD1/AG) and cross-linking bonds (AD4/AG) can also be related to active sites in the samples. The parameters of carbon structure of carbonized chars are given in Table 3.| JX-800 | 1FeJXO15-800H | 3FeJXO15-800H | 6FeJXO15-800H | |
|---|---|---|---|---|
| AD1/AG | 3.197 | 3.770 | 3.877 | 3.987 |
| AD3/AG | 1.922 | 2.715 | 2.820 | 2.955 |
| AD4/AG | 0.611 | 0.849 | 0.885 | 0.936 |
| AD1/AD3 | 1.663 | 1.388 | 1.375 | 1.349 |
The narrow full width at half maximum of the D peak and G peak were observed for JX-800, as shown in Fig. 4. The AD1/AG, AD3/AG, and AD4/AG values of JX-800 reached minima, whereas the AD1/AD3 value of JX-800 reached a maximum as compared to that of other samples; this indicated the presence of an ordered material with lower reactivity. Then, the AD1/AG, AD3/AG, and AD4/AG values of 1FeJXO15-800H, 3FeJXO15-800H, and 6FeJXO15-800H increased, whereas the AD1/AD3 values decreased. These changes in hybrid carbon structures led to an increase in reactivity during pyrolysis. Compared to the oxidized char (JXO15-800) without the addition of FeCl3 catalyst reported in our previous study,22 the degree of change in 1FeJXO15-800H, 3FeJXO15-800H, and 6FeJXO15-800H was promoted further by increasing the amount of FeCl3 catalyst; this presented more disordered conversion of the carbon structure during pyrolysis. These results indicated that Fe-based components hindered the transformation of the isolated and defective sp2 structure (D1 peak) into the crystalline sp2 structure (G peak) and promoted the splitting of big aromatic rings (D1 peak) to form the amorphous sp2 bonding carbon atoms (D3 peak); this led to a decrease in AD1/AD3. In addition, the metal components (M) might link with the carbon matrix and oxygen functional groups to form a C–O–M bond during pyrolysis; this would result in an increase in the sp2–sp3 bonding carbon atoms (D4 peak).41 These results indicate that the effects of oxygen functional groups and FeCl3 catalyst can further improve the conversion of the carbon structure during pyrolysis to promote the number of active sites including the defects, the cross-linking bonds, and small aromatic rings, and the existence of oxygen functional groups can further promote the catalytic characteristics of the FeCl3 catalyst during pyrolysis.
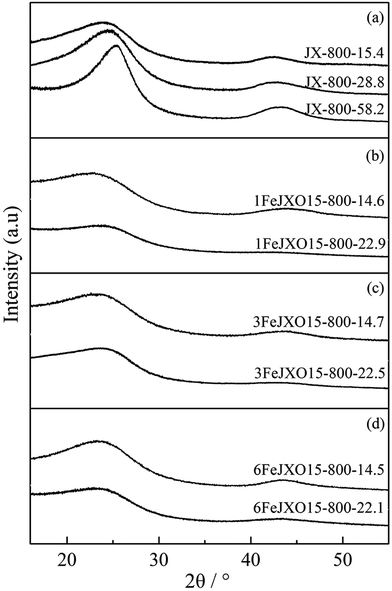
3.5. Crystal structure analysis of typical chars during activation
The XRD profiles and parameters of JX-800, 1FeJXO15-800H, 3FeJXO15-800H, and 6FeJXO15-800H at different burn offs during activation are shown in Fig. 5 and Table 4.| Samples | La (Å) | Lc (Å) | d002 (Å) | N |
|---|---|---|---|---|
| JX-800 | 24.91 | 13.72 | 3.50 | 3.77 |
| JX-800-15.4 | 25.37 | 13.41 | 3.45 | 3.89 |
| JX-800-28.8 | 26.78 | 13.92 | 3.36 | 4.14 |
| JX-800-58.2 | 28.35 | 15.53 | 3.11 | 4.99 |
| 1FeJXO15-800H | 25.71 | 12.95 | 3.69 | 3.51 |
| 1FeJXO15-800H-14.6 | 25.12 | 12.35 | 3.80 | 3.25 |
| 1FeJXO15-800H-22.9 | 22.67 | 10.91 | 4.32 | 2.53 |
| 3FeJXO15-800H | 25.55 | 12.86 | 3.72 | 3.50 |
| 3FeJXO15-800H-14.7 | 24.88 | 12.19 | 3.90 | 3.13 |
| 3FeJXO15-800H-22.5 | 22.21 | 10.42 | 4.55 | 2.29 |
| 6FeJXO15-800H | 25.13 | 12.43 | 3.76 | 3.31 |
| 6FeJXO15-800H-14.5 | 24.91 | 12.21 | 3.84 | 3.18 |
| 6FeJXO15-800H-22.1 | 23.76 | 11.20 | 4.16 | 2.69 |
There was a sustained increase in the La value and decrease in the d002 value for JX-800, and the Lc value first decreased at low burn offs from 0 to 15.4% and then increased from 15.4 to 58.2%, as shown in Table 4. It can be concluded that the microcrystalline structure has transformed into a highly ordered structure during activation. At the beginning of activation, the defects and some sandwich materials (such as aliphatic side chain and amorphous carbon) of the longitudinal aromatic layer were removed gradually; this resulted in a decrease in the d002 and Lc values. With an increase in carbon loss, the longitudinal aromatic layers began to condense and distort; this increased the thickness of the microcrystalline structure. The sustained increase of the La value was related to the rapid condensation of transverse aromatic layers because of the ordered orientation of aromatic layers produced by pyrolysis.
Alternatively, there was a sustained increase in the d002 value and a persistent decrease in the La and Lc values for 1FeJXO15-800H, 3FeJXO15-800H, and 6FeJXO15-800H with an increase in burn offs. At the beginning of activation, oxygen-containing active sites were removed gradually by active gas; thus, the addition of FeCl3 catalyst had promoted the disordered conversion of the microcrystalline structure during activation. In the catalytic process, the longitudinal aromatic structure condensed and distorted, and this occurred simultaneously with catalytic cracking; this resulted in an obvious decrease in the Lc value. Iron atom might have been bonded and fixed to carbon matrix, which destroyed the parallelism of the layer and the constancy of the interlayer spacing, thus increasing the interlayer spacing (d002). Fe-based compounds accelerate the etching of crystallite and always hinder the condensation and growth of crystallite simultaneously. However, the changed degree of XRD parameter for 6FeJXO15-800H decreased gradually at the high burn-off values ranging from 14.5 to 23.76%. The aggregation of the FeCl3 catalyst inside chars at high activation temperatures weakens the catalytic capacity, strengthening the condensation of longitudinal and transverse aromatic layers.
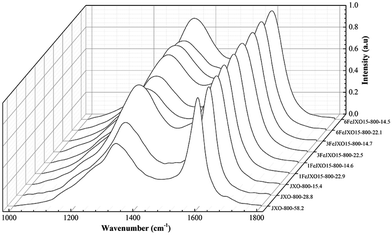
3.6. Carbon structure analysis of typical chars during activation
The Raman spectra and carbon structure parameters of JX-800, 1FeJXO15-800H, 3FeJXO15-800H, and 6FeJXO15-800H at different burn offs during activation are shown in Fig. 6 and Table 5.| Samples | ID1/IG | ID3/IG | ID4/IG | ID1/ID3 |
|---|---|---|---|---|
| JX-800 | 3.197 | 1.922 | 0.611 | 1.663 |
| JX-800-15.4 | 3.754 | 1.845 | 0.503 | 2.034 |
| JX-800-28.8 | 4.514 | 1.797 | 0.314 | 2.511 |
| JX-800-58.2 | 2.64 | 1.545 | 0.107 | 1.708 |
| 1FeJXO15-800H | 3.770 | 2.715 | 0.849 | 1.388 |
| 1FeJXO15-800H-14.6 | 3.515 | 3.001 | 0.853 | 1.171 |
| 1FeJXO15-800H-22.9 | 3.089 | 3.450 | 0.864 | 0.895 |
| 3FeJXO15-800H | 3.877 | 2.820 | 0.885 | 1.375 |
| 3FeJXO15-800H-14.7 | 3.573 | 3.175 | 0.890 | 1.125 |
| 3FeJXO15-800H-22.5 | 3.053 | 3.725 | 0.973 | 0.819 |
| 6FeJXO15-800H | 3.987 | 2.955 | 0.936 | 1.349 |
| 6FeJXO15-800H-14.5 | 3.712 | 3.145 | 0.940 | 1.180 |
| 6FeJXO15-800H-22.1 | 3.499 | 3.513 | 0.951 | 0.996 |
There was a sustained decrease in the AD3/AG and AD4/AG values, whereas AD1/AD3 and AD1/AG values first increased at the low burn offs ranging from 0 to 28.8% and then decreased from 28.8 to 58.2% for JX-800. At the beginning of activation, the smaller aromatic ring structure and active sites (such as cross-linking bonds) were consumed by activated gas preferentially. On the one hand, aromatic ring grew due to the dehydrogenation of hydro-aromatics during activation;44 on the other hand, the small aromatic ring structures might react with activated gas or convert into big aromatic ring structures at high activation temperatures;46 this resulted in a decrease in the AD3/AG and AD4/AG values and increase in the AD1/AD3 and AD1/AG values. At the high burn-off from 28.8 to 58.2%, while the smaller aromatic ring structures were removed or changed preferentially, the inner aromatic structure could be activated by the continuous penetration of the activated gas; this could further induce the condensation of the aromatic ring and promote the formation of the crystalline sp2 structure.
Alternatively, there was a sustained decrease in the AD1/AG and AD1/AD3 values and increase in the AD3/AG value for 1FeJXO15-800H, 3FeJXO15-800H, and 6FeJXO15-800H, whereas a gentle increase in the AD4/AG value was observed, as shown in Fig. 10. It could be inferred that the presence of FeCl3 catalyst could change the reaction pathways between the carbon structure and activated gas; the small aromatic ring systems and active sites could no longer be consumed with activated gas preferentially; the big aromatic rings would begin to decompose into small aromatic rings,47,48 and the FeCl3 catalyst could hinder the formation of the crystalline sp2 structure. In other words, the catalysts appeared to be preferentially accommodated on the carbons of aromatic nature, and more new cross-linking structures were formed from the broken fragments that resulted from the breakdown of aromatic structures by the catalytic capacity of FeCl3 catalyst. Moreover, the presence of O-containing structures was conducive to the reorganization of aromatic fragments. However, catalysts might move gradually and agglomerate with each other on the char surface at high burn-offs; this would lead to the degradation of catalysis for 6FeJXO15-800H.
3.7. Pore structure development of typical chars during activation
To analyze the pore development of JX-800, 1FeJXO15-800H, 3FeJXO15-800H, and 6FeJXO15-800H at different burn-off values during activation, the N2 adsorption isotherms, the pore-size distribution, and parameters of porous structure are shown in Fig. 7 and Table 6.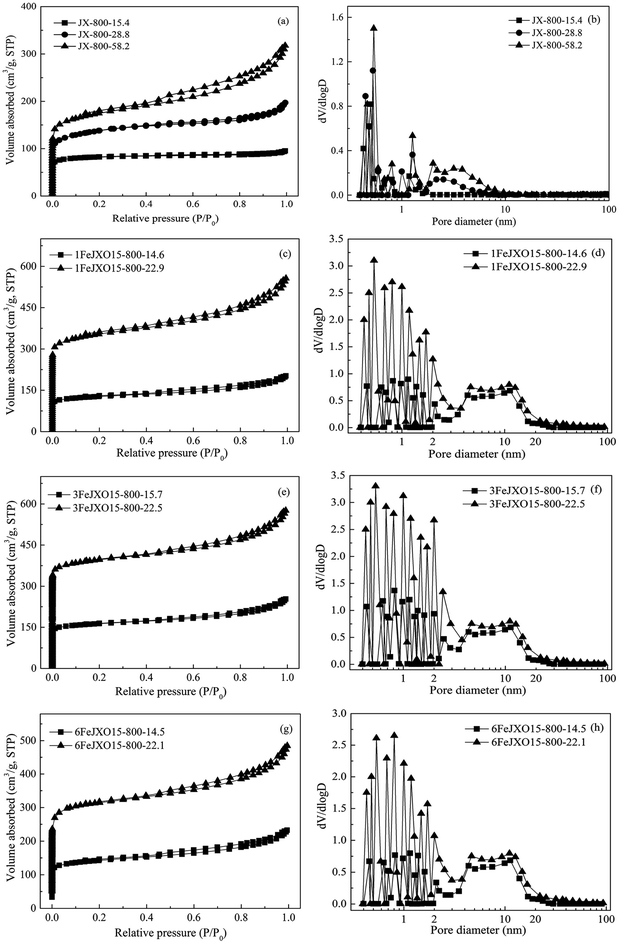 | ||
| Fig. 7 N2 adsorption isotherms and pore-size distributions of coal chars at different burn offs during activation. | ||
| Samples | SBET (m2 g−1) | Vt (m3 g−1) | Vmic (m3 g−1) | Non-Vmic (%) | Dap (nm) |
|---|---|---|---|---|---|
| JX-800-15.4 | 107.56 | 0.063 | 0.060 | 4.76 | 2.34 |
| JX-800-28.8 | 305.45 | 0.154 | 0.127 | 17.53 | 2.02 |
| JX-800-58.2 | 564.19 | 0.275 | 0.185 | 32.72 | 1.95 |
| 1FeJXO15-800H-14.6 | 348.45 | 0.192 | 0.140 | 27.08 | 2.20 |
| 1FeJXO15-800H-22.9 | 1045.43 | 0.344 | 0.285 | 17.15 | 1.32 |
| 3FeJXO15-800H-14.7 | 398.78 | 0.215 | 0.169 | 21.39 | 2.15 |
| 3FeJXO15-800H-22.5 | 1274.64 | 0.418 | 0.366 | 12.44 | 1.31 |
| 6FeJXO15-800H-14.5 | 326.55 | 0.184 | 0.130 | 29.34 | 2.25 |
| 6FeJXO15-800H-22.1 | 916.23 | 0.325 | 0.268 | 17.54 | 1.42 |
At first, based on Fig. 7, the isotherms of JX-800-15.4 could be classified as type I at low burn-offs, showing a narrow size distribution of less than 1 nm. With the gradual increase of burn-offs from 15.4% to 58.2%, all the N2 isotherms exhibited the characteristics of type I at low pressures as well as that of type IV at high pressures, and the clear hysteresis loops were observed, showing the formation of the hierarchical structure. Then, the pore structure parameters of JX-800 at different burn offs during activation are included in Table 6. The SBET value of 107.56 m2 g−1, Vmic value of 0.06 m3 g−1, and non-Vmic value of 4.76% for JX-800-15.4 were obtained, indicating the major development of micropores during the initial activation process. There was a sustained decrease in the SBET, Vmic, and non-Vmic values with an increase in the burn-off from 15.4% to 58.2%. This increase could be associated with the enlargement of micropores into mesopores progressively and the formation of many new micropores during this stage of activation. However, compared to the development of new micropores, the rapid increase of non-Vmic value, namely, the increase and development of mesopore, was more obvious from about 28.8% burn-off. Finally, the SBET value of 564.19 m2 g−1 for JX-800-58.2 at relatively high burn offs was obtained, indicating a low SBET/burn-off ratio value of 9.69 m2 g−1/%, and severe carbon losses on the particle surfaces could also be observed, as shown in Fig. 8(d). These results indicated that the pore formation of JX-800 with less initial pores followed the hierarchical development from the surface to the core during activation. Moreover, the ordered conversion of microstructure hindered the penetration of activated gas into the interior of char structure; this led to the occurrence of more reactions on the particle surfaces rather than in the interior to decrease the production of the pores.
 | ||
| Fig. 8 SEM images of coal chars under final burn-off values (a) 1FeJXO15-800H-22.9 (b) 3FeJXO15-800H-22.5 (c) 6FeJXO15-800H-22.1 (d) JX-800-58.2. | ||
Alternatively, the adsorption capacities of 1FeJXO15-800H, 3FeJXO15-800H, and 6FeJXO15-800H increased rapidly at low pressures, but had little changes at high pressures with an increase in the burn-off from 14.5% to 22.9%; this indicated the major development of micropores. The SBET and Vmic values rapidly increased during the whole stage of activation, whereas the non-Vmic value decreased drastically with the increasing burn-off. These changes meant that the initial pores of 1FeJXO15-800H, 3FeJXO15-800H, and 6FeJXO15-800H acted as channels to help the diffusion of activated gas, and the oxygen-containing active sites could strengthen the etching of the carbon structure. Along with the gradual consumption of oxygen functional groups, the disordered conversion of carbon structure and more active sites in the presence of Fe-based compounds facilitated a sustained production of more micropores; this resulted in the rapid increase of the SBET, Vt, and Vmic values. Although the catalysts might have moved and agglomerated on the particle surfaces for 6FeJXO15-800H with an increase of burn-off, no severe carbon losses occurred on the particle surface, as observed in Fig. 8(a)–(c). Importantly, the effects of oxygen functional groups and FeCl3 catalyst could further facilitate the rapid development of micropores at a relatively low burn off. The SBET values (1045.43, 1274.64, and 916.23 m2 g−1) of 1FeJXO15-800H, 3FeJXO15-800H, and 6FeJXO15-800H at the relatively low burn-off values of 22.9%, 22.5%, and 22.1% were obtained, indicating the high values SBET/burn-off ratio of 45.65 m2 g−1/%, 56.65 m2 g−1/%, and 41.46 m2 g−1/%, respectively.
4 Conclusions
Physical activation of Jixi bituminous coal regulated by oxygen functional groups (created by air pre-oxidation at 200 °C for 15 h) and FeCl3 (1 wt%, 3 wt%, and 6 wt%) has provided a good control of micro- and macro-structure of Jixi bituminous char throughout the preparation process to obtain the ideal AC production with a high SBET at low burn-off values. In the phase of pyrolysis, the existence of oxygen functional groups could improve the distributed formation of FeCl3 catalyst in the interior of the particle, hindering the concentration and amalgamation of FeCl3 catalyst at high temperatures and promoting the catalytic characteristics. The effects of oxygen functional groups and FeCl3 catalyst could further promote the disordered conversion of microstructure and the number of active sites, but catalytic cracking characteristics of the FeCl3 catalyst could play a more important role. In addition, FeCl3 could efficaciously promote the development of micropores, and the evolution of oxygen functional groups mainly facilitated the production of mesopores and macropores. In the phase of activation, the reaction pathway of active sites and activated gas was changed by the presence of the FeCl3 catalyst; this resulted in a consistent disordered conversion of the microstructure of 1FeJXO15-800H, 3FeJXO15-800H, and 6FeJXO15-800H as compared to the ordered conversion of JX-800. The effects of oxygen functional groups and FeCl3 catalyst could promote the favorable diffusion of activated gas throughout more initial pores produced by oxygen functional groups, following non-hierarchical development. With an increase in activation time, the existence of FeCl3 catalyst could facilitate the etching of the carbon structure; this resulted in a rapid and continuous development of the micropores rather than the severe carbon losses on the particle surface. Finally, the SBET values (1045.43, 1274.64, and 916.23 m2 g−1) of 1FeJXO15-800H-22.9, 3FeJXO15-800H-22.5, and 6FeJXO15-800H-22.1 were obtained, indicating the high SBET/burn-off ratio values of 45.65 m2 g−1/%, 56.65 m2 g−1/%, and 41.46 m2 g−1/%, respectively, as compared to the relatively low SBET 564.19 m2 g−1 of JX-800-58.2, indicating a low SBET/burn-off ratio value of 9.69 m2 g−1/%.Conflicts of interest
There are no conflicts of interest to declare.Acknowledgements
The authors greatly acknowledge the financial support received from the research project supported by the National Natural Science Foundation of China (51276052) and (51476047).References
- F. Sun, J. H. Gao, X. Liu, X. F. Tang and S. H. Wu, Appl. Surf. Sci., 2015, 357, 1895–1901 CrossRef CAS.
- S. Shu, J. X. Guo, X. L. Liu, X. J. Wang, H. Q. Yin and D. M. Luo, Appl. Surf. Sci., 2016, 360, 684–692 CrossRef CAS.
- B. Rubio and M. T. Izquicrdo, Fuel, 1998, 77, 631–637 CrossRef CAS.
- A. A. Lizzio and J. A. Debarr, Fuel, 1996, 75, 1515–1522 CrossRef.
- H. Teng, J. A. Ho and Y. F. Hsu, Carbon, 1997, 35, 275–283 CrossRef CAS.
- H. Teng, J. A. Ho, Y. F. Hsu and C. T. Hsieh, Ind. Eng. Chem. Res., 1996, 35, 4043–4049 CrossRef CAS.
- B. A. Akash and W. S. OBrien, Int. J. Eng. Res., 1996, 20, 913–922 CAS.
- G. San Miguel, G. D. Fowler and C. J. Sollars, Carbon, 2003, 41, 1009–1061 CrossRef CAS.
- Y. W. Zhu, J. H. Gao, Y. Li, F. Sun, J. M. Gao, S. H. Wu and Y. K. Qin, J. Taiwan Inst. Chem. Eng., 2012, 43, 112–119 CAS.
- Y. W. Zhu, J. H. Gao, Y. Li, F. Sun and Y. K. Qin, Korean J. Chem. Eng., 2011, 28, 2344–2350 CrossRef CAS.
- X. X. Zhou, X. Qu, R. Zhang and J. C. Bi, Fuel Process. Technol., 2015, 135, 195–202 CrossRef CAS.
- P. L. Walker, Carbon, 1996, 34, 1297–1299 CrossRef CAS.
- M. M. Maroto-Valer, J. M. Andrés and C. Snape, Energy Fuels, 1997, 11, 4036–4042 Search PubMed.
- K. Kidena, K. Matsumoto, S. Murata and M. Nomura, Energy Fuels, 2004, 18, 1709–1715 CrossRef CAS.
- X. J. Li, J. I. Hayashi and C. Z. Li, Fuel, 2006, 85, 1509–1517 CrossRef CAS.
- G. de la Puente, G. Marbán, E. Fuente and J. J. Pis, J. Anal. Appl. Pyrolysis, 1998, 44, 205–218 CrossRef CAS.
- F. Heras, N. Alonso, M. A. Gilarranz and J. J. Rodriguez, Ind. Eng. Chem. Res., 2009, 48, 4664–4670 CrossRef CAS.
- F. Heras, N. Alonso-Morales, D. Jiménez-Cordero, M. A. Gilarranz and J. J. Rodriguez, Ind. Eng. Chem. Res., 2012, 51, 2609–2614 CrossRef CAS.
- D. Jiménez-Cordero, F. Heras, N. Alonso-Morales, M. A. Gilarranz and J. J. Rodriguez, Chem. Eng. J., 2013, 231, 172–181 CrossRef.
- D. Jiménez-Cordero, F. Heras, N. Alonso-Morales, M. A. Gilarranz and J. J. Rodriguez, Fuel Process. Technol., 2014, 118, 148–155 CrossRef.
- D. Jiménez-Cordero, F. Heras, M. A. Gilarranz and E. Raymundo-Piñero, Carbon, 2014, 71, 127–138 CrossRef.
- D. D. Liu, J. H. Gao, Q. X. Cao, S. H. Wu and Y. K. Qin, Energy Fuels, 2017, 31, 1406–1415 CrossRef CAS.
- Y. Q. Wu, J. J. Wang, S. Y. Wu, S. Huang and J. S. Gao, Fuel Process. Technol., 2011, 92, 523–530 CrossRef CAS.
- S. J. Yuh and E. E. Wolf, Fuel, 1983, 62, 252–255 CrossRef CAS.
- D. W. McKee, Fuel, 1983, 62, 170–175 CrossRef CAS.
- I. L. C. Freriks, H. M. H. VanWechem and J. C. M. Freriks, Fuel, 1981, 60, 463–470 CrossRef CAS.
- D. D. Liu, J. H. Gao, S. H. Wu and Y. K. Qin, RSC Adv., 2016, 6, 87478–87485 RSC.
- W. C. Xu and A. Tomita, Fuel Process. Technol., 1989, 21, 25–37 CrossRef CAS.
- N. A. Oztas and Y. Yürüm, Fuel, 2000, 79, 1221–1227 CrossRef CAS.
- X. Z. Gong, Z. C. Guo and Z. Wang, Energy Fuels, 2009, 23, 4547–4552 CrossRef CAS.
- G. A. Zickler, B. Smarsly, N. Gierlinger, H. Peterlik and O. Paris, Carbon, 2006, 44, 3239–3246 CrossRef CAS.
- X. J. Li, H. Jun-ichiro and C. Z. Li, Fuel, 2006, 85, 1700–1707 CrossRef CAS.
- K. B. Yang, J. H. Peng, H. Y. Xia, L. B. Zhang, C. Srinivasakannan and S. H. Guo, J. Taiwan Inst. Chem. Eng., 2010, 41, 367–372 CrossRef CAS.
- M. Belhachemi, R. V. R. A. Rios, F. Addoun, J. Silvestre-Albero, A. Sepúlveda-Escribano and F. Rodrìguez-Reinoso, J. Anal. Appl. Pyrolysis, 2009, 86, 168–172 CrossRef CAS.
- R. Pietrzak, Fuel, 2009, 139, 1871–1877 CrossRef.
- N. Karatepe, Ì. Orbak, R. Yavuz and A. Özyuğuran, Fuel, 2008, 87, 3207–3215 CrossRef CAS.
- H. Mori, K. Asami and Y. Ohtsuka, Energy Fuels, 1996, 10, 1022–1027 CrossRef CAS.
- Y. Ohtsuka, T. Watanabe, K. Asami and H. Mori, Energy Fuels, 1998, 12, 1356–1362 CrossRef CAS.
- Y. Ohtsuka, C. B. Xu, D. P. Kong and N. Tsubouchi, Fuel, 2004, 83, 685–692 CrossRef CAS.
- W. Li and Y. M. Zhu, Energy Fuels, 2014, 28, 3645–3654 CrossRef CAS.
- K. Murakami, H. Shirato, J. I. Ozaki and Y. Nishiyama, Fuel Process. Technol., 1996, 46, 183–194 CrossRef CAS.
- L. H. William and B. Michel, Fuel, 1983, 62, 132–165 Search PubMed.
- T. Li, L. Zhang and D. Li, Fuel, 2014, 117, 1190–1195 CrossRef CAS.
- C. D. Sheng, Fuel, 2007, 86, 2316–2324 CrossRef CAS.
- A. Sasezky, H. Muckenhuber and H. Grothe, Carbon, 2005, 43, 1731–1742 CrossRef.
- H. L. Tay and C. Z. Li, Fuel Process. Technol., 2010, 91, 800–804 CrossRef CAS.
- H. L. Tay, S. Kajitani, S. Zhang and C. Z. Li, Fuel, 2013, 103, 22–28 CrossRef CAS.
- X. Guo, L. T. Hui, S. Zhang and C. Z. Li, Energy Fuels, 2008, 22, 4034–4038 CrossRef CAS.
Footnote |
| † Electronic supplementary information (ESI) available. See DOI: 10.1039/c7ra12928a |
| This journal is © The Royal Society of Chemistry 2018 |

