 Open Access Article
A UV-visible absorption spectrum denoising method based on EEMD and an improved universal threshold filter
Jingwei Li,
Yifei Tong,
Li Guan,
Shaofeng Wu and
Dongbo Li *
*
School of Mechanical Engineer, Nanjing University of Science and Technology, Nanjing, 210014, P. R. China. E-mail: L.Guan@njust.edu.cn
First published on 23rd February 2018
Abstract
When using ultraviolet-visible spectroscopy (UV-visible spectroscopy) to detect water quality parameters, the measured absorption spectrum signal often contains a lot of interference information. Therefore, denoising is extremely important in spectrum data processing and analysis, which directly affects the subsequent quantitative analysis and information mining. Choosing an appropriate denoising method is key to improve the spectral analysis accuracy and promote the spectral analysis ability. In this paper, a new UV-visible absorption spectrum denoising method is proposed: a denoising method based on ensemble empirical mode decomposition (EEMD) and improved universal threshold filtering (EEMD-based method). The noisy UV-visible absorption spectrum signal is firstly decomposed into a finite set of band limited signals called intrinsic mode functions (IMFs) via EEMD. Spearman's rank correlation coefficient (Spearman's rho) is then used as a criterion for the IMFs dominated by noise or useful signals, and the improved universal threshold filtering method is applied to the noise dominant IMFs to eliminate the noise. Finally, the denoised UV-visible absorption spectrum signal is reconstructed. In order to discuss the effectiveness of the EEMD-based denoising method proposed in this paper, we compare it with various wavelet-based threshold denoising methods. Both methods have been implemented on synthetic signals with diverse waveforms (‘Blocks’, ‘Bumps’ and ‘Heavy sine’). It is demonstrated that the proposed method outperforms the wavelet-based methods. Then, the measured UV-visible absorption spectra with different SNR were denoised by the wavelet and proposed methods. The method proposed also performs well in the spectrum denoising experiment.
1. Introduction
UV-visible spectroscopy to detect water quality parameters has the advantages of fast detection, low cost, no secondary pollution, online in situ measurement and so on. In recent years, it has been widely researched in many reports.1,2 By modeling the UV-visible absorption spectrum of the tested water, the water quality parameters can be analyzed. Measured UV-visible absorption spectrum data of water samples often exhibit interference caused by a low-frequency baseline and high-frequency noise. The former (the low-frequency baseline) is affected by the scattering of particles in the measurement and can be removed by multivariate scatter correction. While the latter (the high-frequency noise) is mainly caused by the light source, light path and spectral detection equipment. The main performance is constantly changing non-stationary signal in the real-time measurement, usually called noise. The existence of noise will affect the extraction of useful information in spectral analysis, which will seriously affect the prediction accuracy and stability of the established water quality parameter prediction model. Therefore, the spectrum data need to be pre-processed before the feature extraction to remove the high frequency noise. Denoising effect is great significance to the prediction accuracy of the established spectral model.Fourier transform is a basic denoising method, which has a good effect on stationary signals, but cannot deal with non-stationary signals and singular signals.3,4 In order to overcome this shortcoming, some nonlinear denoising methods are proposed such as wavelet denoising based on wavelet transform (wavelet-based) and empirical mode decomposition (EMD) based denoising method (EMD-based).5–7 Wavelet analysis can analyze nonlinear and non-stationary signals due to the good characteristics of time-frequency analysis. However, wavelet-based threshold denoising methods can be affected by some factors such as the threshold function and threshold selection rule, wavelet, and level, which results in poor self-adaptability. Different wavelet bases and decomposition levels will affect the subsequent feature extraction, which has a great impact on the denoising effect of signals.8 EMD is also a time–frequency analysis method with the advantages of wavelet transform and can better deal with non-linear and non-stationary signals. It has strong self-adaptability, which can avoid the difficulty of parameters selection in wavelet transform, and plays an important role in signal denoising.9,10 However, the EMD method often produces the severe mode mixing (modal aliasing) problems in the decomposition process, which will affect the denoising results and bring unpredictable impact on subsequent analysis.11,12
Most of the studies combine EMD and wavelet threshold filtering. By using the adaptive decomposition of EMD, a series of IMFs are obtained to overcome the difficulty of parameters selection in wavelet transform. Then, wavelet threshold filtering is used to denoise for IMFs. Tang used the EMD to electrocardiogram (ECG) which can be decomposed into a limited number of IMFs. Different thresholds are used to treat IMFs to achieve denoising and then compared with the effect of wavelet transform denoising. The EMD-based method is demonstrated to be effective in removing the general noise of ECG.13 Hamid proposed a speech enhancement algorithm using data adaptive soft-threshold techniques. The noisy speech signal is decomposed into a series of IMFs using EMD. Each IMF is divided into fixed length subframes. Based on noise contamination, the subframes are divided into two groups: noise-dominated and speech-dominated. Only noise-dominated subframes are thresholded for denoising. A data adaptive threshold function is calculated based on the variance of each IMF. The simulation results show that compared with other speech denoising methods, the algorithm has noticeable efficiency.14 Mert proposed a metric based on detrended fluctuation analysis (DFA) to define a robust threshold. The presented DFA threshold and denoising by DFA–EMD are tested on different synthetic and real signals at various signal to noise ratios (SNRs). The presented method outperforms soft and hard wavelet threshold method.15 Wu proposed a piecewise EMD threshold approach to denoise mixtures with strong noise. This method can distinguish between noise-dominated IMFs and signal-dominated IMFs, and then apply different threshold methods respectively. The simulation results show that this method has better denoising performance than wavelet denoising and can significantly improve the separation performance of Blind Source Separation (BSS) algorithm. Especially when the signal SNR is low.16 However, these studies do not solve the problem of mode mixing in the EMD algorithm.
In order to overcome this shortcoming of modal aliasing, Wu and Huang proposed EEMD.17 EEMD uses the EMD method as its core, inherits the advantages of the EMD method and successfully resolves the modal aliasing problem by adding white noise to the original signal. It shows strong superiority in the non-linear and non-stationary signal analysis, which has been widely used in various fields.18,19 Mariyappa adopt the EEMD method, with an appropriate thresholding on the IMFs, to denoise the magnetocardiography (MCG) signal. It shows that the EEMD method used for denoising and the elimination of baseline drift is superior in performance to other standard methods such as wavelet based techniques and Independent Component Analysis (ICA).20 Zhou proposed an adaptive denoising method based on EEMD and interval-thresholding method, which can achieve good signal denoising effect. Firstly, the research signal is decomposed into IMFs via EEMD adaptively. Then, each IMF is denoised by the interval threshold method based on the sparse code shrinkage. Finally, the denoised signal is reconstructed by denoised IMFs. The effectiveness of this method is verified by numerical experiments.21 Nguyen proposed an adaptive denoising methodology for electrocardiogram (ECG) signals that employs EEMD and a genetic algorithm (GA)-based thresholding technique. Experimental results indicate that the proposed denoising method outperforms other denoising methodologies in terms of signal-to-noise ratio, mean square error, and percent root mean square difference.22 Han developed a new seismic denoising method based on a combination of EEMD and adaptive thresholding. A signal was decomposed into a series of IMFs. Each decomposed signal was then compared with those IMFs resulting from a white-noise realization to determine if the original signal contained structural features or white noise only. The threshold scheme is then used to remove all non-structured portions. The scheme is very flexible and suitable for a variety of domains or in a diverse set of data. It has determined its potential for micro-seismic and reflection seismic denoising by comparing its performance on synthetic and field data using a variety of methods.23 Wang proposed a modified interval thresholding method, which could be adjustable for IMFs from EEMD. The EEMD-based denoising methods are proposed by combining the modified interval thresholding and the iterations. The denoising results on synthetic and real-life signals indicate that the presented method exhibits better performance comparing with the EMD-based method, especially for signals with low signal-to-noise ratio.24 These EEMD-based denoising methods, while achieving good denoising effect in other fields, are rare in the denoising of the UV-visible absorption spectrum. Therefore, the proposed denoising method in this paper is of great significance in the UV-visible absorption spectrum denoising.
This paper presents a denoising method based on EEMD and an improved universal threshold filtering. By using this EEMD-based method and wavelet-based methods to denoise synthetic signals, the effectiveness of the proposed method in this paper is verified. Then the EEMD-based method proposed in this paper is used to denoise the measured UV-visible absorption spectrum signals with different SNR, and the denoised spectra are obtained. The rest of this paper is organized as follows. In Section 2, the basic theory of EEMD is briefly introduced. Section 3 proposes a denoising method based on EEMD and an improved universal threshold filtering. In Section 4, first of all, we experiment and analyze many kinds of synthetic signals by using the proposed EEMD-based method and wavelet-based denoising methods. Verify the denoising performance of EEMD-based method presented in this paper. Then the method is used to the UV-visible absorption spectra with different SNR denoising, also made a very good noise removal effect. Finally, the conclusions are given in Section 5.
2. EEMD theory
EMD is an adaptive nonlinear signal decomposition method, but the drawback of modal aliasing exists in IMFs when EMD. In order to solve the modal aliasing problem, Huang proposed EEMD, which is based on EMD.25–27 The use of Gaussian white noise with a uniform frequency distribution of statistical properties. The Gaussian white noise is added to the original signal multiple times, in order to smooth the influence of singularity points. It ensures the signal continuity at different scales and helps to avoid the modal aliasing of the EMD. And average the results of multiple decomposition. Making the white noise offset and leaving physically meaningful IMFs.The specific steps of EEMD algorithm are as follows:
Step (1) Add the equal length random Gaussian white noise n(t) to the original signal x(t), and the mean value of white noise is zero and the variance is constant. A new white noise signal sequence x′(t) is obtained, which is:
| x′(t) = x(t) + n(t) | (1) |
Step (2) The white noise signal sequence x′(t) is decomposed via EMD to obtain a series of IMFs and one residual r(t), which can be expressed as eqn (2):
 | (2) |
Step (3) Each time a different white noise n(t) is added, repeating step (1) and (2) m times, and obtain eqn (3):
 | (3) |
Step (4) The corresponding IMFs and residual components obtained from m times decomposition are averaged to remove the added white noise. This is the final result of the EEMD of the target signal:
 | (4) |
 | (5) |
After removing the added white noise, the original signal x(t) can be expressed as eqn (6):
 | (6) |
This paper, the standard deviation (n(t)) of Gaussian white noise and the number of additions (m) are defined as 0.4 and 100 respectively.
3. Method
Noise dominant IMFs separation based on Spearman's rho
In order to get the boundary position Kth of the noise dominant IMFs and the signal dominant IMFs, the Spearman's rho method is adopted to conduct noise dominant IMFs separation in this paper.28,29 The signal is decomposed by EEMD into several IMFs and one residual. The signal dominant IMFs have more similar features with the original signal, while the noise dominant IMFs have less. In this paper, the Spearman's rho is utilized to calculate the similarity between each IMF and the original signal. The Spearman's rho between IMFs and the original signal is between [−1,+1]. The bigger the coefficient value, the more similar to the original signal is. Let X = (x1,x2,…,xn)Tand Y = (y1,y2,…,yn)T be a N-dimensional column vector, the Spearman's rho for X and Y can be calculated by eqn (7).
 | (7) |
The similarity between the noisy signal x(t) and its IMFk (k = 1,2,…,n) decomposed by EEMD is defined as eqn (8):
| s(k) = ρ(x(t), IMFk(t)) | (8) |
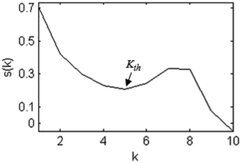
The principle of ascertaining Kth is to find the location where the correlation coefficient turns in the opposite direction. It is the cut-off point of the similarity between IMFs and the original signal which is from gradual decrease to gradual increase. So the Kth can be determined as the first minimum of the curve s(k).
In order to illustrate the effectiveness of the proposed Kth, use the function X = wnoise (FUN, N) in MATLAB R2013a to generate a ‘Doppler’ signal with a signal length of N = 2048 (Samples). Then add a SNR of 5 dB noise to the signal through the function Y = awgn (X, SNR).
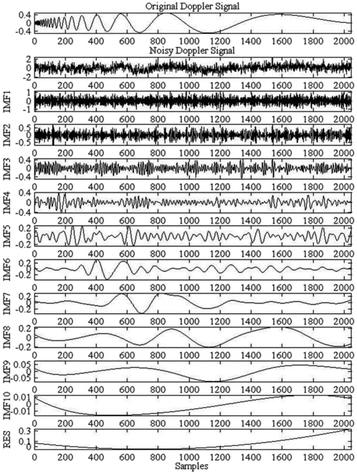
The noisy ‘Doppler’ signal is decomposed into 10 IMFs and one residual via EEMD, as shown in Fig. 1. The similarity relation curve s(k) between each IMF and the original noisy ‘Doppler’ signal is shown in Fig. 2. As can be seen from Fig. 1, the noise from layer 6 of the IMFs is significantly reduced. As can be seen from Fig. 2, according to the proposed determination method, Kth = 5. It shows that IMF6–IMF10 are signal dominant IMFs and IMF1–IMF5 are the noise dominant IMFs. It can also be seen, after the IMF with the lowest similarity to the observed signal, the similarity will rise. This is because the amplitude of the signal in IMF1–IMF5 is small, which reflects the trend of the noise part. The similarity between IMFi (i = 1,2,…,5) and the noise in the noisy ‘Doppler’ signal gradually decreases.
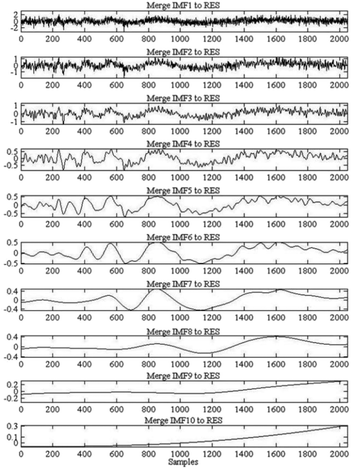
In order to further confirm the effectiveness of the method that determines the Kth. The next IMFs and RES in a layer-by-layer manner are merged from the first IMF to obtain a preliminary denoising signal, as shown in Fig. 3.
To quantify and compare the initial denoised signal of merged IMFi–RES, the signal-to-noise ratio (SNR) and root-mean-square error (RMSE) of the denoised signal and the original signal are selected as evaluation indexes for denoising performance. The calculation results are shown in Table 1. The bigger the SNR, the smaller the RMSE is, indicating that the denoising effect is better. The mathematical expressions of the SNR and RMSE are shown in eqn (9) and (10).
 | (9) |
 | (10) |
![[x with combining circumflex]](https://www.rsc.org/images/entities/i_char_0078_0302.gif) (t) is denoised reconstructed signal, and N is the signal length.
(t) is denoised reconstructed signal, and N is the signal length.
| IMFi–RES | IMF1–RES | IMF2–RES | IMF3–RES | IMF4–RES | IMF5–RES | IMF6–RES | IMF7–RES | IMF8–RES | IMF9–RES | IMF10–RES |
|---|---|---|---|---|---|---|---|---|---|---|
| SNR/dB | −5.8949 | −1.7325 | 1.6775 | 4.5831 | 7.0840 | 8.7866 | 6.1549 | 3.8792 | 1.1292 | 0.4662 |
| RMSE | 0.5775 | 0.3576 | 0.2415 | 0.1728 | 0.1296 | 0.1065 | 0.1442 | 0.1874 | 0.2572 | 0.2776 |
As can be seen from Fig. 3, when merging IMF6–RES, the output signal of the noise component becomes significantly less when maintaining the signal details. In addition, it can be seen in Table 1 that the SNR of the denoised signal obtained is the biggest, and the RMSE is the smallest. In this case, the denoised signal is closest to the original signal. It shows that using the Spearman's rho method to determine Kth in this paper, we can precisely find the boundary position of signal dominant IMFs and noise dominant IMFs.
An improved universal threshold processing
The threshold filtering denoising method has become one of the most widely used denoising methods due to its ease of design and implementation.30 The operation steps are: firstly, the signal to be processed is decomposed into IMFs with different scales via EEMD. Then, the coefficients in the noise dominant IMFk(k = 1,2,…,Kth) are thresholded by the corresponding threshold λk to obtain the processed . Finally, reconstruct
  and IMFKth+1–RES get the denoised signal. The core of threshold filtering is the choice of threshold. Threshold selection is too small can not effectively filter out noise, and the threshold is too big will lose useful information. In threshold selection rules, the universal threshold rule is widely used. However, the denoising effect is not satisfactory and the useful information is lost by this method. Therefore, this paper presents an improved universal threshold rule. The universal threshold is improved based on the similarity between the IMFk(k = 1,2,…,Kth) and the original signal. The specific mathematical expressions are as eqn (11) and (12):
| λ′ = Cλ | (11) |
 | (12) |
 is the standard deviation of the noise, x is the signal to be denoised, λ is the universal threshold, and λ′ is the improved universal threshold proposed in this paper.
As can be seen from Fig. 1 and 2, the real signal contained in IMF1–IMFKth gradually increases, the noise gradually decreases, and IMF1 contains most of the noise. Therefore, when filtering the IMF1, a relatively big threshold should be selected. The coefficient C is constructed according to the Spearman's rho between the IMF1 and the original signal, as C = 1 + ρ. Thus, the threshold λ′ can be used to maximum the noise removal from IMF1. However, since the universal threshold λ is also gradually decreases with IMF1–IMFKth, in order to maintain the balance between the denoising and the preservation of useful information in IMF2–IMFKth, the relatively small thresholds should be selected. Referencing the Spearman's rho, take C = 1 − ρ. Thus it can be guaranteed that the thresholds decrease with the layers increase of IMF1–IMFKth. And this will ensure the maximum noise removal and effective signal retention. Combining eqn (7), (11) and (12), We can get the improved universal threshold rule of each noise dominant IMF proposed in this paper, as shown in eqn (13).
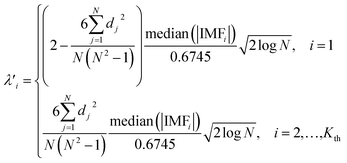 | (13) |
After determining the threshold, a threshold function is needed to filter the noise dominant IMFs to remove the noise. Commonly used threshold functions are hard threshold and soft threshold functions, which have been researched in many reports.31,32 The overall continuity of the denoising signal obtained by the soft threshold function is good, and the reconstructed signal will not generate additional oscillations. However, due to the compression of the signal, the denoised signal will have a certain deviation, which directly affects the approximation degree of the denoised signal to the real signal. The hard threshold function will generate additional oscillations and jump points, and do not have the smoothness of the original signal. However, it is better than the soft threshold in mean square error (MSE) and can maintain the authenticity of the original signal to the maximum extent. In this paper, in order to maintain the real features of the spectral signal, the hard threshold function is used to filter to denoise.
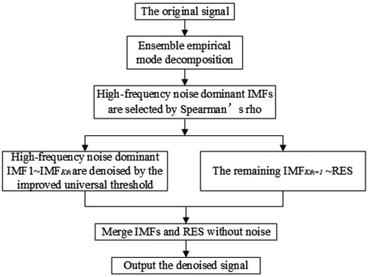
(1) The original signal is decomposed by EEMD to obtain a series of IMFs.
(2) Noise dominant IMFs are selected by Spearman's rho.
(3) The noise dominant IMFs are filtered by the hard threshold function using the improved universal threshold proposed in this paper.
(4) The filtered noise dominant IMFs and original signal dominant IMFs are reconstructed to get the denoised signal.
The specific flow of the proposed denoising algorithm based on EEMD and the improved universal threshold is shown in Fig. 4.
4. Experiment and results analysis
In order to analyze the performance of the proposed EEMD-based denoising method, two denoising experiments are made by MATLAB R2013a. One is to denoise the noisy ‘Blocks’, ‘Bumps’ and ‘Heavy sine’ signals, and the other is to denoise the measured noisy UV-visible absorption spectrum signal. Besides the wavelet-based denoising method is compared with the proposed method. Research in some references shows that the denoising effects for the synthetic signals are ideal as a whole when ‘db5’ is chosen as the wavelet basis function and the decomposition level is defined as 5. The hard threshold function can better maintain the real features of the spectrum signal.33–36 Therefore, db5 is selected as the wavelet basis and the number of decomposition level is defined as 5 in this paper. Hard threshold function is selected for threshold processing. The thresholds are respectively selected by four threshold selection rules: ‘rigrsure’, ‘heursure’, ‘sqtwolog’ (universal) and ‘minimaxi’.37 In the EEMD-based method proposed in this paper, the noise standard deviation of the white noise added to EEMD is set to 0.4 and the number of repetitions is set to 100. According to the noise reduction algorithm in Fig. 4, the experiment is carried out. The SNR and RMSE of the denoised signal are compared and analyzed with the wavelet-based methods and the proposed method.Synthetic signals denoising process and result analysis
The ‘Blocks’, ‘Bumps’ and ‘Heavy sine’ signals with signal length (Samples) N = 2048 are generated using the X = wnoise (FUN, N) function in MATLAB R2013a. The signals are then added noise with a SNR of 5 dB using the Y = awgn (X, SNR) function. Wavelet-based methods and the proposed EEMD-based method are used to denoise experiments. The experiment was repeated ten thousand times for statistical analysis of SNR and RMSE respectively. The statistical analysis results (mean and standard deviation) of SNR and RMSE are presented in Table 2.| Method | Signals | |||||||||||
|---|---|---|---|---|---|---|---|---|---|---|---|---|
| Blocks | Bumps | Heavy sine | ||||||||||
| SNR | RMSE | SNR | RMSE | SNR | RMSE | |||||||
| Mean | Std | Mean | Std | Mean | Std | Mean | Std | Mean | Std | Mean | Std | |
| Wavelet rigrsure | 19.5687 | 0.3665 | 0.3121 | 0.0124 | 14.3837 | 0.2336 | 0.3436 | 0.0052 | 22.5598 | 0.5511 | 0.2293 | 0.0093 |
| Wavelet heursure | 20.0589 | 0.1207 | 0.2949 | 0.0056 | 19.0987 | 0.2604 | 0.1997 | 0.0067 | 26.4509 | 0.2800 | 0.1468 | 0.0047 |
| Wavelet sqtwolog | 17.6594 | 0.1706 | 0.3888 | 0.0061 | 17.1008 | 0.1376 | 0.2508 | 0.0073 | 26.3016 | 0.2696 | 0.1494 | 0.0045 |
| Wavelet minimaxi | 19.5629 | 0.2443 | 0.3092 | 0.0100 | 16.0763 | 0.1540 | 0.2823 | 0.0043 | 22.0292 | 0.4288 | 0.2351 | 0.0068 |
| EEMD-based | 20.2108 | 0.1350 | 0.2900 | 0.0065 | 18.8137 | 0.1405 | 0.2037 | 0.0061 | 27.0598 | 0.1520 | 0.1371 | 0.0057 |
It can be seen from Table 2 that when the noise with SNR of 5 dB is added. After ‘Blocks’ and ‘Heavy sine’ signals are denoised by wavelet-based methods and the proposed EEMD-based method. The method proposed in this paper has the biggest mean of SNR (20.2108 and 27.0598 respectively) and the smallest mean of RMSE (0.2900 and 0.1371 respectively). Therefore, the EEMD-based method proposed in this paper has the best performance on denoising of these two signals. After the ‘Bumps’ signal is denoised by wavelet-based methods and the method proposed in this paper. The mean of SNR (18.8137) and RMSE (0.2037) of the EEMD-based method are superior to the ‘Wavelet Rigrsure’, ‘Wavelet Sqtwolog’ and ‘Wavelet Minimaxi’ methods. However, compared with the ‘Wavelet Heursure’ method, the proposed method is a bit weaker. The mean of SNR is smaller by 0.2850 and RMSE is bigger by 0.0040, but the difference is not big. Therefore, on the whole, the EEMD-based method proposed in this paper is still successful in denoising the synthetic signals ‘Blocks’, ‘Bumps’ and ‘Heavy sine’ with the SNR of 5 dB noise.
In addition, the relatively low values of the standard deviation are reached by the proposed method. The maximum standard deviation and the minimum standard deviation of SNR are 0.1520 and 0.1350 respectively. The maximum standard deviation and the minimum standard deviation of RMSE are 0.0065 and 0.0057 respectively. Compared with other methods, the standard deviation of SNR and RMSE of the method proposed in this paper is relatively small. The range of them is also small. Therefore, the method proposed in this paper can obtain more stable denoising results. Through the analysis, we can draw a conclusion that the denoising method proposed in this paper can effectively remove the noise in the synthetic signal (SNR = 5 dB).
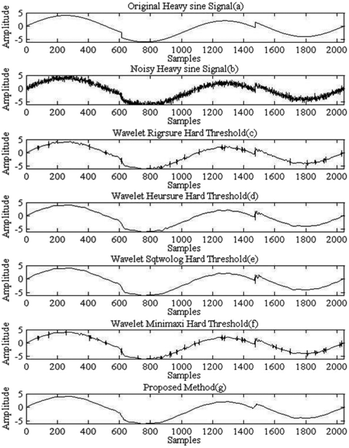
The effectiveness of wavelet-based methods and the proposed EEMD-based method on a certain noise removal of the ‘Heavy sine’ signal is shown in Fig. 5.
As can be seen from Fig. 5. The wavelet-based methods and proposed EEMD-based method in this paper basically eliminate the high frequency noise in the noisy ‘Heavy sine’ signal. All have a significant inhibitory effectiveness on noise. However, the local range of the signal denoised by the wavelet-based methods has deformities and jumps, resulting in partial distortion of the waveform. The proposed EEMD-based method effectively filters out the high frequency noise in the signal. There is no non-normal mutation in the signal, when preserve the details and smoothing of the signal. This method has obvious advantages in ‘Heavy sine’ signal denoising.
Afterward, the experiment is repeated for adding noise with a set of SNR values (−5 dB, 0 dB, 10 dB). Using wavelet-based denoising methods and the denoising method proposed in this paper, the statistical analysis results (mean and standard deviation) of SNR and RMSE are shown in Table 3, Table 4 and Table 5 respectively.
| Method | Signals | |||||||||||
|---|---|---|---|---|---|---|---|---|---|---|---|---|
| Blocks | Bumps | Heavy sine | ||||||||||
| SNR | RMSE | SNR | RMSE | SNR | RMSE | |||||||
| Mean | Std | Mean | Std | Mean | Std | Mean | Std | Mean | Std | Mean | Std | |
| Wavelet rigrsure | 10.8135 | 0.3986 | 0.8559 | 0.0616 | 8.9014 | 0.4259 | 0.6460 | 0.0699 | 8.6732 | 0.2217 | 1.1368 | 0.0344 |
| Wavelet heursure | 13.4350 | 0.3034 | 0.6570 | 0.0488 | 10.6293 | 0.3229 | 0.5297 | 0.0511 | 17.2103 | 0.2365 | 0.4254 | 0.0375 |
| Wavelet sqtwolog | 12.7658 | 0.3241 | 0.6829 | 0.0218 | 10.5425 | 0.3130 | 0.5360 | 0.0170 | 18.7352 | 0.4526 | 0.3573 | 0.0200 |
| Wavelet minimaxi | 11.0695 | 0.2614 | 0.8307 | 0.0228 | 7.5452 | 0.5412 | 0.7552 | 0.0420 | 11.8795 | 0.1925 | 0.7864 | 0.0147 |
| EEMD-based | 13.3142 | 0.2843 | 0.6390 | 0.0234 | 10.7152 | 0.2931 | 0.5236 | 0.0246 | 19.7859 | 0.2891 | 0.3161 | 0.0215 |
| Method | Signals | |||||||||||
|---|---|---|---|---|---|---|---|---|---|---|---|---|
| Blocks | Bumps | Heavy sine | ||||||||||
| SNR | RMSE | SNR | RMSE | SNR | RMSE | |||||||
| Mean | Std | Mean | Std | Mean | Std | Mean | Std | Mean | Std | Mean | Std | |
| Wavelet rigrsure | 14.5201 | 0.2662 | 0.5580 | 0.0117 | 12.0078 | 0.3792 | 0.4518 | 0.0126 | 17.3807 | 1.1165 | 0.4171 | 0.0290 |
| Wavelet heursure | 16.7988 | 0.1524 | 0.4294 | 0.0073 | 16.1506 | 0.2565 | 0.2804 | 0.0084 | 22.9615 | 0.2918 | 0.2193 | 0.0067 |
| Wavelet sqtwolog | 15.9116 | 0.2221 | 0.4755 | 0.0012 | 14.8737 | 0.6785 | 0.3248 | 0.0268 | 24.0072 | 0.8302 | 0.1945 | 0.0191 |
| Wavelet minimaxi | 15.0218 | 0.1100 | 0.5266 | 0.0050 | 12.2186 | 0.1340 | 0.4411 | 0.0047 | 17.6207 | 0.4592 | 0.4056 | 0.0113 |
| EEMD-based | 17.1479 | 0.2587 | 0.4123 | 0.0054 | 15.3607 | 0.2438 | 0.3070 | 0.0051 | 24.0789 | 0.2892 | 0.1930 | 0.0058 |
| Method | Signals | |||||||||||
|---|---|---|---|---|---|---|---|---|---|---|---|---|
| Blocks | Bumps | Heavy sine | ||||||||||
| SNR | RMSE | SNR | RMSE | SNR | RMSE | |||||||
| Mean | Std | Mean | Std | Mean | Std | Mean | Std | Mean | Std | Mean | Std | |
| Wavelet rigrsure | 23.2176 | 0.3018 | 0.2049 | 0.0086 | 19.2513 | 0.3584 | 0.1961 | 0.0067 | 27.1195 | 1.0570 | 0.1359 | 0.0130 |
| Wavelet heursure | 24.5501 | 0.1310 | 0.1758 | 0.0058 | 21.8428 | 0.1384 | 0.1456 | 0.0033 | 30.7528 | 0.1451 | 0.0894 | 0.0019 |
| Wavelet sqtwolog | 21.9704 | 0.0565 | 0.2367 | 0.0030 | 21.8578 | 0.1879 | 0.1453 | 0.0067 | 30.4473 | 0.2152 | 0.0927 | 0.0029 |
| Wavelet minimaxi | 24.3902 | 0.1833 | 0.1790 | 0.0072 | 20.8900 | 0.2135 | 0.1624 | 0.0053 | 27.4397 | 0.2418 | 0.1310 | 0.0462 |
| EEMD-based | 23.4216 | 0.2060 | 0.2002 | 0.0056 | 24.0767 | 0.2362 | 0.1126 | 0.0048 | 31.3682 | 0.2280 | 0.0834 | 0.0045 |
As can be seen from the mean and standard deviation of the SNR and RMSE in Tables 3 to 5. It is essentially the same as the previous results. When adding noise with the SNR of −5 dB, 0 dB and 10 dB respectively, after wavelet-based methods and the proposed method of noise reduction. In most cases, the EEMD-based method denoising effect is more outstanding than wavelet-based methods denoising. There are only a few slightly worse cases. Therefore, on the whole, the method proposed in this paper is suitable for denoising of various waveform signals and various SNR signals. The proposed method can effectively remove the noise and preserve the useful information of the original signal effectively, which verifies the effectiveness of the denoising method proposed in this paper.
Measured absorption spectrum denoising process and results analysis
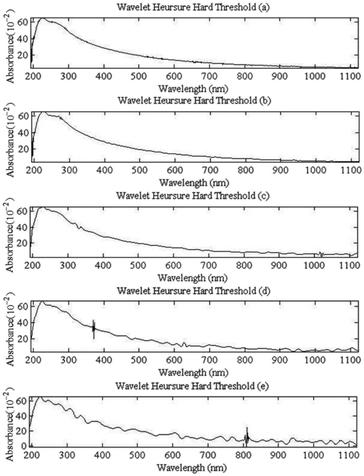 | ||
| Fig. 7 The absorption spectra (Fig. 6) are denoised by wabelet-based method. (a)–(e) Denoised absorption spectrum signals by the ‘Wavelet Heursure’ hard threshold. | ||
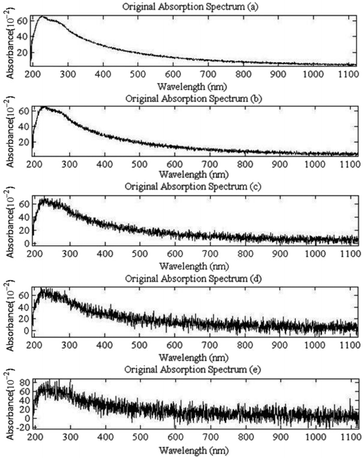
Because the noisy spectrum signals in Fig. 6 are actually collected in the experiment, so don't know the pure signal looks like. Therefore, in order to calculate the SNR and RMSE of the signal after denoising, we assume that the best spectrum signal (Fig. 8) collected in the experiment is pure spectrum signal without any noise. On this basis, the SNR and RMSE of the denoised spectrum are calculated. Thus, the denoising results of the two methods can be quantitative comparison.
According to the denoising method based on EEMD and the improved universal threshold filter proposed in this paper (The specific flow is shown in Fig. 4), the measured spectrum signals in Fig. 6 are denoised. They are first decomposed into 10 IMFs and one residual, as shown in Fig. 9. (The signal Fig. 6(d) decomposition results via EEMD which as an example.)
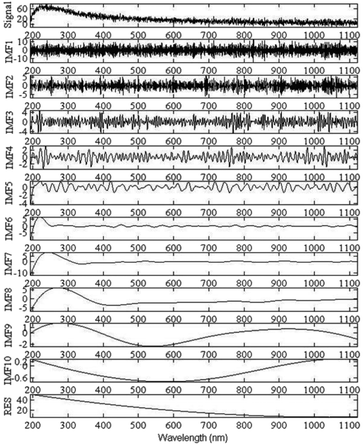 | ||
| Fig. 9 The UV-visible absorption spectrum signal (Fig. 6(d)) decomposition results via EEMD. | ||
The Spearman's rho of each IMF and the original absorption spectrum signal in Fig. 9 are calculated according to eqn (7) and (8). Fig. 10 is the drawn s(k) curve. From the figure can be identified as Kth is the demarcation point of high-frequency noise IMFs and low-frequency signal IMFs. Thus, IMF1–IMF4 are the high-frequency noise dominant IMFs, and IMF5–IMF10 are the low-frequency signal dominant IMFs. The noise dominant IMFs are filtered and denoised by the improved universal threshold (as shown in eqn (13)). The denoised spectrum signal is obtained, as shown in Fig. 11. Using the wavelet-based denoising method and the denoising method proposed in this paper, the SNR and RMSE are shown in Table 6.
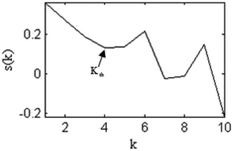 | ||
| Fig. 10 Curve of versus IMFs of the noisy UV-visible absorption spectrum signal (Fig. 6(d)). | ||
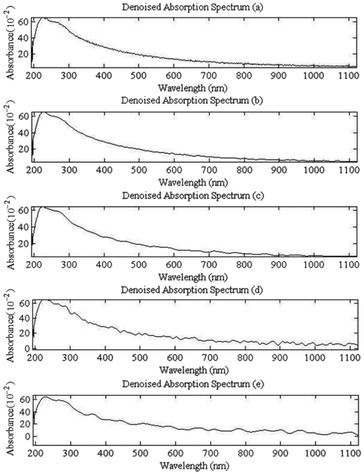 | ||
| Fig. 11 The absorption spectra (Fig. 6) are denoised by EEMD-based method. (a)–(e) Denoised absorption spectrum signals by the proposed method. | ||
| Method | Spectra (Fig. 6) | |||||||||
|---|---|---|---|---|---|---|---|---|---|---|
| a | b | c | d | e | ||||||
| SNR | RMSE | SNR | RMSE | SNR | RMSE | SNR | RMSE | SNR | RMSE | |
| Wavelet heursure | 38.2149 | 0.3077 | 35.1809 | 0.4363 | 29.0512 | 0.8837 | 24.6027 | 1.4748 | 20.3258 | 2.4131 |
| EEMD-based | 39.6512 | 0.2608 | 37.4899 | 0.3345 | 30.5519 | 0.7435 | 26.1046 | 1.2406 | 20.8630 | 2.2684 |
The denoising results (Fig. 7 and 11) of the wavelet method and the proposed method in this paper are compared. When the noise is less in the spectrum (Fig. 6(a) and (b)), the two methods can achieve good denoising effect. The spectrum after denoising is smooth and continuous, and there is no obvious jump change. When the noise contained in the spectrum is large (Fig. 6 (c)–(e)), the denoising result of the wavelet method filters out most of the high-frequency noise, but the signal after denoising has a significant mutation. The method proposed in this paper not only filters out most of the noise, at the same time, the spectral trend part and the mutation part are well preserved, and the detailed characteristics of the spectral signal are preserved effectively. Therefore, the method presented in this paper shows obvious advantages. The SNR and RMSE of the denoised spectra in Table 6 further illustrate that the method proposed in this paper is superior to the wavelet method.
Further analysis, the Fig. 6(a) and (b) signals have the best denoising effect because of the less noise, and the spectrum after denoising is very smooth, and the trace of the noise is hardly seen. The noise of Fig. 6(c)–(e) signals are more, although the denoised spectrum are smoothing and continuous, the burr noise is eliminated, but there are still remaining wavelets left behind. However, compared with the original signal, the noise has been obviously eliminated. Therefore, the denoising method based on EEMD decomposition and improved universal threshold filtering is effective in the denoising of UV visible spectrum.
5. Discussion
The proposed denoising method combines the advantages of adaptive decomposition of EEMD and strong filtering effectiveness of the improved universal threshold. EEMD can adaptively decompose the signal into a series of IMFs which frequency is arranged from high to low. Then, the improved universal threshold is used to filter the noise dominant IMFs, and the denoised signal is obtained. From the above experiment results for various synthetic signals can be clearly seen that the proposed method is significantly better than the wavelet-based denoising methods. The SNR is bigger of the denoised signal and the RMSE is smaller. It can be seen from the experiment of the absorption spectrum (Fig. 6) denoising. The proposed method effectively filters out the noise in different spectral signals and retains the effective information of the spectrum. The denoised spectral signals are smooth and continuous, preserving the essential characteristics of the original signals. Thus demonstrating the great potential of the proposed method for spectrum denoising.6. Conclusion
In order to improve the denoising effect of the measured UV-visible absorption spectrum signal, this paper presents a denoising method based on EEMD and an improved universal threshold filtering for the measured UV-visible absorption spectrum signal. In order to demonstrate the effectiveness of the proposed denoising method, the proposed denoising method and wavelet-based threshold denoising methods are used to experiment. Two kinds of methods (the proposed method and wavelet-based methods) are used to denoise for a variety of SNR (−5, 0, 5 and 10 dB) signals and diverse waveforms (‘Blocks’, ‘Bumps’ and ‘Heavy sine’). Experimental results show that the denoising method proposed in this paper is better than the wavelet-based denoising in most cases. Finally, the denoising method proposed is used to denoise the measured UV-visible absorption spectra with different SNR. The superiority of the proposed method is further demonstrated by the comparison with the wavelet method. It can be seen from the denoised spectra that the high frequency noise in the spectrum has been basically filtered out and the spectral details are well preserved. It proves that the denoising method based on EEMD and the improved universal threshold filter proposed in this paper can be effectively applied to the denoising of UV-visible absorption spectrum signal.Conflicts of interest
There are no conflicts to declare.Acknowledgements
This work was financially supported by National Key technology support program (2015BAF18B01) and the Jiangsu Provincial Six Talent Peaks Project (NO. 2015-ZBZZ-006). The supports are gratefully acknowledged. The authors would also acknowledge the Editor.References
- H. T. Carter, E. Tipping, J. F. Koprivnjak, M. P. Miller, B. Cookson and J. Hamilton-Taylor, Water Res., 2012, 46, 4532–4542 CrossRef CAS PubMed.
- W. Guo, F. Yang, Y. Li and S. Wang, Sci. Total Environ., 2017, 699–708 CrossRef CAS PubMed.
- A. Golestani, S. M. S. Kolbadi and A. A. Heshmati, Journal of Applied Geophysics, 2013, 98, 124–133 CrossRef.
- M. S. Reis, P. M. Saraiva and B. R. Bakshi, Compr. Chemom., 2009, 25–55 CAS.
- Y. Peng, G. Li, M. Zhou, H. Wang and L. Lin, RSC Adv., 2017, 7, 11198–11205 RSC.
- R. Q. Quiroga, International Congress, 2005, 1278, 429–432 CrossRef.
- Y. Kopsinis and S. Mclaughlin, IEEE Trans. Sig. Process, 2009, 57, 1351–1362 CrossRef.
- E. Alickovic, J. Kevric and A. Subasi, Biomedical Signal Processing & Control, 2018, 39, 94–102 CrossRef.
- N. E. Huang, Z. Shen, S. R. Long, M. C. Wu, H. H. Shih, Q. Zheng, N. C. Yen, C. T. Chi and H. H. Liu, Proceedings Mathematical Physical & Engineering Sciences, 1998, 454, 903–995 Search PubMed.
- G. Yang, Y. Liu, Y. Wang and Z. Zhu, Signal Processing, 2015, 109, 95–109 CrossRef.
- J. R. Yeh, J. S. Shieh and N. E. Huang, Adv. Adapt. Data Anal., 2010, 2, 135–156 CrossRef.
- W. Tong, M. Zhang, Q. Yu and H. Zhang, Journal of Applied Geophysics, 2012, 83, 29–34 CrossRef.
- J. T. Tang, Q. Zou, Y. Tang, B. Liu and X. K. Zhang, International Conference on Bioinformatics and Biomedical Engineering, IEEE, 2007, pp. 664–667 Search PubMed.
- M. E. Hamid, S. Das, K. Hirose and M. K. I. Molla, International Journal of Signal Processing Image Processing & Pattern Recognition, 2013, 5, 1–16 Search PubMed.
- A. Mert and A. Akan, Detrended fluctuation thresholding for empirical mode decomposition based denoising, Academic Press, Inc., 2014, vol. 32, pp. 48–56 Search PubMed.
- W. Wu and H. Peng, J. Commun., 2014, 9, 506–514 CrossRef.
- Z. Wu and N. E. Huang, Adv. Adapt. Data Anal., 2005, 1, 1–41 Search PubMed.
- F. Liu, J. Li, L. Liu, L. Huang and G. Fang, Journal of Applied Geophysics, 2017, 139, 109–116 CrossRef.
- X. J. Li, K. Wang, G. B. Wang and Q. Li, Appl. Mech. Mater., 2011, 143–144, 689–693 CrossRef.
- N. Mariyappa, S. Sengottuvel, C. Parasakthi, K. Gireesan, M. P. Janawadkar, T. S. Radhakrishnan and C. S. Sundar, Med. Eng. Phys., 2014, 36, 1266–1276 CrossRef CAS PubMed.
- Z. Zhou, X. M. Yang and G. Chen, Adv. Mater. Res., 2014, 902, 336–340 CrossRef.
- P. Nguyen and J. M. Kim, Adaptive ECG denoising using genetic algorithm-based thresholding and ensemble empirical mode decomposition, Elsevier Science Inc., 2016, vol. 373, pp. 499–511 Search PubMed.
- J. Han and V. D. B. Mirko, Geophysics, 2015, 80, KS69–KS80 CrossRef.
- H. Wang, Z. Liu, Y. Song and X. Lu, IET Signal Process., 2016, 11, 452–461 CrossRef.
- N. E. Huang, Z. Shen and S. R. Long, Annu. Rev. Fluid Mech., 1999, 31, 417–457 CrossRef.
- Z. Wu, N. E. Huang and X. Chen, Adv. Adapt. Data Anal., 2009, 1, 339–372 CrossRef.
- Y. Lei, Z. He and Y. Zi, Mech. Syst. Signal Pr., 2009, 23, 1327–1338 CrossRef.
- W. Xu, Y. Hou, Y. S. Hung and Y. Zou, Signal Processing, 2013, 93, 261–276 CrossRef.
- B. A. Stephen, Journal of Emerging Trends in Educational Research and Policy Studies, 2012, 3, 121–125 Search PubMed.
- Y. Chen, Y. Cheng and H. Liu, Optik, 2017, 132, 243–248 CrossRef.
- G. P. Nason, Wavelets & Statistics Lecture Notes in Statistics Antoniadis, 1995, vol. 103, pp. 261–280 Search PubMed.
- H. Li, X. Tuo, R. Shi, J. Zhang, M. J. Henderson, J. Courtois and M. Yan, Nucl. Instrum. Methods Phys. Res., 2016, 818, 68–75 CrossRef CAS.
- S. Gaci, IEEE Transactions on Geoscience & Remote Sensing, 2014, 52, 4558–4563 Search PubMed.
- B. Abibullaev, W. S. Kang, S. H. Lee and J. An, Advances in Information Sciences and Service Sciences, 2010, 2, 84–92 CrossRef.
- Z. B. Peng, Y. C. Liu and X. F. Han, Appl. Mech. Mater., 2012, 203, 103–107 CrossRef.
- K. S. Parmar and R. Bhardwaj, American Journal of Mathematics & Statistics, 2012, 2, 57–63 Search PubMed.
- C. F. F. C. Cunha, A. T. Carvalho, M. R. Petraglia and A. C. S. Lima, Electr. Power Syst. Res., 2015, 125, 184–195 CrossRef.
| This journal is © The Royal Society of Chemistry 2018 |

