 Open Access Article
A sensitive LSPR sensor based on glutathione-functionalized gold nanoparticles on a substrate for the detection of Pb2+ ions
Bingbing Feng,
Rui Zhu,
Shouming Xu,
Yu Chen and
Junwei Di *
*
College of Chemistry, Chemical Engineering and Material Science, Soochow University, Suzhou, 215123, PR China. E-mail: djw@suda.edu.cn
First published on 23rd January 2018
Abstract
A plasmonic probe based on gold nanoparticles (AuNPs) on a solid substrate for the detection of Pb2+ was developed. The AuNPs were self-assembled on a transparent indium tin oxide (ITO) glass using organic PDDA linkers and then calcined to obtain pure AuNPs on the ITO surface (ITO/AuNPs). The probe was fabricated by functionalizing glutathione on the gold surface (ITO/AuNPs/GSH). The strong chelation of Pb2+ with GSH resulted in the red-shift of the localized surface plasmon resonance (LSPR) peak due to the change in the refractive index of the environment. The red-shift of the peak wavelength was linearly proportional to the concentration of Pb2+ from 10−10 to 10−5 M with a detection limit of 5 × 10⁻¹¹ M. The sensitivity of the as-prepared sensor was much higher than that of the sensors prepared by the methods based on aggregation strategy. This method offered a new strategy for the determination of Pb2+ with satisfactory results.
1. Introduction
Pb2+ is one of the most widely concerned heavy metal pollutants due to the adverse health effects caused by lead exposure. Major sources of lead contamination are primarily lead-based paints, storage batteries, water pipes, food and cosmetics. According to the Centers for Disease Control (CDC), about 310![[thin space (1/6-em)]](https://www.rsc.org/images/entities/char_2009.gif) 000 U.S. children aged 1–5 have high levels of lead in their blood due to the exposure to the lead environment. A variety of symptoms have been attributed to lead poisoning when it is introduced into the human body, such as mental confusion, memory loss, poor muscle coordination, and the damage to the sensory organs. Adversely, as lead is non-biodegradable, even a tiny amount of lead will eventually cause fatal harm. The U.S. Environmental Protection Agency (EPA) has set the safety limits of Pb2+ in drinking water as 72 nM.1–3 Therefore, it is necessary to develop a method for the highly sensitive, selective, and efficient detection of a trace amount of lead in the environmental analysis, food, and daily necessities testing, and biomedical determination.
000 U.S. children aged 1–5 have high levels of lead in their blood due to the exposure to the lead environment. A variety of symptoms have been attributed to lead poisoning when it is introduced into the human body, such as mental confusion, memory loss, poor muscle coordination, and the damage to the sensory organs. Adversely, as lead is non-biodegradable, even a tiny amount of lead will eventually cause fatal harm. The U.S. Environmental Protection Agency (EPA) has set the safety limits of Pb2+ in drinking water as 72 nM.1–3 Therefore, it is necessary to develop a method for the highly sensitive, selective, and efficient detection of a trace amount of lead in the environmental analysis, food, and daily necessities testing, and biomedical determination.
Several traditional analytical techniques have already been developed to detect trace levels of Pb(II) ions, including atomic absorption spectrometry (AAS),4 inductive coupled plasma atomic emission spectrometry (ICP-AES),5 atomic fluorescence spectrometry (AFS),6 and inductive coupled plasma mass spectrometry (ICP-MS).7 These methods often require the expensive and large instrumentations and complicated sample preparation processes. In order to provide rapid on-site evaluation of Pb2+ ions, a variety of methods based on nanotechnology have been developed by means of electrochemical methods,8,9 fluorometry,10,11 dynamic light scattering,12 and colorimetry.13–19 Among them, colorimetric sensors have attracted much attention because of their convenient operation, use of simple instruments and a rapid process.
Gold nanoparticles (AuNPs) have been widely used due to their unique size- and shape-dependent optical properties.20–22 Localized surface plasmon resonance (LSPR), which occurs due to the collective oscillation of the surface electrons on excitation with incident light, is one of the most important properties of AuNPs. The most reported detection of Pb2+ ions is related to LSPR-based color change resulting from the aggregation or anti-aggregation of functionalized gold nanoparticles with DNA,14 peptide,15 GSH,16,17 and other organic small molecules.18 However, the peptide-functionalized sensors showed low selectivity. The DNA-based sensors exhibited good selectivity and sensitivity, but the low stability and high-cost of the DNA probes limited their applications for numerous real samples. The colorimetric detection of Pb2+ based on GSH or other organic small molecules modified nanoparticles showed poor detection limit and low sensitivity.16
Another strategy with a gold nanoparticles-based sensing platform is based on the shift of its LSPR band induced by the change in the environmental refractive index. It has demonstrated an excellent sensitivity in the detection of various molecules and ions.23,24 However, the investigation of the LSPR sensors towards Pb2+ ions was seldom.25 In our previous study, we have developed a facile and simple method for the fabrication of AuNPs on the transparent indium tin oxide (ITO) glass substrate.26 The surface of AuNPs was cleaned by a high-temperature treatment. Thus, it can be easily modified with functional molecules. In this study, the ITO/AuNPs stripes were functionalized by glutathione (GSH), which can selectively and efficiently react with Pb2+ at pH 7.5. This leads to the change of the environmental refractive index. It is demonstrated that the sensitivity of the as-prepared sensor was much higher than that of the sensor prepared by the aggregation method. This LSPR probe was successfully applied for the detection of Pb2+ ions in food, cosmetic samples, and industrial wastewater.
2. Experimental section
2.1 Materials and equipments
Sodium citrate tribasic dihydrate (C6H5Na3O7·2H2O), tetra-chloroauric acid (HAuCl4·4H2O), glutathione (GSH), polydimethyl diallyl ammonium chloride (PDDA), and tris(hydroxymethyl)aminomethane (Tris) were purchased from Sinopharm Chemical Reagent Co. Ltd. All chemicals were of analytical grade. Milli-Q water (18.2 MΩ cm) was used to prepare all the solutions in this study. The ITO glass (1.1 mm) was bought from Suzhou NSG Electronics Co. Ltd. (Suzhou, China). The UV-vis spectra were recorded on a Cary 60 spectrometer (Agilent, Australia). The transmission electron microscopy (TEM) image was obtained from Tecnai G20 (FEI, U.S.A.). Scanning electron microscopy (SEM) and energy dispersive spectroscopy (EDS) were performed using an S-4700 SEM (Hitachi, Japan). The ICP-MS data were obtained from an inductively coupled plasma mass spectrometer (iCAPQC). A RST-5000 Electrochemical Workstation (Suzhou, P. R. China) was used to perform the CV. The atomic force microscopy (AFM) images were collected from a Dimension Leon AFM (Bruker, U.S.A.). The Raman spectra were recorded using a HR800 spectrometer (Horiba, Jobin-Yvon).2.2 Fabrication of AuNPs
AuNPs were synthesized according to the standard procedures with slight modifications.27 Typically, an aqueous solution of tetra-chloroauric acid (20 mL, 1 mM) was added to 35 mL ultrapure water. The mixture was heated with vigorous stirring in a round bottom flask fitted with a reflux condenser. When boiling, 10 mL of 10 mM sodium citrate solution was added and the mixture was refluxed for another 30 min. In order to remove the excess sodium citrate and separate the particles with a uniform particle size, the prepared AuNPs were centrifuged at 10![[thin space (1/6-em)]](https://www.rsc.org/images/entities/char_2009.gif) 000 rpm for 30 min. Then, the precipitates were dispersed in water for use. AuNPs were obtained with the diameter of ∼16 nm and the UV-vis absorption peak in an aqueous solution appeared at about 520 nm.
000 rpm for 30 min. Then, the precipitates were dispersed in water for use. AuNPs were obtained with the diameter of ∼16 nm and the UV-vis absorption peak in an aqueous solution appeared at about 520 nm.
2.3 Preparation of the ITO/AuNPs and ITO/AuNPs/GSH
The transparent ITO glasses (0.6 × 5.0 cm2) were used as a solid substrate and cleaned before modification according to the following procedure. They were sonicated in dilute ammonia, ethanol, and water for 15 min each. Then, they were dried in a nitrogen flow before being used. The ITO/AuNPs was prepared by a self-assembly method. The clean ITO glasses were immersed in PDDA solution (1![[thin space (1/6-em)]](https://www.rsc.org/images/entities/char_2009.gif) :
:![[thin space (1/6-em)]](https://www.rsc.org/images/entities/char_2009.gif) 40) for six hours and then in aqueous AuNPs solution overnight. After each step, the surfaces of the glasses were rinsed with ultrapure water and dried with nitrogen. Finally, they were calcined in a tube furnace at 400 °C for 30 min. Thus, the clean ITO/AuNPs substrates were obtained.
40) for six hours and then in aqueous AuNPs solution overnight. After each step, the surfaces of the glasses were rinsed with ultrapure water and dried with nitrogen. Finally, they were calcined in a tube furnace at 400 °C for 30 min. Thus, the clean ITO/AuNPs substrates were obtained.
First, the glutathione solution was prepared with deoxygenated water. Subsequently, the ITO/AuNPs substrate was soaked in 15 mM GSH solution for 30 min at room temperature and removed to be rinsed and dried. The ITO/AuNPs/GSH was prepared successfully, which could be preserved for a long time in a dry environment.
2.4 Detection of Pb2+ with ITO/AuNPs/GSH
An ITO/AuNPs/GSH stripe was immersed in water for 10 min. After it was dried by nitrogen gas, its UV-vis absorption spectrum was recorded. Then, the ITO/AuNPs/GSH was incubated in a Tris–HCl buffer solution (pH 7.5) containing a certain concentration of Pb2+ ions for 15 min. After it was rinsed and dried, the UV-vis absorption peak was recorded again. The red-shift of the peak wavelength was the basis to determine the concentration of Pb2+ ions.3. Results and discussion
3.1 Characterization of the ITO/AuNPs
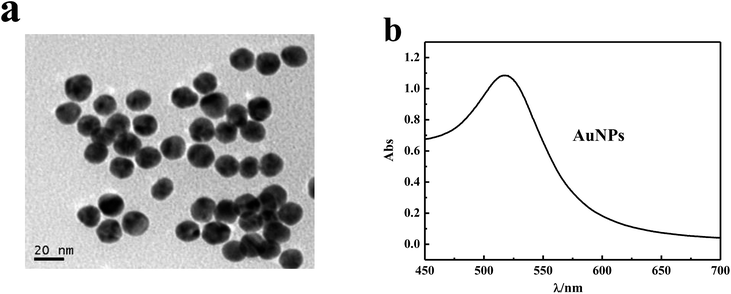
The AuNPs were synthesized by reducing HAuCl4 with sodium citrate. The prepared AuNPs in aqueous solution had a size of ∼16 nm and the LSPR peak appeared at about 520 nm (Fig. 1). The ITO/AuNPs stripe was fabricated through the self-assembly and calcination processes. PDDA is a positive-charged polyelectrolyte and gold nanoparticles are negatively charged. Therefore, the AuNPs could be assembled on the ITO surface using PDDA as a linker. Then, the clean ITO/AuNPs substrate was fabricated by calcination at high temperature to remove PDDA.The morphology of AuNPs deposited on the ITO-coated glass was investigated using the SEM and AFM images. Fig. 2a shows a typical photograph of the gold nanostructures on the ITO substrate. It can be observed that the AuNPs were distributed homogeneously on the solid substrate. The size of AuNPs was 19 ± 3 nm according to analysis from a nano measurer (Fig. 2b). Fig. 2c and d show the three-dimensional structural information of the nanoparticles. The height of nanoparticles was about 16 nm, which was slightly less than the diameter of AuNPs (Fig. 2b). This may be attributed to the distortion of AuNPs at high temperature. The UV-vis absorption spectrum of ITO/AuNPs exhibited a well-shaped peak located at ∼524 nm (Fig. 3, a black curve), corresponding to the LSPR peak of AuNPs.
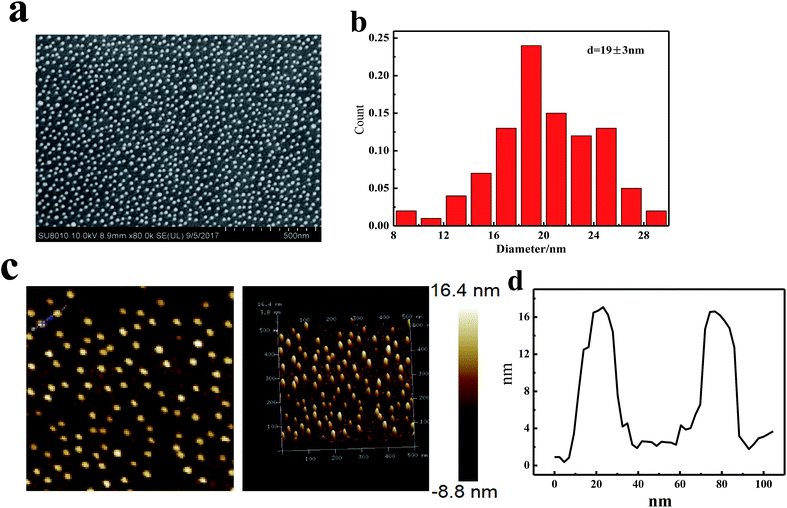 | ||
| Fig. 2 Typical SEM image of ITO/AuNPs (a), its size distribution (b), AFM scanning images of ITO/AuNPs (c), and its height distribution (d). | ||
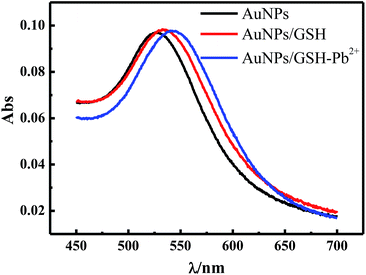 | ||
| Fig. 3 UV-visible absorption spectra of the ITO/AuNPs and ITO/AuNPs/GSH before and after the incubation with 10−7 M Pb2+ in a Tris–HCl buffer solution. | ||
3.2 Functionalization of ITO/AuNPs with GSH
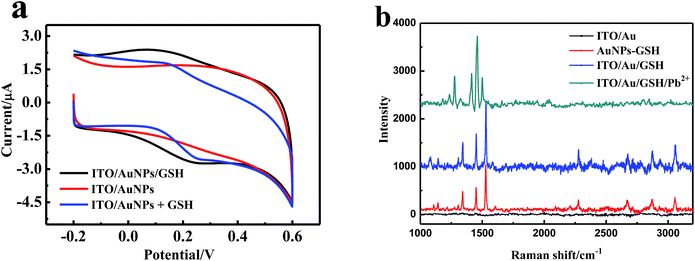
The surface of AuNPs was cleaned from the organic stabilizers and linkers that were burnt out in the high-temperature annealing process. Therefore, this ITO/AuNPs could be functionalized easily by GSH. The GSH molecules self-assembled on the gold surface could be monitored by spectrometry because the LSPR of AuNPs was easily influenced by their surrounding medium.28 The LSPR peak gradually red-shifted with the increasing concentration of GSH and then reached a plateau in the range of 10−4 to 0.1 M. It is well-known that the concentration affects the self-assembly time. The higher the concentration, the shorter is the self-assembly time. Self-assembly can be almost achieved in a short time, but a longer time can result in the more ordered arrangement.29,30 Therefore, we selected 15 mM of GSH and a time of 30 min for the reaction. Fig. 3 shows the changes of the UV-vis absorption spectra before and after ITO/AuNPs glass was modified with GSH. The LSPR peak of ITO/AuNPs was red-shifted from 524 nm to 532 nm, which was attributed to the assembly of GSH on the gold surface.The cyclic voltammetry (CV) was also employed to clarify the modification of GSH on ITO/AuNPs. Fig. 4 presents the CV curves on different electrodes in a 0.1 M PBS buffer (pH 7.0) at a scan rate of 50 mV s−1. There were no peaks in the voltammograms of the ITO/AuNPs electrode in the potential range of −0.2 to 0.6 V. However, a marked oxidation peak at the potential of 0.24 V and a reduction peak at 0.09 V were observed for the ITO/AuNPs/GSH electrode. The peak positions were consistent with those in the voltammogram of GSH added directly in the aqueous solution on the ITO/AuNPs electrode (Fig. 4a, blue curve). This result suggested that GSH was successfully immobilized on the ITO/AuNPs electrode.
In order to further obtain the information of the modification, the Raman spectra of the functionalized AuNPs were also investigated. For comparison, the Raman spectrum of the GSH coated AuNPs (AuNPs–GSH), prepared according to the literature,16 is also provided in Fig. 4b. It is clearly observed that the Raman spectrum of ITO/AuNPs showed no marked peaks, which was attributed to the fact that the organic linker was burnt out in the calcination process. Moreover, the bands of the Raman spectrum of ITO/AuNPs/GSH were similar to that of AuNPs–GSH. The strongest peak at 1529 cm−1 could be ascribed to either the C–N stretching or the N–H rocking vibrations. The peak at 1449 cm−1 was assigned to the bending of C–H bond. The band at 1343 cm−1 was related to the O–H vibration.31,32 Moreover, the characteristic absorption peaks for –SH at 2524 cm−1 as found in pure GSH disappeared, indicating that GSH was immobilized onto the surface of nanoparticles via the thiol group.17,32 These results demonstrated that ITO/AuNPs was successfully functionalized by the GSH molecules.
3.3 Sensing mechanism for the detection of Pb2+ ions
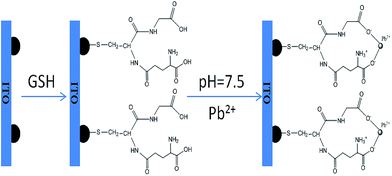
Fig. 5 clearly illustrates the sensing mechanism of the Pb2+ detection. The GSH molecules self-assemble on the gold surface through a strong Au–S bond. Thus, only two carboxyls (–COOH) and one amino (–NH2) are free to bind to the metal ions. It is known that lead is an oxyphilic element and its ion has an ability to coordinate with up to eight oxygen atoms or four acetate molecules to form larger aggregates.33 Moreover, the protonated amine group (–NH3+) can protect GSH from functioning with some other ions that more easily bind to the amino group.33,34 In fact, the GSH conformational structure is severely affected by the solution pH. The pH dependence of the fraction of several protonated GSH states has already been analyzed using the estimated pKa values.35,36 The deprotonated carboxylic acid (–COO−) and the protonated amine group (–NH3+) in the GSH molecule are predominated in the pH range of 4–8, which is a benefit for the coordination with Pb2+ with high selectivity. This is consistent with the results from the system of GSH–AuNPs for the colorimetric detection of Pb2+ based on the aggregation.12According to this selective reaction between GSH and Pb2+, the ITO/AuNPs/GSH can be used as a plasmonic probe due to the change of the local refractive index on the nanoparticle surface caused by the specific binding of the GSH with Pb2+. Fig. 3 shows the UV-vis absorption spectra of ITO/AuNPs/GSH before and after the addition of Pb2+. The LSPR peak of the stripe was red-shifted of 7.5 nm in the presence of Pb2+ solution (0.1 μM). Normally, the change of the dielectric properties can cause the shift of the plasmonic bands. We found that the open-circuit potential (OCP) of the ITO/AuNPs/GSH electrode was about −40 mV. After the electrode was incubated in 0.01 mM Pb2+, this value changed to about 50 mV. This result indicated the change of the surface charge or charge state depending on the polarity of charge and charge density. It also explained the experimental phenomenon that the addition of lead ions to ITO/AuNPs/GSH can cause a shift in the plasmonic bands.
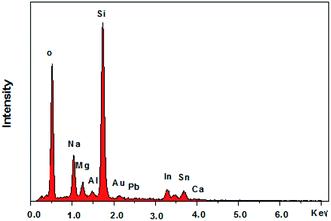
In addition, a SERS effect of the introduction of Pb2+ on the ITO/AuNPs/GSH was also observed (Fig. 4b). The wavenumber of the peak at 1529 cm−1 slightly changed and its relative intensity, compared with that of the peak at 1449 cm−1, was altered. The O–H vibration band at 1343 cm−1 reduced considerably. The deposition of Pb on the probe surface was also confirmed by the EDS spectrum (Fig. 6). Therefore, this method can be used to detect Pb2+ based on the change of the peak wavelength.
3.4 Optimization of the experimental conditions
In order to achieve the optimal conditions for the Pb2+ detection, pH and reaction time need to be optimized. To understand how pH affected the sensitivity of the probe, we performed the same experiment at different pH in the range of 5.0–8.0. As shown in Fig. 7a, we found that in the presence of 0.1 μM Pb2+ ions, the red-shift of the LSPR peak showed a tendency to rise first in the pH range of 5.0–7.5 and then decrease as pH increased beyond 7.5. Since it exhibited a maximum at pH 7.5, we selected this value to optimize experimental conditions. Fig. 7b shows the effect of different reaction times in the presence of 0.1 μM Pb2+ ions. At room temperature, the LSPR peak of the sensor gradually red-shifted with the increasing incubating time and then remained constant after 15 min. For comparison, the control experiments were carried out. In the absence of Pb2+ ions, the LSPR peak wavelength showed almost no change. Therefore, 15 min was used to record the coordination reaction in this sensing system.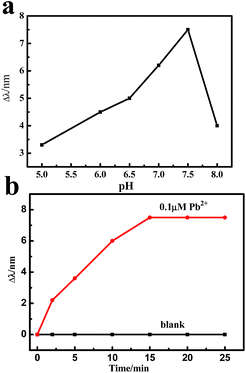 | ||
| Fig. 7 Effect of pH (a) and time (b) on the wavelength shift of the absorption peaks for the ITO/AuNPs/GSH in the presence of 0.1 μM Pb2+ ions. | ||
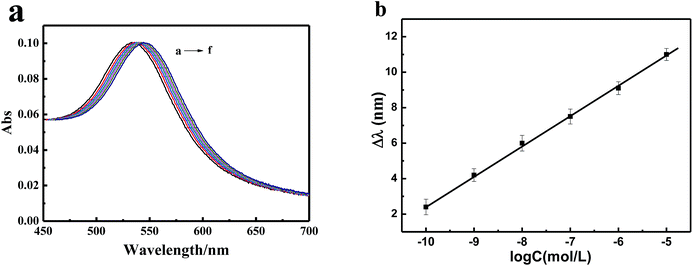
3.5 Detection of Pb2+ ions
Under the optimized experimental conditions, the sensitivity of this plasmonic sensor for the detection of Pb2+ ions was evaluated. As shown in Fig. 8a, with the increase in the concentration of Pb2+, the absorption peak of the sensor gradually red-shifted. Fig. 8b showed that a good linear relationship was obtained between the red-shift of the LSPR peak and the concentration of Pb2+ ions from 10−10 to 10−5 M with a correlation coefficient of 0.9986. The limit of detection (LOD) was calculated to be 5 × 10⁻¹¹ M, which is much lower than the EPA limit (72 nM).To compare with other methods, the sensitivity and detection limits of different systems are illustrated in Table 1. The proposed method using ITO/AuNPs/GSH is superior to many other methods, particularly the colorimetric method based on the aggregation of functionalized AuNPs. This is because one functionalized AuNP usually captures numerous target Pb2+ ions. This produces larger red-shift in the peak wavelength of ITO/AuNPs/GSH due to the increase in the refractive index. However, this also leads to chemical attenuation and then decreases the sensitivity in the aggregation method.41,42 Moreover, AuNPs, as probes, suspended in liquid solution are unstable and exhibit a large blank value in the absorbance, which diminishes the sensitivity in the colorimetric method. Moreover, the AuNPs deposited on a solid substrate are rather stable. Therefore, our strategy provides a high sensitive method for the detection of Pb2+ ions.
| Method | System | Liner range (μM) | LOD (nM) | Ref. |
|---|---|---|---|---|
| Colorimetry | GSH–AuNPs | 0.1–50 | 100 | 16 |
| Colorimetry | Gallic acid–AuNPs | 0.01–1 | 10 | 18 |
| Colorimetry | L-Tyrosine–AuNPs | 0.016–0.1 | 16 | 37 |
| Colorimetry | “8–17” DNAzyme | 0.4–2 | 400 | 14 |
| Electrochemistry | GR-5 DNAzyme | 0.5–10 | 300 | 38 |
| Fluorescence | MB-DNAzyme | 0.005–0.1 | 3 | 39 |
| Fluorescence | GSH-quantum dots | 0.05–0.2 | 20 | 10 |
| SERS | Citrate–AuNPs | 0.00024–0.0048 | 0.12 | 40 |
| LSPR | ITO/AuNPs/GSH | 0.0001–10 | 0.05 | This work |
3.6 Selectivity of the sensor
To assess the selectivity of the developed probe, the responses of the sensor to other environmentally relevant metal ions were tested under the optimized experimental conditions. Fig. 9 displays the changes in the peak wavelength of the sensor in the presence of various metal ions. Interestingly, 0.01 μM Pb2+ was the unique metal ion among them, which led to a visible red-shift of the absorption peak. The presence of K+, Na+, Ca2+, Mg2+, Zn2+, Cd2+, Co2+, Ni2+, Fe2+, and Hg2+ at 100-fold higher concentration and Cu2+ at the same concentration with respect to that of Pb2+ did not interfere with the determination of Pb2+. However, 0.1 μM of Cu2+ ions could cause a red-shift of 2.1 nm, which resulted in the interference to the detection of Pb2+. This interference could be avoided by the addition of thiourea as a masking agent. These results suggested that the system had an excellent selectivity towards Pb2+ ions.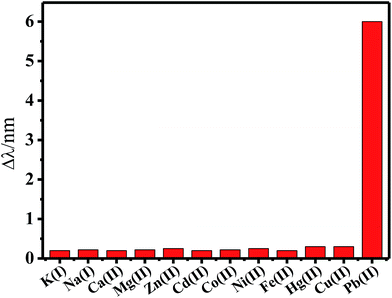 | ||
| Fig. 9 Comparison of the LSPR peak change for Pb2+ ions and different metal ions. Concentrations: 0.01 μM for Pb2+ and Cu2+ ions, 1 μM for other metal ions. | ||
3.7 Practical application
To demonstrate the potential practical applications of our as-prepared probe, we chose some samples such as liquid foundation, toner, preserved eggs, and industrial wastewater for testing. Liquid foundation, toner, and preserved eggs were purchased from a supermarket. We followed the literature and made some slight changes to pretreat the sample.43 First, they were dissolved in 10% nitric acid at room temperature and boiled until complete dissolution. Then, the supernatant was taken for analysis after the centrifugation (12![[thin space (1/6-em)]](https://www.rsc.org/images/entities/char_2009.gif) 000 rpm) for about 10 min. The industrial wastewater was obtained from a river near an electroplating factory. After the sample was pre-treated and diluted 100 times, it was analyzed by a working curve method. The results are summarized in Table 2. The recoveries in the samples were determined by the standard addition method. The recoveries for the assay of Pb2+ ions were between 104% and 95.0%. The detection results were in good agreement with the results obtained by the ICP-MS method. Therefore, the present method can be applied to the detection of lead ions.
000 rpm) for about 10 min. The industrial wastewater was obtained from a river near an electroplating factory. After the sample was pre-treated and diluted 100 times, it was analyzed by a working curve method. The results are summarized in Table 2. The recoveries in the samples were determined by the standard addition method. The recoveries for the assay of Pb2+ ions were between 104% and 95.0%. The detection results were in good agreement with the results obtained by the ICP-MS method. Therefore, the present method can be applied to the detection of lead ions.
| Sample | Detected/ppm | Added/ppm | Found/ppm | Recovery/% | RSD/% | ICP-MS/ppm |
|---|---|---|---|---|---|---|
| Liquid foundation | 0.093 | 0.1 | 0.198 | 103% | 7.9 | 0.089 |
| Toner | 0.017 | 0.1 | 0.115 | 98.3% | 8.8 | 0.021 |
| Preserved eggs | 0.027 | 0.1 | 0.121 | 95.0% | 8.3 | 0.035 |
| Industrial wastewater | 0.106 | 0.1 | 0.214 | 104% | 6.2 | 0.101 |
4. Conclusions
In this paper, we reported a novel approach for the detection of Pb2+ in an aqueous solution based on the GSH molecules functionalized AuNPs on a solid substrate of the ITO glass. GSH can selectively react with the Pb2+ ions via two free –COO− groups, leading a red-shift of the LSPR peak wavelength. Compared with the previous methods based on the aggregation or anti-aggregation of the functionalized gold nanoparticles, this approach shows very high sensitivity and good selectivity towards Pb2+. Moreover, the synthesis of the sensors is simple, easy, and cost-effective. This method provides another route for the detection of low levels of Pb2+ ions due to its sensitivity, selectivity, facility, and rapidness. Therefore, it may have good potential applications for the detection of Pb2+ in food, water sources, and bioassays.Conflicts of interest
There are no conflicts to declare.Acknowledgements
This work was financially supported by the National Natural Science Foundation of China (No. 21475092) and the Priority Academic Program Development of Jiangsu Higher Education Institutions.Notes and references
- M. Jakubowski, Int. J. Occup. Med. Environ. Health, 2011, 24, 1–7 CrossRef PubMed.
- L. M. Schell, M. Denham, A. D. Stark, P. J. Parsons and E. E. Schulte, Am. J. Hum. Biol., 2009, 21, 180–187 CrossRef PubMed.
- W. Jedrychowski, F. Perera, J. Jankowski, V. Rauh, E. Flak, K. L. Caldwell, R. L. Jones, A. Pac and I. Lisowska-Miszczyk, Int. J. Hyg. Environ. Health, 2008, 211, 345–351 CrossRef PubMed.
- J. E. Tahán, V. A. Granadillo and R. A. Romero, Anal. Chim. Acta, 1994, 295, 187–197 CrossRef.
- H. Elfering, J. T. Andersson and K. G. Poll, Analyst, 1998, 123, 669–674 RSC.
- Z. Wan, Z. Xu and J. Wang, Analyst, 2006, 131, 141–147 RSC.
- H.-W. Liu, S.-J. Jiang and S.-H. Liu, Spectrochim. Acta, Part B, 1999, 54, 1367–1375 CrossRef.
- P. Zhang, G. Xu, J. Lv, J. Cui, Z. Zheng and Y. Wu, J. Electroanal. Chem., 2012, 685, 91–96 CrossRef CAS.
- S. Tang, P. Tong, X. You, W. Lu, J. Chen, G. Li and L. Zhang, Electrochim. Acta, 2016, 187, 286–292 CrossRef CAS.
- E. Mohamed Ali, Y. Zheng, H.-h. Yu and J. Y. Ying, Anal. Chem., 2007, 79, 9452–9458 CrossRef PubMed.
- Y.-S. Wu, F.-F. Huang and Y.-W. Lin, ACS Appl. Mater. Interfaces, 2013, 5, 1503–1509 CAS.
- L. Beqa, A. K. Singh, S. A. Khan, D. Senapati, S. R. Arumugam and P. C. Ray, ACS Appl. Mater. Interfaces, 2011, 3, 668–673 CAS.
- J. Liu and Y. Lu, J. Am. Chem. Soc., 2004, 126, 12298–12305 CrossRef CAS PubMed.
- J. Liu and Y. Lu, J. Am. Chem. Soc., 2003, 125, 6642–6643 CrossRef CAS PubMed.
- J. M. Slocik, J. S. Zabinski, D. M. Phillips and R. R. Naik, Small, 2008, 4, 548–551 CrossRef CAS PubMed.
- F. Chai, C. Wang, T. Wang, L. Li and Z. Su, ACS Appl. Mater. Interfaces, 2010, 2, 1466–1470 CAS.
- W. Chu, Y. Zhang, D. Li, C. J. Barrow, H. Wang and W. Yang, Biosens. Bioelectron., 2015, 67, 621–624 CrossRef CAS PubMed.
- K.-W. Huang, C.-J. Yu and W.-L. Tseng, Biosens. Bioelectron., 2010, 25, 984–989 CrossRef CAS PubMed.
- A. D'Agostino, A. Taglietti, B. Bassi, A. Donà and P. Pallavicini, J. Nanopart. Res., 2014, 16, 2683 CrossRef.
- E. Oliveira, C. Núñez, H. M. Santos, J. Fernández-Lodeiro, A. Fernández-Lodeiro, J. L. Capelo and C. Lodeiro, Sens. Actuators, B, 2015, 212, 297–328 CrossRef CAS.
- C. M. Niemeyer, Angew. Chem., Int. Ed., 2001, 40, 4128–4158 CrossRef CAS.
- A. N. Shipway, E. Katz and I. Willner, ChemPhysChem, 2000, 1, 18–52 CrossRef CAS PubMed.
- J. Deng, Y. Song, Y. Wang and J. Di, Biosens. Bioelectron., 2010, 26, 615–619 CrossRef CAS PubMed.
- T. Endo, S. Yamamura, N. Nagatani, Y. Morita, Y. Takamura and E. Tamiya, Sci. Technol. Adv. Mater., 2005, 6, 491–500 CrossRef CAS.
- G. Qiu, S. P. Ng, X. Liang, N. Ding, X. Chen and C.-M. L. Wu, Anal. Chem., 2017, 89, 1985–1993 CrossRef CAS PubMed.
- L. Ding, Y. Gao and J. Di, Biosens. Bioelectron., 2016, 83, 9–14 CrossRef CAS PubMed.
- G. Frens, Nat. Phys. Sci., 1973, 241, 20–22 CrossRef CAS.
- A. Taglietti, Y. A. Diaz Fernandez, E. Amato, L. Cucca, G. Dacarro, P. Grisoli, V. Necchi, P. Pallavicini, L. Pasotti and M. Patrini, Langmuir, 2012, 28, 8140–8148 CrossRef CAS PubMed.
- M. Kawasaki, T. Sato, T. Tanaka and K. Takao, Langmuir, 2000, 16, 1719–1728 CrossRef CAS.
- H. X. He, H. Zhang, Q. G. Li, T. Zhu, S. F. Y. Li and Z. F. Liu, Langmuir, 2000, 16, 3846–3851 CrossRef CAS.
- G. Singh, S. D. Dogra, S. Kaur, S. K. Tripathi, S. Prakash, B. Rai and G. S. S. Saini, Spectrochim. Acta, Part A, 2015, 149, 505–515 CrossRef CAS PubMed.
- C. Sheng, H. Zhao, F. Gu and H. Yang, J. Raman Spectrosc., 2009, 40, 1274–1278 CrossRef CAS.
- D. L. Rabenstein and M. T. Fairhurst, J. Am. Chem. Soc., 1975, 97, 2086–2092 CrossRef CAS PubMed.
- I.-B. Kim, A. Dunkhorst, J. Gilbert and U. H. F. Bunz, Macromolecules, 2005, 38, 4560–4562 CrossRef CAS.
- D. L. Rabenstein, J. Am. Chem. Soc., 1973, 95, 2797–2803 CrossRef CAS.
- D. Vila-Viçosa, V. H. Teixeira, H. A. F. Santos and M. Machuqueiro, J. Phys. Chem. B, 2013, 117, 7507–7517 CrossRef PubMed.
- M. Annadhasan, T. Muthukumarasamyvel, V. R. Sankar Babu and N. Rajendiran, ACS Sustainable Chem. Eng., 2014, 2, 887–896 CrossRef CAS.
- Y. Xiao, A. A. Rowe and K. W. Plaxco, J. Am. Chem. Soc., 2007, 129, 262–263 CrossRef CAS PubMed.
- T. Fu, S. Ren, L. Gong, H. Meng, L. Cui, R.-M. Kong, X.-B. Zhang and W. Tan, Talanta, 2016, 147, 302–306 CrossRef CAS PubMed.
- M. S. Frost, M. J. Dempsey and D. E. Whitehead, Sens. Actuators, B, 2015, 221, 1003–1008 CrossRef CAS.
- Y. Zhang, I. D. McKelvie, R. W. Cattrall and S. D. Kolev, Talanta, 2016, 152, 410–422 CrossRef CAS PubMed.
- E. Priyadarshini and N. Pradhan, Sens. Actuators, B, 2017, 238, 888–902 CrossRef CAS.
- M. d. G. Andrade Korn, E. S. da Boa Morte, D. C. M. Batista dos Santos, J. T. Castro, J. T. P. Barbosa, A. P. Teixeira, A. P. Fernandes, B. Welz, W. P. C. dos Santos, E. B. G. Nunes dos Santos and M. Korn, Appl. Spectrosc. Rev., 2008, 43, 67–92 CrossRef.
| This journal is © The Royal Society of Chemistry 2018 |

