 Open Access Article
Determination of six organophosphorus pesticides in water samples by three-dimensional graphene aerogel-based solid-phase extraction combined with gas chromatography/mass spectrometry
P. Sunab,
Y. L. Gaob,
C. Xub and
Y. F. Lian *a
*a
aKey Laboratory of Functional Inorganic Material Chemistry, Ministry of Education, School of Chemistry and Materials Science, Heilongjiang University, Harbin 150080, China. E-mail: chyflian@hlju.edu.cn
bAnalytical Centre, Heilongjiang Bayi Agricultural University, Daqing163319, China
First published on 13th March 2018
Abstract
In the present study, a three-dimensional graphene aerogel (3D-GA), synthesised by chemical reduction of an aqueous solution of graphene oxides (GOs) with ethylenediaminethermal by a simple water bath method followed by freeze-drying treatment, was used for the solid-phase extraction (SPE) of six organophosphorus pesticides (OPPs) (i.e. trichlorfon, dimethoate, ethoprophos, parathion, fenitrothion and fenthion) from water samples. The target analytes were extracted using packed SPE cartridges and then eluted with tetrahydrofuran. The eluate was collected and dried with high-purity nitrogen gas at room temperature. After redissolving in acetone, the residue was analysed using gas chromatography/mass spectrometry (GC/MS). The proposed method demonstrated a good linearity between 0.5 and 500 μg L−1 with the correlation coefficient of 0.9990–0.9998. The limits of detection (LODs) (S/N = 3) and the limits of quantification (LOQs) (S/N = 10) for the six OPPs pesticides were in the range of 0.12–0.58 μg L−1 and 0.41–1.96 μg L−1, respectively. The accuracy of the present method was evaluated by measuring the recovery of the spiked samples, which ranged from 93.8% to 104.2% with relative standard deviations (RSDs) of 1.1–5.6%. The established method was successfully applied to the determination of the target analytes in environmental water samples including tap water, river water, drinking water and lake water, demonstrating its great potential for the determination of OPPs in water.
1. Introduction
Because of their high efficiency and broad spectrum, organophosphorus pesticides (OPPs) are widely used for protecting crops against pests, thereby increasing the productivity of the harvest. However, the massive use of pesticides has already contributed to the current levels of environmental pollution especially in water systems. Therefore, the development of accurate and sensitive analytical methods for the simultaneous determination of trace levels of OPPs that facilitate the assessment of risk is in increasing demand.Since the analytes of interest are present in environmental water samples at low concentrations, the selection of an adequate sample preparation technique is essential for achieving an accurate determination of OPPs in water. Liquid–liquid extraction (LLE),1 solid-phase extraction (SPE),2 solid-phase microextraction (SPME),3 dispersive liquid–liquid microextraction (DLLME),4 molecularly imprinted solid phase extraction(MISPE),5 liquid-phase microextraction (LPME),6 microwave extraction,7 dispersive SPE (d-SPE),8 hollow fibre liquid-phase microextraction (HF-LPME)9 and single-drop microextraction (SDME)10 have been employed for the extraction of OPPs from water samples. Among them, the well-known SPE technique is presently the most extended method for the preconcentration of OPP pesticide residues from water samples mainly due to its large enrichment capacity.
In the SPE procedure, the adsorbent plays an important role in achieving enhanced analyte extraction efficiency, since the extraction takes place by the adsorption of the target compound on the surface of adsorbents. The choice of an appropriate adsorbent is therefore a critical factor in order to obtain a satisfactory recovery. Many materials, such as magnetic nanoparticles,11 carbon nanotubes,12 graphitised carbon black,13 macroporous resin14 and graphite,15 have already been used as adsorbents for the determination of pesticides from a variety of samples. In this context, one of the novel adsorbents that have been fabricated in order to enhance the performance of SPE techniques and satisfy the requirements of the highly sensitive and selective green analytical chemistry is three-dimensional (3D) graphene. Formed by graphene sheets, 3D graphene retains the excellent physical and chemical properties of graphene, and its 3D structure gives rise to its many superior characteristics. Nowadays, 3D graphene is successfully used as an adsorbent for the preconcentration and removal of dyes,16,17 heavy metals,18 organophosphorus pesticides,19 phenols20 and retardants.21
In this work, a 3D graphene aerogel (3D-GA) was synthesised by chemical reduction of an aqueous solution of graphene oxides (GOs) followed by freeze-drying treatment. Making full use of its porous and large surface area, such prepared 3D-GA was packed in an SPE cartridge, and its adsorption behaviour towards OPPs was investigated. The SPE parameters affecting the extraction efficiency were optimised, and the target analytes were quantified through gas chromatography/mass spectrometry (GC/MS). We consider that this method, which was utilised for the determination of OPPs in water samples, can provide some reference for the determination of other pesticide residues in water.
2. Experimental
2.1. Reagents and materials
Trichlorfon, ethoprophos, dimethoate, fenitrothion, parathion and fenthion with 99.5% purity were purchased from the Agro-Environmental Protection Institute, Ministry of Agriculture, China. High-performance liquid chromatography (HPLC) grade methanol, ethanol, acetone, tetrahydrofuran and acetonitrile were purchased from Fisher Scientific, Massachusetts, USA. A microporous membrane of 0.22 μm was obtained from Dikma Technologies (Beijing, China).Tap water, river water, drinking water and lake water samples were collected randomly from Daqing, China. All water samples were filtered through a 0.22 μm membrane syringe filter to remove the suspended solids and then stored at 4 °C.
2.2. Instruments
Chromatographic analysis was performed on a Shimadzu GC/MS QP2010 (Shimadzu Co., Japan) equipped with EI ion sources, and the system was controlled by the GC/MS solution Ver.2 software (Shimadzu Co., Japan). Scanning electron microscopy (SEM) micrographs were taken using a Hitachi S-4800 microscope. The samples were treated by nitrogen sweeping in a water bath system (Tianjin Automatic Science Instrument Co., Ltd.). FT-IR spectra were recorded on a 1600 series Perkin-Elmer (MA, USA) with a resolution of 4 cm−1. Powder X-ray diffraction (XRD) was carried out on a Bruker D8 X-ray diffractometer using Cu Kα radiation. SPE was carried out on an Extrapid SPE apparatus from Beijing Labtech Instruments Co., Ltd.2.3. Preparation of 3D-GA
Graphite oxide was synthesised by a modification of Hummers method as follows.22,23 A 100 mL beaker containing 1 g of graphite powder and 23 mL of concentrated H2SO4 was placed into an ice-colded water bath pot, and followed by stirring. When the graphite powder was well dispersed, 3.0 g of KMnO4 was added under stirring and the mixture was stirred and kept at 45 °C for 1.5 h. After 120 mL deionized water was slowly added, the beaker was maintained 90 °C for 10 min, and then 20 mL of H2O2 (30%, v/v) were added, causing yellow mixture along with bubbling. When the bubbling stopped, the suspension was cooled down and centrifuged for 5 min at 10![[thin space (1/6-em)]](https://www.rsc.org/images/entities/char_2009.gif) 000 rpm, and then the centrifugal deposit was washed with 10% HCl solution to remove metal ions followed with water until the pH became 5.0–6.0. After drying at 50 °C, graphite oxide was obtained as grey brown powder.
000 rpm, and then the centrifugal deposit was washed with 10% HCl solution to remove metal ions followed with water until the pH became 5.0–6.0. After drying at 50 °C, graphite oxide was obtained as grey brown powder.
The as-prepared graphite oxide (0.4 g) was dispersed in 100 mL of water and ultrasonicated for 1 h. The resulting solution (5 mL) was placed in a test tube with an i.d. of 12 mm, and its pH was adjusted to weakly alkaline with ammonia. Ethylenediamine (20 μL of a 50 mol L−1 aqueous solution) was added to the dispersion. After well mixed, the test tube was kept in a water bath pot and maintained 80 °C for 24 h to prepare the graphene hydrogel. Finally, the black cylinder-like graphene hydrogel was washed with ethanol solution (20%, v/v) for 6 h to remove the residual soluble impurities and to prevent it from shrinkage and collapse during the followed freeze-drying. After vacuum freeze-drying for 48 h, the 3D-GA was formed.
2.4. SPE procedures
The 3D-GA was placed between an upper frit and a lower frit in an empty 3 mL SPE cartridge with an i.d. of 8.9 mm, and then properly compacted to retain its super surface area and porousness for the adsorption OPPs. Prior to extraction, the SPE cartridge was preconditioned with 3 mL of methanol, 3 mL of acetone, 3 mL of acetonitrile, 3 mL of tetrahydrofuran and 10 mL of double-distilled water. 40 mL of water sample was passed through the cartridge at a flow rate of 1 mL min−1 on an Extrapid SPE apparatus, and then 5 mL of tetrahydrofuran was used to elute the analytes retained on the 3D-GA adsorbent. The eluent was collected and dried by nitrogen at room temperature, and 1 mL of acetone was used to redissolve the residue. After filtration through a 0.22 μm membrane, the acetone solution was subjected to GC/MS analysis.2.5. GC/MS analysis
Chromatographic separation was performed on an Rtx-50 (Shimadzu Co., Japan) capillary column (30 m × 0.25 mm i.d., 0.25 μm film thickness) under the following instrumental conditions: helium (99.999%) was used as the carrier gas; the total flow was 26.5 mL min−1; the column flow was 1.2 mL min−1 and the injector temperature was 220 °C. The injection mode was splitless for 1 μL samples, and the oven temperature was programmed as follows: the initial temperature was 70 °C (held for 2 min) and successively increased to 160 °C at a rate of 15 °C min−1 (held for 2 min), to 210 °C at a ramp rate of 10 °C min−1 (held for 2 min), to 220 °C at a ramp rate of 5 °C min−1 (held for 2 min) and to 270 °C at a ramp rate of 10 °C min−1 (held for 14 min). MS was performed in the EI ionisation mode with an energy of ionisation, an ionisation temperature and an interface temperature of 70 eV, 260 °C and 270 °C, respectively.3. Results and discussion
3.1. Characterisation of the 3D-GA
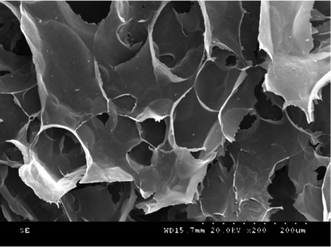
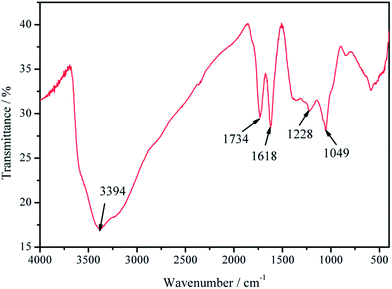
The characterisation of the as-prepared 3D-GA was carried out using SEM, XRD and a Fourier transform infrared (FTIR) spectrometer. The SEM image shown in Fig. 1 indicates that the 3D-GA is consisted of a honeycomb 3D porous networks with an average pore size of about 100 micrometres, and the pore walls are constructed from partially overlapped thin graphene sheets. Such kinds of 3D porous networks are conducive to the migration and adsorption of OPPs molecules in/on the 3D-GA, thus providing a favourable platform for the complete extraction of OPP residues from environmental water.The FTIR spectrum shown in Fig. 2 exhibits absorption bands at 3394 cm−1 that are attributable to O–H stretching vibration. A distinct band at 1734 cm−1 confirms the presence of carbonyl C![[double bond, length as m-dash]](https://www.rsc.org/images/entities/char_e001.gif) O groups that were not fully removed after chemical reduction. The band at 1618 cm−1 can be assigned to the stretching vibrations of C
O groups that were not fully removed after chemical reduction. The band at 1618 cm−1 can be assigned to the stretching vibrations of C![[double bond, length as m-dash]](https://www.rsc.org/images/entities/char_e001.gif) C conjugated bonds. In turn, the bands at 1228 and 1049 cm−1 can be attributed to the epoxy C–O–C stretching vibration, which suggests the presence of epoxide bonds24 that still remained in the 3D-GA.
C conjugated bonds. In turn, the bands at 1228 and 1049 cm−1 can be attributed to the epoxy C–O–C stretching vibration, which suggests the presence of epoxide bonds24 that still remained in the 3D-GA.
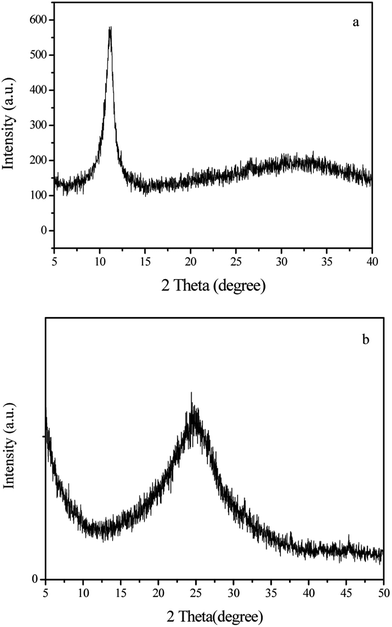
Shown in Fig. 3 are the XRD patterns of graphene oxide (GO) and the 3D-GA. It is obvious that GO has a larger interlayer distance than graphite according to the corresponding diffraction peak (2θ = 11.5°).25 However, this diffraction peak is completely disappeared after chemical reduction and a broad one centred at 24.6° is turned up, corresponding to the interlayer distance in 3D-GA. Therefore, it is concluded that graphene oxide is largely reduced to thin graphene sheets by ethylenediamine.
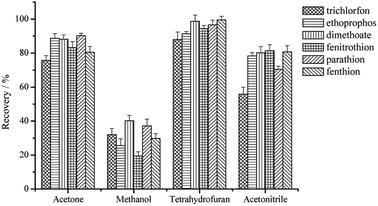
3.2. Optimisation of SPE procedures
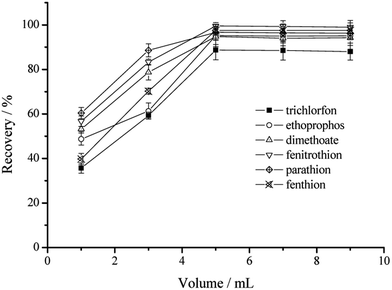
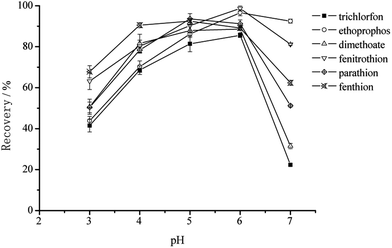
Several factors affecting the SPE performance were investigated in this paper. These parameters included the type and volume of the elution solvent, the pH value of water sample and the volume of water sample for a definite amount of 3D-GA.As shown in Fig. 6, the recovery is the highest at pH value of 6.0. Since OPPs are relatively unstable at pH > 7, some of them may be decomposed, leading to a low recovery of OPPs. On the other hand, the surface of graphene sheets is negatively charged. When the pH value is changed to 3–5, H+ would compete with OPPs to adsorb on 3D-GA, also leading to a low recovery of OPPs.
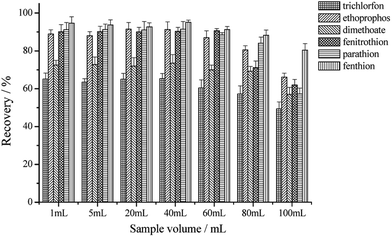
The packed SPE cartridge was loaded with 20–120 mL of mixed OPPs standard solutions at an overall concentration of 600 μg L−1 (100 μg L−1 for each compound). The rest of the experimental conditions were set as described in Section 2.4. It could be seen from Fig. 7 that the extraction recoveries do not change significantly for the six OPPs when the water sample volume increases from 1 to 40 mL. This means that for a definite amount of 3D-GA the adsorbed OPPs tend to be saturated and the enrichment factor is gradually increased with the increase in water sample volume. However, the extraction recoveries are significantly decreased for the six OPPs when the water sample volume is larger than 60 mL. This means that OPPs in 60 mL water sample are supersaturated for the same amount of 3D-GA and then some OPPs can not be recovered. Therefore, the loading volume of water sample has been identified as 40 mL.
3.3. Application of packed SPE in water samples
| Analyte | Linearity range (μg L−1) | r | LOD (μg L−1) | LOQ (μg L−1) | RSD % |
|---|---|---|---|---|---|
| Trichlorfon | 2∼500 | 0.9990 | 0.58 | 1.96 | 4.6 |
| Ethoprophos | 0.5∼500 | 0.9994 | 0.18 | 0.62 | 1.2 |
| Dimethoate | 1∼500 | 0.9993 | 0.32 | 1.06 | 3.4 |
| Fenitrothion | 1∼500 | 0.9992 | 0.21 | 0.68 | 2.8 |
| Parathion | 0.5∼500 | 0.9998 | 0.26 | 0.88 | 1.2 |
| Fenthion | 1∼500 | 0.9995 | 0.12 | 0.41 | 4.2 |
In order to estimate the quantitative accuracy of the proposed method, OPP-free real water samples were analysed with spiked concentration levels of 1, 5 and 10 μg L−1, respectively. Under the optimised conditions established above, the recoveries and RSDs of the six target compounds were calculated and listed in Table 2. It can be seen that the recoveries range from 93.8% to 104.2% and the RSD ranges from 1.1% to 5.6%, revealing the excellent sensitivity of the proposed method.
| Analyte | Spiked concentration levels (μg L−1) | Tap water | Lake water | Drinking water | River water |
|---|---|---|---|---|---|
| Trichlorfon | 1 | 100.3(5.2) | 95.5(5.1) | 102.5(4.3) | 93.8(3.6) |
| 5 | 97.3(5.6) | 94.2(4.2) | 94.1(2.2) | 95.3(2.4) | |
| 10 | 103.5(2.2) | 99.1(4.3) | 94.7(3.6) | 96.4(3.5) | |
| Ethoprophos | 1 | 96.5(3.2) | 100.2(2.5) | 95.6(2.5) | 103.2(2.8) |
| 5 | 96.5(4.4) | 96.2(3.6) | 99.5(5.4) | 98.9(1.1) | |
| 10 | 97.2(5.5) | 95.6(4.1) | 102.4(5.1) | 95.6(3.7) | |
| Dimethoate | 1 | 96.5(4.7) | 99.9(4.1) | 95.7(4.2) | 99.5(2.9) |
| 5 | 93.8(3.8) | 100.2(3.2) | 104.2(3.2) | 98.6(2.4) | |
| 10 | 96.2(2.2) | 96.3(2.2) | 99.9(1.5) | 103.4(4.5) | |
| Fenitrothion | 1 | 96.5(4.7) | 95.6(5.3) | 96.7(2.2) | 96.7(5.5) |
| 5 | 104.1(5.2) | 94.8(4.2) | 99.5(3.5) | 94.9(1.8) | |
| 10 | 99.2(1.8) | 98.4(2.3) | 97.8(4.1) | 101.2(4.2) | |
| Parathion | 1 | 93.8(3.5) | 103.5(3.8) | 95.6(4.8) | 95.5(5.6) |
| 5 | 94.6(1.3) | 99.3(4.6) | 97.3(5.0) | 97(5.4) | |
| 10 | 103.7(4.7) | 100.0(1.8) | 96.4(4.2) | 96.2(5.1) | |
| Fenthion | 1 | 97.7(3.2) | 95.2(5.5) | 102.6(1.5) | 97.8(2.3) |
| 5 | 99.5(1.5) | 97.5(2.6) | 95.6(2.2) | 96.3(3.4) | |
| 10 | 96.2(2.9) | 96.8(4.7) | 94.3(3.9) | 98.2(2.2) |
| Analyte | Tap water | Lake water | Drinking water | River water |
|---|---|---|---|---|
| Trichlorfon | N.D. | N.D. | N.D. | N.D. |
| Ethoprophos | N.D. | N.D. | N.D. | 0.54 |
| Dimethoate | N.D. | N.D. | N.D. | N.D. |
| Fenitrothion | N.D. | N.D. | N.D. | N.D. |
| Parathion | N.D. | N.D. | N.D. | 0.76 |
| Fenthion | N.D. | N.D. | N.D. | N.D. |
The real water and spiked water samples were simultaneous analyzed by the proposed procedure, and the analytical results from the spiked water samples confirmed that the proposed methodology could be applicable to the determination of trace OPPs in various water samples. On the other hand, OPPs are easily accumulated in river water, since they are often used as pesticides for agricultural purposes. Whereas, tap water, lake water and drinking water are rarely contaminated by OPPs, and then they were not detected.
3.4. Comparison of developed method with others
In order to evaluate the performance of the present method, a comparative study with other previously reported analytical technologies for the determination of OPPs including magnetic-SPE GC (MSPE-GC),2 microwave-assisted extraction and micro-SPE (MAE-μ-SPE) GC/MS (MAE-μ-SPE-GC/MS),3 LLME-HPLC-UV,6 d-SPE-GC/MS,8 elevated temperature-DLLME-GC (ET-DLLME-GC),26 LLE-GC,27 and QuEChERS-GC-QTOF-MS28 was carried out. Listed in Table 4 are the experimental results including RSD, linearity range, LOD and recovery. It can be seen from Table 4 that the proposed method exhibits the best correlation coefficient, the highest recovery and the highest precision among the technologies listed. Moreover, the proposed method shows a limit of detection comparable to that of LLME-HPLC-UV, which is much lower than that of ET-DMLLE-GC, d-SPE-GC/MS, LLE-GC, MAE-μ-SPE-GC/MS, MSPE-GC and QuEChERS-GC-QTOF-MS. Additionally, the proposed method also demonstrates relatively wider linearity range than that of LLME-HPLC-UV or MAE-μ-SPE GC/MS, and covers lower linearity range than that of ET-DMLLE-GC, LLE-GC, MSPE-GC and QuEChERSGC-QTOF-MS. In summary, the identification and quantification of OPPs in water evidences that the advantages of the proposed method lie in low detection limit, high recovery, offering a novel and applicable procedure for the analysis of trace OPPs in water sample.| Method | Matrix | r | Linearity range | Recovery (%) | Precision (RSD %) | LOD | Ref. |
|---|---|---|---|---|---|---|---|
| LLME-HPLC-UV | Water and juice | 0.9984 | 0.5–400 μg L−1 | 92.2–111.5 | <5.7 | 0.10–0.35 μg L−1 | 2 |
| DMLL-GC | Aqueous samples | 0.998 | 2.6–1000 μg L−1 | 64–83 | <5.7 | 0.82–1.65 μg L−1 | 3 |
| d-SPE-GC/MS | Peanut oil | 0.9982 | 0.25–1000 μg kg−1 | 85.9–114.3 | <8.5 | 0.7–1.6 μg kg−1 | 6 |
| LLE-GC | Dried fruits | 0.9973 | 4.0–1000 μg L−1 | 70–110 | <7.3 | 4–30 ng mL−1 | 8 |
| MAE-μ-SPE-GC/MS | Vegetable and fruit | 0.9995 | 0.50–50 μg kg−1 | 93.5–104.6 | <8.7 | 0.06–0.23 μg kg−1 | 26 |
| MSPE-GC | Water samples | 0.9990 | 100–1000 μg L−1 | 83–105 | <8.7 | <100 μg L−1 | 27 |
| QuEChERS-GC-QTOF-MS | Fruits and vegetables | 0.9845 | 10–1000 μg L−1 | 70.0–115.9 | <19.5 | 1.18–5.55 μg kg−1 | 28 |
| 3D-GA-SPE-GC/MS | Water | 0.9998 | 0.5–500 μg L−1 | 93.8–104.2 | <5.6 | 0.14–0.58 μg L−1 | This study |
4. Conclusions
A 3D-GA prepared by chemical reduction of an aqueous solution of graphene oxides followed by freeze-drying treatment was packed in an SPE cartridge for the extraction of OPPs. Because of its well-developed porous structure and large specific surface area, 3D-GA was evinced to be a very efficient adsorbent for the SPE enrichment and purification of OPPs.Coupled with GC/MS techniques, the 3D-GA packed SPE was applied to the determination of six OPPs (trichlorfon, ethoprophos, dimethoate, fenitrothion, parathion and fenthion) in water samples, and satisfactory linearity, high precision, good repeatability and high recovery were achieved. The results presented herein indicate that the present method could be used efficiently for the determination of trace OPPs in a variety of water samples.
Conflicts of interest
There are no conflicts to declare.Acknowledgements
This research was supported by the National Natural Science Foundation of China (Grants 51572071, 51072047) and the Program for Innovative Research Team in University (The Ministry of Education of China, Grant IRT-1237).References
- J. Hassan and M. Sarkouhi, Arabian J. Chem., 2016, 9, 38 CrossRef CAS.
- H. R. Nodeh, W. A. W. Ibrahim, M. A. Kamboh and M. M. Sanagi, Chemosphere, 2017, 166, 21 CrossRef PubMed.
- Z. M. Wang, X. Zhao, X. Xu, L. J. Wu, R. Su, Y. J. Zhao, C. F. Jiang, H. Q. Zhang, Q. Ma, C. M. Lu and D. M. Dong, Anal. Chim. Acta, 2013, 760, 60 CrossRef CAS PubMed.
- G. Cinelli, P. Avino, I. Notardonato and M. V. Russo, Anal. Methods, 2014, 6, 782 RSC.
- S. Boulanouar, S. Mezzache, A. Combès and V. Pichon, Talanta, 2017, 176, 465 CrossRef PubMed.
- P. Zohrabi, M. Shamsipur, M. Hash and B. Hashemi, Talanta, 2016, 160, 340 CrossRef CAS PubMed.
- L. J. Wu, Y. Song, M. Z. Hu, X. Xu, H. Q. Zhang, A. M. Yu and Z. M. Wang, Talanta, 2015, 134, 366 CrossRef CAS PubMed.
- R. Su, X. Xu, X. H. Wang, D. Li, X. Y. Li, H. Q. Zhang and A. M. Yu, J. Chromatogr. B: Anal. Technol. Biomed. Life Sci., 2011, 879, 3423 CrossRef CAS PubMed.
- V. Sharifi, A. Abbasi and A. Nosrati, J. Food Drug Anal., 2016, 24, 264 CrossRef CAS PubMed.
- L. J. Wu, M. Z. Hu, Z. C. Li, Y. Song, H. Q. Zhang, A. M. Yu, Q. Ma and Z. M. Wang, J. Chromatogr. A, 2015, 1407, 42 CrossRef CAS PubMed.
- L. Jiang, T. J. Huang, S. Feng and J. D. Wang, J. Chromatogr. A, 2016, 1456, 49 CrossRef CAS PubMed.
- R. Su, D. Li, X. H. Wang, H. M. Yang, X. Y. Shi and S. Y. Liu, J. Chromatogr. B: Anal. Technol. Biomed. Life Sci., 2016, 1022, 141 CrossRef CAS PubMed.
- H. B. Zheng, Q. Zhao, J. Z. Mo, Y. Q. Huang, Y. B. Luo, Q. W. Yu and Y. Q. Feng, J. Chromatogr. A, 2013, 1300, 127 CrossRef CAS PubMed.
- I. Notardonato, P. Avino, G. Cinelli and M. V. Russo, RSC Adv., 2014, 4, 42424 RSC.
- M. H. M. Facure, L. A. Mercante, L. H. C. Mattoso and D. S. Correa, Talanta, 2017, 167, 59 CrossRef CAS PubMed.
- C. Y. Liu, H. Y. Liu, A. R. Xu, K. Y. Tang, Y. Huang and C. Lu, J. Alloys Compd., 2017, 714, 522 CrossRef CAS.
- Y. C. Shi, A. J. Wang, X. L. Wu, J. R. Chen and J. J. Feng, J. Colloid Interface Sci., 2016, 484, 254 CrossRef CAS PubMed.
- B. Tan, H. M. Zhao, Y. B. Zhang, X. Quan, Z. H. He, W. T. Zheng and B. Y. Shi, J. Colloid Interface Sci., 2018, 512, 853 CrossRef CAS PubMed.
- S. Mahpishanian and H. Sereshti, J. Chromatogr. A, 2016, 1443, 43 CrossRef CAS PubMed.
- X. M. Wang, M. X. Lu, H. Wang, Y. F. Pei, H. H. Rao and X. Z. Du, Sep. Purif. Technol., 2015, 153, 7 CrossRef CAS.
- X. M. Wang, M. X. Lu, H. Wang, P. F. Huang, X. M. Ma, C. Cao and X. Z. Du, New J. Chem., 2016, 40, 6308 RSC.
- W. S. Hummers and R. E. Offeman, J. Am. Chem. Soc., 1958, 80, 1339 CrossRef CAS.
- Q. Liu, J. B. Shi, L. X. Zeng, T. Wang, Y. Y. Cai and G. B. Jiang, J. Chromatogr. A, 2011, 1218, 197 CrossRef CAS PubMed.
- I. Kondratowicz, K. Żelechowska, M. Nadolska, A. Jażdżewska and M. Gazda, Colloids Surf., A, 2017, 528, 65 CrossRef CAS.
- S. Z. Zu and B. H. Han, J. Phys. Chem. C, 2009, 113, 13651 CAS.
- M. A. Farajzadeh, M. R. A. Mogaddam, S. R. Aghdam, N. Nouri and M. Bamorrowat, Food Chem., 2016, 212, 198 CrossRef CAS PubMed.
- X. S. Zhao, W. J. Kong, J. H. Wei and M. H. Yang, Food Chem., 2014, 162, 270 CrossRef CAS PubMed.
- Z. P. Cheng, F. S. Dong, J. Xu, X. G. Liu, X. H. Wu, Z. L. Chen, X. L. Pan, J. Gan and Y. Q. Zheng, Food Chem., 2017, 231, 365 CrossRef CAS PubMed.
| This journal is © The Royal Society of Chemistry 2018 |

