 Open Access Article
Creative Commons Attribution 3.0 Unported Licence
An environmentally sustainable plasticizer toughened polylactide
Hailan Kang a,
Yushi Lia,
Ming Gonga,
Yilin Guoa,
Zhuo Guoa,
Qinghong Fang*a and
Xue Li*b
aCollege of Materials Science and Engineering, Shenyang University of Chemical Technology, Shenyang, 110142, China. E-mail: fqh80@126.com
bDepartment of Chemistry and Textile Engineering, Jiaxing University Nanhu College, Jiaxing, 314001, China. E-mail: lixue850704@163.com
First published on 26th March 2018
Abstract
Cardanol (CD), derived from renewable natural cashew nutshell liquid, has been used as a new plasticizer for polylactide (PLA), to create blends which retain the environmentally friendly features of PLA. The differential scanning calorimetry (DSC), dynamic mechanical thermal analysis (DMTA) and scanning electron microscopy (SEM) results all reveal that PLA and CD show good miscibility at low CD content. CD significantly decreased the glass transition temperature and enhanced the crystallization ability of PLA, demonstrating good plasticizing efficiency with PLA. At 10 wt% CD, ultimate elongation and impact toughness increased to 472% and 9.4 kJ m−2, respectively, which represented improvements of 31-fold and 2.6-fold over the corresponding measurements for neat PLA. The plasticization effect of CD was also demonstrated by the decreased melt complex viscosity and shear storage modulus at lower CD content for the blends when compared with neat PLA. Thus, the investigated CD presents an interesting candidate for a PLA plasticizer, meeting “double green” criteria. No cytotoxicity was found for the blends and hence they may be suitable for biomedical applications.
Introduction
Polylactide (PLA), a most popular green plastic, provides a promising alternative to polymers derived from petroleum, and attracts much interest.1–3 Because of its renewability, biodegradability, biocompatibility and competitive physical properties, PLA has thus been applied in biomedical materials, packaging, and the automotive industry. However, despite all its suitable characteristics, PLA is limited by its inherent brittle nature and low crystallization ability.Various approaches, including plasticization, copolymerization, and mixing with polymers or inorganic fillers, have been adopted to increase the toughness of PLA. PLA has been mixed with non-renewable and renewable polymers such as poly(ε-caprolactone),4 poly(ethylene oxide),5 polyurethane,6,7 polyamide,8 polyethylene,9 poly(butylene succinate),10,11 poly(butylene adipate-co-terephthalate),12 biobased polyesters,13,14 natural rubber15,16 and so on. Among the numerous toughening agents, plasticizers are preferentially used to reduce the brittleness of PLA. For example, several citrate esters, including triethyl citrate (TEC), tributyl citrate (TBC), acetyltriethyl citrate (ATEC), and acetyltributyl citrate (ATBC), have been used to modify PLA.17 All of the plasticized PLA blends exhibited a reduced glass transition temperature (Tg) and an improved elongation at break. However, citrate esters with relatively low boiling points resulted in considerable weight loss during processing. Other ester-type plasticizers, such as glycerin triacetate (GTA) and bis(2-ethylhexyl) adipate (DOA), were effective in reducing the Tg of the blend but PLA plasticized with ∼25 wt% GTA18 or 20 wt% DOA19 exhibited phase separation. Oligomeric or polymeric plasticizers could reduce the migration and evaporation of the small molecule plasticizers and many studies have paid attention to the utilization of poly(ethylene glycol) (PEG) for PLA.20,21 The molecular weight as well as the additive amount of PEG influences the miscibility between PLA and PEG. The PLA/PEG blends with lower molecular weight PEG exhibited better miscibility, reducing the Tg to a greater extent. Modification of PLA has also been achieved via the addition of lactide monomers,22 soybean oil derivatives,23,24 castor oil derivatives,25,26 tartaric acid derivatives27 and so on. However, the challenge remains to find a new renewable plasticizer meeting the requirements of both a sustainable origin and biodegradable properties, to fulfill “double green” criteria.
Cardanol (m-pentadecenyl phenol, CD) is a type of renewable agricultural by-product extracted from cashew nutshell liquid.28 CD has desirable features due to its chemical structure: (i) the benzene ring structure leads to high-temperature performance; (ii) the polar phenol hydroxyl group provides wetting and activity to the contact surface; and (iii) the long unsaturated side chain with 15 carbon atoms endows CD with excellent flexibility and reactivity. The structure is shown in Fig. 1. CD and its derivatives are used as additives in biocomposites,29 synthetic plastics,30,31 and rubbers32 owing to their sustainability, low cost, biodegradability, and significant antioxidant characteristics. Mohapatra and Nando32 developed CD grafted natural rubber with a higher molecular weight, a higher cure rate and better physical-mechanical properties than unmodified natural rubber. Chen et al.33 reported that CD-based derivatives are more efficient than dioctyl phthalate in plasticizing PVC.
CD-derivatives, such as di-functional glycidyl ether epoxy cardanol (ECD) or methoxylated hydroxyethyl cardanol (MeCD), have been used as plasticizers for PLA by Hassouna and coworkers.34,35 However, there are no detailed studies of CD as the PLA modifier. CD is a commercial product and meets the “double green” criteria. Importantly, the existence of –OH groups in both CD and PLA implies some compatibility between PLA and CD. Thus, we employ CD as a PLA plasticizer and develop environmentally sustainable PLA/CD blends. In this work, the miscibility, thermal and crystallization behaviors, mechanical properties, processability and cytocompatibility of PLA/CD blends are analyzed and investigated in detail.
Experimental section
Materials
The polylactide (PLA, Grade 2003D) was provided by Nature Works and dried for 24 h in a vacuum oven at 60 °C before use. Cardanol (CD, purity of 98%) was purchased from Jining Hongming Chemical Reagent Co., Ltd (China). Antioxidant 1010 was purchased from Sinopharm Chemical Reagent Co., Ltd. Mouse preosteoblasts (MC3T3-E1) were kindly donated by Beijing Jishuitan Hospital (China).Preparation of PLA/CD blends
PLA, CD and antioxidant 1010 (0.3 wt%) were mixed at 170–180 °C in a torque rheometer for 10 min at a rotation speed of 80 rpm. The weight ratios of CD to PLA were varied from 0 wt% to 30 wt%. For brevity, the blend containing 10 wt% CD was abbreviated to PLA/CD-10. Finally, the samples were compressed into 1 mm thick sheets at 180 °C for 5 min, and were then cold-pressed.Characterization
DSC measurement was carried out under N2 with a Q200 differential scanning calorimeter (TA Instruments). The specimens were first heated to 190 °C, then cooled to 0 °C, and finally reheated to 190 °C at 10 °C min−1. The quenched specimens were directly cooled to −80 °C, and heated to 190 °C at 10 °C min−1. The degree of crystallinity of PLA was calculated using the enthalpy of fusion of 100% crystalline PLA, equal to 93 J g−1.36 Gold-coated sample surfaces were characterized by a SU8010 scanning electron microscope (Hitachi Co., Ltd) at 5 kV.Dynamic mechanical thermal analysis (DMTA) was performed on a dynamic mechanical analyzer (PE Instruments) in tensile mode at 1 Hz and at a heating rate of 3 °C min−1 from −100 °C to 150 °C. Wide-angle X-ray diffraction (WAXD) was performed on a Rigaku RINT diffractometer with Cu Kα radiation (40 kV, 200 mA) in the 2θ range of 5° to 50° at a scan rate of 5° min−1. Thermogravimetric analysis (TGA, Q50, TA Instruments) was used to investigate the thermal decomposition behavior. The TGA measurements were carried out from 40 to 600 °C at a heating rate of 20 °C min−1 under N2.
The tensile properties of the PLA/CD blends were tested by using a RGL-3UA tensile testing machine according to ASTM D638 at a crosshead speed of 10 mm min−1. The notched Izod impact tests were performed on a Gotech impact machine according to ASTM D256. Rheological experiments were measured on an ARES-G2 rotational rheometer (TA Instruments) in frequency sweep mode from 0.1 to 100 Hz at 180 °C with a strain of 1%.
Cell viability was measured using mouse preosteoblasts (MC3T3-E1) and 3-(4,5-di-methylthiazol-2-yl)-2,5-diphenyltetrazolium bromide (MTT) assays. All samples were cut into slices, sterilized by washing with 75% ethanol, and then rinsed twice with PBS solution. Samples were exposed to Co60 for 15 min and incubated in Dulbecco's modified Eagle's medium (DMEM) at the ratio of 3 cm2 mL−1 for 24 h at 37 °C. The extract solutions were then filtered (0.22 μm pore size) to eliminate the possible presence of solid particles in the samples. MC3T3-E1 cells were grown in DMEM supplemented with 10% fetal bovine serum (FBS) at a density of 5.0 × 10⁴ cells per well and incubated in 5% CO2 under humidified conditions at 37 °C. After the incubation, the medium was replaced by the prepared extract dilution which was used as the new culture medium, while the initial medium itself was regarded as a negative control. The cells were allowed to proliferate for 3 days, and the number of viable cells was determined by adding 5 mg mL−1 MTT in culture medium. After a further incubation of 4 h, the medium was aspirated, the formed blue formazan crystals were dissolved in isopropanol (BDH, Poole, England), and the absorbance at 450 nm was determined. All sample extracts were tested at least three times to obtain consistent results. The relative viability was calculated by:
| Relative cell viability = (Atest − A0)/(Acontrol − A0) |
Result and discussion
Miscibility and morphology
The miscibility of the polymer blends was characterized and analyzed using the Tg values of blends of various compositions. We quenched the molten samples by immersion into liquid nitrogen, and the DSC curves obtained from the quenched samples are shown in Fig. 2a. The PLA exhibited a Tg value of around 61 °C. All blends exhibited only one Tg, suggesting a good miscibility between PLA and CD. The Tg of the PLA/CD blend dropped significantly with increasing CD content, most likely demonstrating good plasticizing efficiency with PLA. For instance, the Tg value of PLA decreased by 43 °C and 17 °C for PLA/CD-10 and PLA/CD-20, respectively. As the content of CD was increased to 20 wt%, the Tg peak became very broad and nearly indistinguishable. Thus, the content of CD in the blends is below 20 wt% in the following discussion.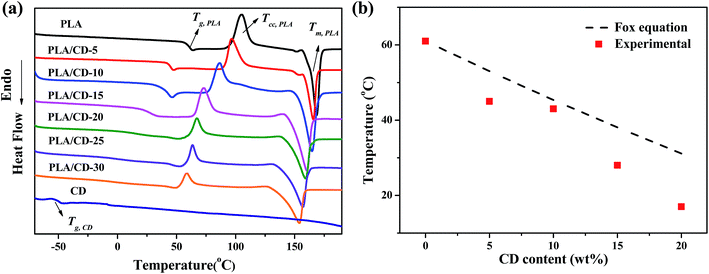 | ||
| Fig. 2 (a) DSC thermograms of PLA, PLA/CD blends and CD; (b) plot of glass transition temperature vs CD content. | ||
The Tg values obtained from DSC are plotted in Fig. 2b according to the Fox equation37
Scanning electron microscopy (SEM) was employed to further evaluate miscibility and phase morphology. Fig. 3 shows the SEM micrographs for cryo-fractured surfaces of the PLA/CD blends. As shown in Fig. 3a and b, PLA/CD-5 and PLA/CD-10 exhibit rough surfaces and few voids can be observed, suggesting that CD is only partially miscible with PLA at lower content. A partially miscible system should exhibit two Tg peaks in the DSC curves. However, a Tg peak attributing to CD was not detected, owing to the relatively low CD content in the blends and the limitations of the DSC technique. As we know, the DSC equipment is insensitive to low enthalpy changes at a slow scanning rate. For PLA/CD-15, PLA/CD-20 and PLA/CD-25, no voids can be seen (Fig. 3c–e) and phase separation does not occur, indicating that CD is miscible with PLA. Since small molecule plasticizers migrate toward the surfaces during storage (about 20 days), the surface of PLA/CD-30 is very obscure and phase separation occurs.
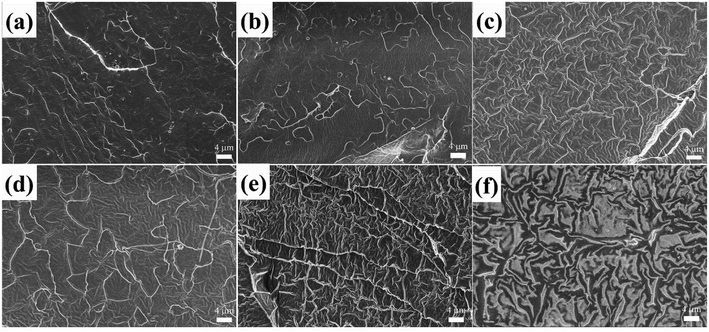 | ||
| Fig. 3 SEM micrographs for cryo-fractured surfaces of PLA/CD blends: (a)PLA/CD-5; (b) PLA/CD-10; (c)PLA/CD-15; (d) PLA/CD-20; (e)PLA/CD-25; (f) PLA/CD-30. | ||
Dynamic mechanical thermal analysis
Fig. 4 shows the tan delta (tan![[thin space (1/6-em)]](https://www.rsc.org/images/entities/char_2009.gif) δ) and tensile storage modulus (E′) as a function of temperature for the blends. In Fig. 4a, the temperature at the maximum value of tan
δ) and tensile storage modulus (E′) as a function of temperature for the blends. In Fig. 4a, the temperature at the maximum value of tan![[thin space (1/6-em)]](https://www.rsc.org/images/entities/char_2009.gif) δ corresponds to the Tg. The PLA/CD blends show only one Tg when the CD content is lower than 15 wt%, and the Tg values of PLA/CD blends distinctly shift to the lower temperature region with increasing CD content, in line with the aforementioned DSC analysis. The single Tg for each sample and the reduction in Tg with increasing CD content both indicate that PLA is miscible with CD. No peak was observed for the PLA/CD blends with CD content higher than 15 wt%, because the blends had already attained high crystallinity.
δ corresponds to the Tg. The PLA/CD blends show only one Tg when the CD content is lower than 15 wt%, and the Tg values of PLA/CD blends distinctly shift to the lower temperature region with increasing CD content, in line with the aforementioned DSC analysis. The single Tg for each sample and the reduction in Tg with increasing CD content both indicate that PLA is miscible with CD. No peak was observed for the PLA/CD blends with CD content higher than 15 wt%, because the blends had already attained high crystallinity.
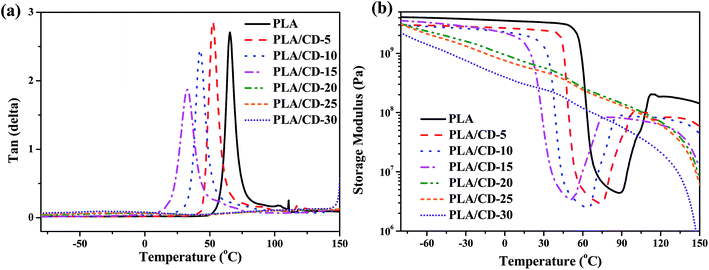 | ||
Fig. 4 Dynamic viscoelastic curves of PLA and PLA/CD blends: (a) tan![[thin space (1/6-em)]](https://www.rsc.org/images/entities/char_2009.gif) δ versus temperature; (b) storage modulus versus temperature. δ versus temperature; (b) storage modulus versus temperature. | ||
As shown in Fig. 4b, the E′ of PLA drops sharply at around 54–75 °C due to the glass transition, then rises at around 90 °C due to cold crystallization, and subsequently drops again at around 125 °C due to crystal melting. For the PLA/CD blends, the E′ curves show two very different trends. When the CD content is lower than 15 wt%, the trend of the E′ curves for the PLA/CD blends is similar to that for PLA. The E′ at the glassy state gradually decreases with increasing CD content. The temperature at which E′ starts to rise shifts to a lower temperature region with increasing CD content, indicating that the introduction of CD enhances the cold crystallization ability of PLA. In contrast, when the CD content is higher than 15 wt%, the E′ of the PLA/CD blends decreases with both temperature and CD content. A rise of E′ due to the cold crystallization of PLA is not observed, suggesting that the molded sample has already attained almost the ultimate crystallinity before the dynamic viscoelastic test.
Thermal and crystalline behaviors
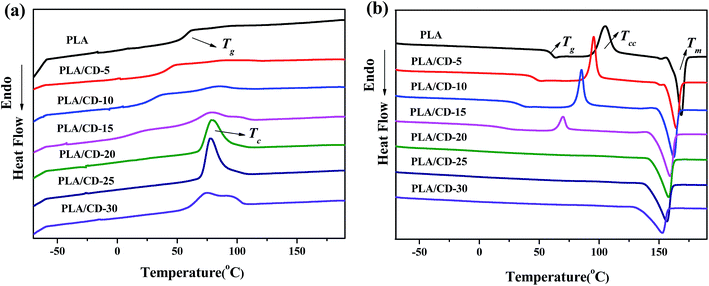
The DSC curves of PLA and its blends are exhibited in Fig. 5, and the relevant results obtained from the DSC curves are summarized in Table 1. Upon heating, PLA shows a clear glass transition at 61 °C, a cold-crystallizing peak at 105 °C and a melting peak at 168 °C (Fig. 5b). As shown in Fig. 5b, the PLA/CD blends cold-crystallize at 70–96 °C, and the cold crystallization temperature (Tcc) of PLA decreases as the CD content increases. When the CD content is higher than 15 wt%, the cold-crystallizing peak cannot be observed, but the PLA/CD blends exhibit a sharp and intense crystallization peak during cooling. The higher CD content shifts the crystallizing peak to a lower temperature, and increases the heat of crystallization (ΔHc) to a higher value. This phenomenon can be ascribed to two main factors: (1) the increased chain mobility which enables PLA to crystallize at a lower temperature upon cooling; (2) the role of the plasticizer as a nucleating agent. Similarly, the melting temperature (Tm) shifts to a lower temperature by 5 to 16 °C and the enthalpy of fusion increases with increasing CD content. In parallel, the degree of crystallinity increases from 1% to 46%, similarly showing that the enhanced chain mobility increases the ability of the PLA chains to crystallize.| CD content (%) | Tg (°C) | Tc (°C) | ΔHc (J g−1) | Tcc (°C) | ΔHcc (J g−1) | Tm (°C) | ΔHm (J g−1) | Crystallinity (%) |
|---|---|---|---|---|---|---|---|---|
| a Tg was obtained from the quenched samples; the values of ΔHc, ΔHcc, ΔHm were normalized; the crystallinity was calculated by DSC curves. | ||||||||
| 0 | 61 | — | — | 105 | 33.2 | 169 | 33.7 | 0.5 |
| 5 | 45 | 93 | 1.0 | 96 | 29.9 | 165 | 32.6 | 2.9 |
| 10 | 43 | 85 | 6.1 | 85 | 25.8 | 162 | 37.8 | 12.9 |
| 15 | 28 | 78 | 16.1 | 70 | 12.5 | 159 | 39.2 | 28.7 |
| 20 | 15 | 78 | 33.1 | — | — | 158 | 40.4 | 43.4 |
| 25 | 5 | 77 | 36.5 | — | — | 157 | 42.7 | 45.9 |
| 30 | −5 | 74 | 42.1 | — | — | 153 | 43.0 | 46.2 |
| 100 | −50 | — | — | — | — | — | — | — |
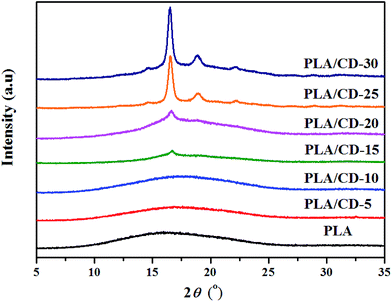
Wide-angle X-ray diffraction (WAXD) spectra were employed to further investigate the crystallization behavior of the PLA/CD blends. As seen in Fig. 6, PLA shows an amorphous structure with no diffraction peaks. PLA/CD blends containing lower CD content, display no diffraction peaks, suggesting that the blends are primarily amorphous. However, diffraction peaks of PLA/CD blends appear and become more intense with the addition of more CD, consistent with the DSC results. When the CD content is higher than 15 wt%, a diffraction peak at 2θ ≈ 16.5° appears, corresponding to the (110/200) crystalline plane of α′ or α crystal forms.38 In addition, diffraction peaks at around 14.6°, 18.8° and 22.2° are detected, relating to the (010), (203) and (015) planes, respectively.38
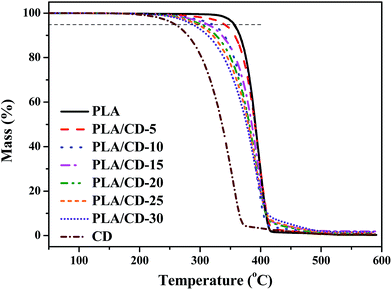
We also investigated the thermal stability of the PLA/CD blends, and the TGA curves are shown in Fig. 7. The thermal decomposition of neat PLA begins at about 320 °C and reaches a maximum degradation rate at about 398 °C, while thermal decomposition of CD begins at about 220 °C and reaches a maximum degradation rate at about 340 °C. All the blends reveal a single stage decomposition at 290–420 °C, and a maximum degradation rate at 387–398 °C, similar to that of neat PLA. For the PLA/CD blends, the thermal decomposition starts at a lower temperature compared with that of PLA. Therefore, the addition of CD slightly influences the thermal stability of PLA, but it meets the requirements of most applications.
Mechanical properties
The stress–strain behavior of the PLA/CD blends was tested at room temperature, as shown in Fig. 8a. Neat PLA fractures without yielding, exhibiting as a brittle material with a high tensile strength of 52.4 MPa and a low elongation at break of 15%. For PLA/CD-10, a pronounced yield followed by a stable neck is observed; the tensile strength drops to 25.1 MPa and the elongation at break increases to 472%, representing a 31-fold improvement over the value for neat PLA. The increase of CD content to 15 wt% further decreases the tensile strength to about 22.5 MPa, while no yield point is found. Thus, the PLA/CD blends containing more than 15 wt% CD exhibit the stretch behavior of elastomers. Such material flexibility improvement is directly related to the significant increase in chain mobility. The tensile strength and tensile modulus of blends decrease with increasing CD content, which can be reasonably explained by the introduction of small molecules. Thus, the addition of plasticizers causes a decrease in the tensile modulus and tensile strength and an increase in the elongation at break for all the blends. Compared with CD derivatives, the increase in elongation at break of our PLA/CD blend (from 15% to 472%, 31 times) may surpass that found in the previous studies on the toughening of PLA. For example, the elongation at break of a PLA/methoxylated hydroxyethyl cardanol blend increased from 12% to 198%, 16.5 times that of neat PLA.35 For a PLA/di-functional glycidyl ether epoxy cardanol blend prepared through in situ reactive grafting, the elongation at break increased from 5.7% to 49%.34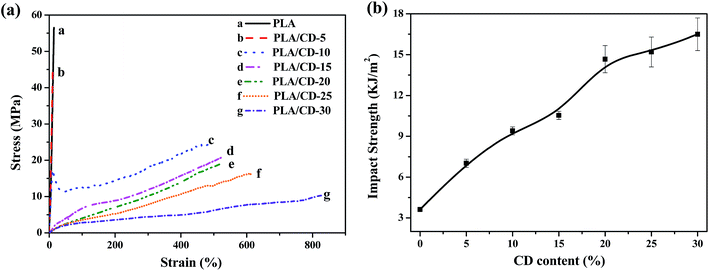 | ||
| Fig. 8 (a) The stress–strain curves of PLA/CD blends; (b) effect of CD content in the blends on impact strength. | ||
The impact strength represents the ability of a material to absorb fracture energy during an impact process. The most common and useful measurement of impact strength is the notched impact strength. Therefore, we adopted the notched Izod impact test to characterize the effect of CD on impact toughness. As shown in Fig. 8b, the notched Izod impact strength increases markedly with CD content, and reaches its maximum value at 30 wt% CD. The maximum impact strength is 16.5 kJ m−2, a 4.6-fold improvement compared to that of neat PLA.
To identify the toughening effect of CD on PLA/CD blends, the impact-fractured surfaces were studied by SEM. For PLA (Fig. 9a), smooth surfaces with no matrix deformation were found, indicating brittle failure. As shown in Fig. 9b, the fracture surfaces were rough and exhibited some matrix deformation, demonstrating ductile fracture. Under an applied stress, crazes were initiated and propagated outwards to the maximum applied stress. Craze growth was borne by the presence of bridging fibrils (Fig. 9c). For PLA/CD blends, some voids were observed, as shown in Fig. 9d. These voids, forming by cracks, expanded slowly by the breakdown of the surrounding craze fibrils until a void became a crack of a critical size that could propagate catastrophically. PLA/CD blends absorbed more energy than PLA during the process of craze growth, owing to the improved chain mobility.
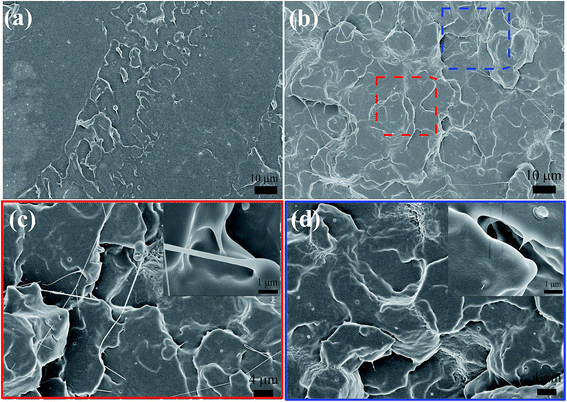 | ||
| Fig. 9 SEM micrographs for impact-fractured surfaces of PLA/CD blends: (a) PLA; (b), (c) and (d) PLA/CD-10. | ||
Rheological properties
To investigate the effect of CD content on the melt rheological properties, frequency sweeps were carried out at 180 °C. Fig. 10a and b present the frequency dependences of complex viscosity (η*) and the shear storage modulus (G′) of PLA and PLA/CD blends, respectively. The PLA/CD blends display a lower viscosity and more obvious shear thinning behavior than PLA. Two types of complex viscosity curves can be observed. When the CD content is lower than 15 wt%, an obvious newtonian plateau is observed in the low frequency region and a reduction in complex viscosity occurs in the high frequency region. In contrast, the blends with high CD content (above 15 wt%) exhibit stronger shear thinning behavior with increasing CD content in the low frequency region. The decreased melt viscosity of the blend is ascribed to an increased free volume due to the plasticization by CD.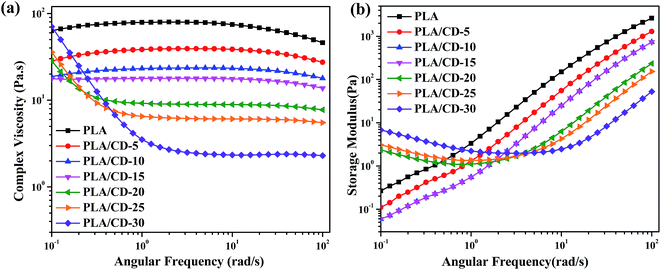 | ||
| Fig. 10 Variation of complex viscosity (a) and storage modulus (b) versus angular frequency at 180 °C for PLA and PLA/CD. | ||
The shear storage modulus (G′) is sensitive to the composition of the PLA/CD blends, and increases with increasing frequency. G′ increases with decreasing CD content. The blends with low CD content (below 15 wt%) show lower G′ values than PLA across the full frequency range. G′ values exhibit an apparent plateau in the low frequency region when the CD content is increased to above 15 wt%. Generally, G′ is related to the elasticity of the microstructure, and the enhancement in G′ represents the enhanced elastic response of the melt under shear conditions.
Cytocompatibility
The cytotoxicity of PLA/CD blends was evaluated to determine their suitability for biomedical applications. MC3T3-E1 cells were used in our cytotoxicity assays; the number and morphology of the cells in the extracts were observed. The values of optical density (OD) correspond to the number of live cells in the extract. Based on the cell relative growth rates (RGR) calculated from the OD values, the cytotoxicity of materials can be classified into six grades, shown in Table 2. Grades 0 and 1 mean that the material presents no or very low cytotoxicity to cells, and can be accepted as “qualified” in biomedicine. A material with Grade 2 should be further considered by examining its cell morphology. Other grades are regarded as “unqualified,” indicating that the material presents very high cytotoxicity and cannot be used as a biomaterial. The OD values and RGR for neat PLA and PLA/CD blends are shown in Fig. 11. The OD values of the cells incubated on the substrates increased with time and even outnumbered that from the control after incubation for 3 days. The RGR values of the cells cultured on the blend substrates for 3 days were above 100% and were characterized as grade 0 except for PLA/CD-30. Therefore it is concluded that PLA/CD blends with low CD content show no toxicity to cell viability. As seen in Fig. 12, MC3T3-E1 cells show a normal stellate morphology and exhibit no negative response to PLA/CD blends with low CD content after incubation for 3 days, suggesting no cytotoxicity and the potential biocompatibility of the PLA/CD blends.| RGR (%) | ≥100 | 75–99 | 50–74 | 25–49 | 1–24 | 0 |
| Cytotoxicity grade | 0 | 1 | 2 | 3 | 4 | 5 |
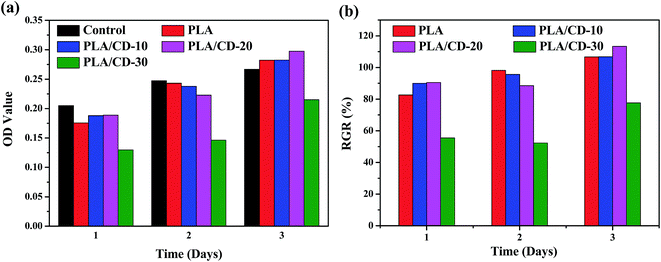 | ||
| Fig. 11 Optical density (OD) value (a) and relative growth rate (RGR/%) (b) of MC3T3-E1 cells cultured on PLA and PLA/CD blends compared with that on control substrate. | ||
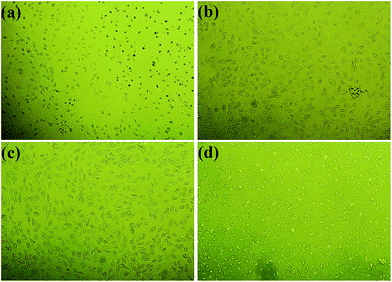 | ||
| Fig. 12 Photomicrographs of MC3T3-E1 cells incubated for 3 days in the negative control (a), and the extract substrates of (b) PLA, (c) PLA/CD-10 (d) PLA/CD-20. | ||
Conclusions
Renewable blends were prepared by the melt mixing of PLA and CD. DSC and SEM micrographs showed that PLA and CD exhibit good miscibility when the CD content is below 25 wt%. The DSC results showed that blending PLA with CD reduced significantly the Tg value of the resulting polymer blend, in comparison to that of pure PLA. The crystallization ability of PLA was improved by incorporating CD due to the enhanced chain mobility. The addition of CD slightly reduced the thermal stability of the blends. Considering its good plasticizing efficiency and comprehensive mechanical properties, the PLA/CD blend with 10 wt% CD was identified as the optimal formulation. At this optimal formulation, the elongation at break was significantly enhanced by 31-fold to 472% when compared to pure PLA; meanwhile, the impact toughness was improved by 2.6-fold. The obvious plastic deformation, decreased melt viscosity and shear storage modulus of the blends demonstrated the excellent plasticization effect of CD. In vitro cytotoxicity tests showed that these PLA/CD composites are non-toxic towards MC3T3-E1 cells. Collectively, these results demonstrate that cardanol can effectively plasticize PLA; it is a new renewable plasticizer for PLA, holding great potential for biomedical applications.Conflicts of interest
There are no conflicts to declare.Acknowledgements
This work was supported by the National Natural Science Foundation of China (No. 51573098 and 51703133), the National Key Research and Development Program of China (No. 2017YFB0306902) and Technology Plan Projects of Jiaxing City, Zhejiang Province, China (No. 2015AY11015).References
- K. Madhavan Nampoothiri, N. R. Nair and R. P. John, An overview of the recent developments in polylactide (PLA) research, Bioresour. Technol., 2010, 101, 8493–8501 CrossRef CAS PubMed.
- K. S. Anderson, K. M. Schreck and M. A. Hillmyer, Toughening Polylactide, Polym. Rev., 2008, 48, 85–108 CrossRef CAS.
- H. Liu and J. Zhang, Research progress in toughening modification of poly(lactic acid), J. Polym. Sci., Part B: Polym. Phys., 2011, 49, 1051–1083 CrossRef CAS.
- N. López-Rodríguez, A. López-Arraiza, E. Meaurio and J. R. Sarasua, Crystallization, morphology, and mechanical behavior of polylactide/poly(ε-caprolactone) blends, Polym. Eng. Sci., 2006, 46, 1299–1308 Search PubMed.
- A. J. Nijenhuis, E. Colstee, D. W. Grijpma and A. J. Pennings, High molecular weight poly(l-lactide) and poly(ethylene oxide) blends: thermal characterization and physical properties, Polymer, 1996, 37, 5849–5857 CrossRef CAS.
- J.-J. Han and H.-X. Huang, Preparation and characterization of biodegradable polylactide/thermoplastic polyurethane elastomer blends, J. Appl. Polym. Sci., 2011, 120, 3217–3223 CrossRef CAS.
- G. C. Liu, Y. S. He, J. B. Zeng, Y. Xu and Y. Z. Wang, In situ formed crosslinked polyurethane toughened polylactide, Polym. Chem., 2014, 5, 2530–2539 RSC.
- W. Zhang, L. Chen and Y. Zhang, Surprising shape-memory effect of polylactide resulted from toughening by polyamide elastomer, Polymer, 2009, 50, 1311–1315 CrossRef CAS.
- K. S. Anderson and M. A. Hillmyer, The influence of block copolymer microstructure on the toughness of compatibilized polylactide/polyethylene blends, Polymer, 2004, 45, 8809–8823 CrossRef CAS.
- V. Ojijo, S. Sinha Ray and R. Sadiku, Toughening of Biodegradable Polylactide/Poly(butylene succinate-co-adipate) Blends via in Situ Reactive Compatibilization, ACS Appl. Mater. Interfaces, 2013, 5, 4266–4276 CAS.
- M. Shibata, Y. Inoue and M. Miyoshi, Mechanical properties, morphology, and crystallization behavior of blends of poly(l-lactide) with poly(butylene succinate-co-l-lactate) and poly(butylene succinate), Polymer, 2006, 47, 3557–3564 CrossRef CAS.
- L. Jiang, M. P. Wolcott and J. Zhang, Study of Biodegradable Polylactide/Poly(butylene adipate-co-terephthalate) Blends, Biomacromolecules, 2006, 7, 199–207 CrossRef CAS PubMed.
- H. Kang, B. Qiao, R. Wang, Z. Wang, L. Zhang, J. Ma and P. Coates, Employing a novel bioelastomer to toughen polylactide, Polymer, 2013, 54, 2450–2458 CrossRef CAS.
- X. Hu, Y. Li, M. Li, H. Kang and L. Zhang, Renewable and Supertoughened Polylactide-Based Composites: Morphology, Interfacial Compatibilization, and Toughening Mechanism, Ind. Eng. Chem. Res., 2016, 55, 9195–9204 CrossRef CAS.
- N. Bitinis, R. Verdejo, P. Cassagnau and M. A. Lopez-Manchado, Structure and properties of polylactide/natural rubber blends, Mater. Chem. Phys., 2011, 129, 823–831 CrossRef CAS.
- C. Zhang, W. Wang, Y. Huang, Y. Pan, L. Jiang, Y. Dan, Y. Luo and Z. Peng, Thermal, mechanical and rheological properties of polylactide toughened by expoxidized natural rubber, Mater. Des., 2013, 45, 198–205 CrossRef CAS.
- L. V. Labrecque, R. A. Kumar, V. Davé, R. A. Gross and S. P. McCarthy, Citrate esters as plasticizers for poly(lactic acid), J. Appl. Polym. Sci., 1997, 66, 1507–1513 CrossRef CAS.
- N. Ljungberg and B. Wesslén, The effects of plasticizers on the dynamic mechanical and thermal properties of poly(lactic acid), J. Appl. Polym. Sci., 2002, 86, 1227–1234 CrossRef CAS.
- M. Murariu, A. Da Silva Ferreira, M. Alexandre and P. Dubois, Polylactide (PLA) designed with desired end-use properties: 1. PLA compositions with low molecular weight ester-like plasticizers and related performances, Polym. Adv. Technol., 2008, 19, 636–646 CrossRef CAS.
- M. Sheth, R. A. Kumar, V. Davé, R. A. Gross and S. P. McCarthy, Biodegradable polymer blends of poly(lactic acid) and poly(ethylene glycol), J. Appl. Polym. Sci., 1997, 66, 1495–1505 CrossRef CAS.
- Z. Kulinski and E. Piorkowska, Crystallization, structure and properties of plasticized poly(l-lactide), Polymer, 2005, 46, 10290–10300 CrossRef CAS.
- R. G. Sinclair, The Case for Polylactic Acid as a Commodity Packaging Plastic, J. Macromol. Sci., Part A: Pure Appl.Chem., 1996, 33, 585–597 CrossRef.
- W. M. Gramlich, M. L. Robertson and M. A. Hillmyer, Reactive Compatibilization of Poly(l-Lactide) and Conjugated Soybean Oil, Macromolecules, 2010, 43, 2313–2321 CrossRef CAS.
- M. L. Robertson, K. Chang, W. M. Gramlich and M. A. Hillmyer, Toughening of Polylactide with Polymerized Soybean Oil, Macromolecules, 2010, 43, 1807–1814 CrossRef CAS.
- M. L. Robertson, J. M. Paxton and M. A. Hillmyer, Tough Blends of Polylactide and Castor Oil, ACS Appl. Mater. Interfaces, 2011, 3, 3402–3410 CAS.
- T. H. Zhao, Y. He, Y. D. Li, M. Wang and J. B. Zeng, Dynamic vulcanization of castor oil in a polylactide matrix for toughening, RSC Adv., 2016, 6, 79542–79553 RSC.
- K. Zawada, A. Plichta, D. Jańczewski, H. Hajmowicz, Z. Florjańczyk, M. Stępień, A. Sobiecka and L. Synoradzki, Esters of Tartaric Acid, A New Class of Potential Double Green Plasticizers, ACS Sustainable Chem. Eng., 2017, 5, 5999–6007 CrossRef CAS.
- C. Voirin, S. Caillol, N. V. Sadavarte, B. V. Tawade, B. Boutevin and P. P. Wadgaonkar, Functionalization of cardanol: towards biobased polymers and additives, Polym. Chem., 2014, 5, 3142–3162 RSC.
- P. Sharma, B. Lochab, D. Kumar and P. K. Roy, Sustainable bis-benzoxazines from cardanol and PET derived terephthalamides, ACS Sustainable Chem. Eng., 2015, 4, 1085–1093 CrossRef.
- A. Greco, D. Brunetti, G. Renna, G. Mele and A. Maffezzoli, Plasticizer for poly(vinyl chloride) from cardanol as a renewable resource material, Polym. Degrad. Stab., 2010, 95, 2169–2174 CrossRef CAS.
- P. Yang, J. Yan, H. Sun, H. Fan, Y. Chen, F. Wang and B. Shi, Novel environmentally sustainable cardanol-based plasticizer covalently bound to PVC via click chemistry: synthesis and properties, RSC Adv., 2015, 5, 16980–16985 RSC.
- S. Mohapatra and G. B. Nando, Cardanol: a green substitute for aromatic oil as a plasticizer in natural rubber, RSC Adv., 2014, 4, 15406–15418 RSC.
- J. Chen, Z. Liu, J. Jiang, X. Nie, Y. Zhou and R. E. Murray, A novel biobased plasticizer of epoxidized cardanol glycidyl ether: synthesis and application in soft poly(vinyl chloride) films, RSC Adv., 2015, 5, 56171–56180 RSC.
- I. Mihai, F. Hassouna, T. Fouquet, A. Laachachi, J.-M. Raquez, H. Ibn El Ahrach and P. Dubois, Reactive plasticization of poly(lactide) with epoxy functionalized cardanol, Polym. Eng. Sci., 2017 DOI:10.1002/pen.24647.
- F. Hassouma, I. Mihai, L. Fetzer, T. Fouquet, J.-M. Raquez, A. Laachachi, H. Ibn El Ahrach and P. Dubois, Design of New Cardanol Derivative: Synthesis and Application as Potential Biobased Plasticizer for Poly(lactide), Macromol. Mater. Eng., 2016, 301, 1267–1278 CrossRef CAS.
- E. W. Fischer, H. J. Sterzel and G. Wegner, Investigation of the structure of solution grown crystals of lactide copolymers by means of chemical reactions, Colloid Polym. Sci., 1973, 251, 980–990 CAS.
- T. G. Fox, Influence of diluent and of copolymer composition on the glass temperature of a polymer system, Bull. Am. Phys. Soc., 1956, 1, 123–125 CAS.
- J. Anakabe, A. M. Zaldua Huici, A. Eceiza, A. Arbelaiz and L. Avérous, Combined effect of nucleating agent and plasticizer on the crystallization behaviour of polylactide, Polym. Bull., 2017, 74, 4857–4886 CrossRef CAS.
| This journal is © The Royal Society of Chemistry 2018 |


