 Open Access Article
Creative Commons Attribution 3.0 Unported Licence
Fatigue endurance enhancement of Sn-doped Pb(Lu1/2Nb1/2)O3–PbTiO3 ceramics
Chenxi Wangab,
Chao He*a,
Zujian Wanga,
Xiuzhi Lia,
Xiaoming Yanga,
Ying Liua and
Xifa Long*a
aKey Laboratory of Optoelectronic Materials Chemistry and Physics, Fujian Institute of Research on the Structure of Matter, Chinese Academy of Sciences, Fuzhou 350002, Fujian, China. E-mail: hechao@fjirsm.ac.cn; lxf@fjirsm.ac.cn
bUniversity of Chinese Academy of Sciences, Beijing, China
First published on 26th March 2018
Abstract
Several mechanisms and methods have been proposed to study the nature of electric fatigue in ferroelectric materials with perovskite structure, including defect agglomeration, field screening and the reorientation of defect dipoles. To ascertain the effect of defect, defect dipoles in particular on the fatigue behavior in perovskite ferroelectrics, 0.51Pb(Lu1/2Nb1/2)O3–0.49PbTi1−xSnxO3 ferroelectric ceramics were fabricated in this work. It is found that the fatigue endurance has been enhanced after Sn-doping. An abnormal strong self-rejuvenation of polarization was also detected for un-poled and un-aged samples resulting from the reorientation of defect dipoles. The defect dipoles were determined by the confirmed change of the valence of Sn ions and the appearance of oxygen vacancies. The reorientation was also confirmed by the internal bias of P–E hysteresis loops during the fatigue process. With more Sn doped into the matrix, the symmetry changed from a coexistence of rhombohedral and tetragonal phase to a rhombohedral phase. The remnant polarization decreased, while the coercive field first decreased then increased as x increased, which resulted from the composition variance and the effect of defect dipoles. It indicates that the defect dipoles play an important role in the electric fatigue behavior of Sn-doping PLN–PT ceramics.
1. Introduction
Ferroelectrics with perovskite structure have been the cornerstone of modern high-tech electrical devices such as actuators, piezoelectric transducers and acoustic transducers.1–3 Among various ferroelectrics with a complex perovskite structure, Pb(Lu1/2Nb1/2)O3–PbTiO3 (PLN–PT) solid solutions were found in which the morphotropic phase boundary (MPB) between tetragonal and rhombohedral phase is in the range of 0.49–0.51PT, exhibiting excellent electrical properties and high Curie temperature (TC),4–6 which makes the PLN–PT system a promising candidate for high-power transducer applications with a wide range of application temperature. In actual applications, devices are subjected to repetitive electric cycles. The severe degradation of reversible polarization and subsequent degradation of various electric properties will be caused by cyclic electric field, i.e. electric fatigue. Electric fatigue hinders the reliability and life length of ferroelectric devices severely.7 Hence, a good electric fatigue endurance is highly desired for ferroelectric devices.8Many researchers have studied the fatigue behavior of Pb-based ferroelectrics in recent years.9–13 Many mechanisms and methods have been proposed to study the nature of electric fatigue: defect agglomeration,14 field screening resulting from surface damage,15 local phase decomposition16 and so on. Most of these mechanisms are based on these two steps: first, cyclic electric field induces a creation of imperfections or a redistribution of intrinsic imperfections; second, the subsequent imperfections affect the reversible polarization.17 Among all of the imperfections, point defects play an essential part because they affect the electric fatigue behavior significantly.18,19 The existence of point defects in materials also affects almost every physical property of the matrix. Almost all of the unsolved problems of ferroelectrics have some relations with defects, including aging,20 imprint21,22 and the unwanted increment of leakage current.23 It's of great significance to study the effect of point defects on ferroelectric materials. The most effective way to induce point defects is doping. Two kinds of point defects would be generated through doping: cation vacancies are generated via donor doping, and oxygen vacancies are generated through acceptor doping.24 Whether cation vacancies and oxygen vacancies play positive or negative roles in the fatigue behavior of bulk ferroelectrics is still unclear. Chen et al. reported that fatigue endurance improved more for donor-doped BaTiO3 ceramics than that of acceptor-doped materials.25 However, better fatigue endurance has been reported for acceptor-doped PbZrO3 ceramics than donor-doped PbZrO3 ceramics.26 Compared with the fatigue behavior of donor-doped ferroelectrics, it's more complicated in acceptor-doped ferroelectrics due to the high mobility of oxygen vacancies27–30 and the defect dipoles formed between defect ions and oxygen vacancies.31 The domain wall pinning due to the agglomeration of oxygen vacancies during the fatigue process hampers the motion of domain walls, leading to the detriment of fatigue endurance. While the defect dipoles formed in the bulk should reorient under strong bipolar electric field during the fatigue process, which results in more complicated fatigue behavior. Apart from the enhancement of fatigue endurance of acceptor-doped ferroelectrics mentioned above, some authors have found abnormal self-rejuvenation behavior of the remnant polarization (Pr) during the fatigue process for poled and fully aged Pb-based ferroelectric ceramics under cyclic bipolar electric field due to the de-pinning or de-aging effect of oxygen vacancies.32,33 To our knowledge, this abnormal self-rejuvenation has not been found in un-poled and un-aged Pb-based ferroelectrics with perovskite structure, which has actually been found in this work. If well understood, the mechanism behind this phenomenon is bound to make great contribution to the materials science.
In this work, we focus on fatigue endurance enhancement of PLN–PT ceramics and study the effect of defect dipoles on electric fatigue behavior of acceptor-doped PLN–PT ceramics. 0.51PLN–0.49PT ceramic in the MPB region close to the rhombohedral side was chosen as the matrix in this work due to the excellent electric properties of this composition. It was found in the current work that for the composition 0.51PLN–0.49PT, the Pr decreases to half of the value measured at the beginning of the fatigue process before the number of cycles (n) increases up to 1.6 × 10⁴. This fatigue endurance is very weak compared with PMNT ceramics, the Pr of which keeps nearly stationary even up to 104 cycles.10 Hence it is very necessary to enhance the fatigue endurance of 0.51PLN–0.49PT ceramics to make them more reliable. In this work, SnO2 was chosen as the dopant to obtain acceptor-doped 0.51PLN–0.49PT ceramics because there were many good works about Sn-doping in ferroelectrics like BaTiO3,34 Pb(Ti0.65Zr0.35)O3 (ref. 35) and BaNbO3.36 Sn was found to exist in oxides as both Sn2+ and Sn4+.37–39 We substituted Sn4+ ions for B-site Ti4+ ions. The valence change of Sn4+ thus led to the formation of oxygen vacancies to balance the charge misfit. To avoid the domain wall pinning of oxygen vacancies caused by aging effect, fatigue behavior was measured right after the annealing treatment. Ferroelectric, fatigue and dielectric characteristics of the samples with different Sn doping levels were studied, together with the chemical valence state of Sn and oxygen vacancies.
2. Experimental procedure
Sn ions modified PLN–PT ceramics with the formula of 0.51Pb(Lu1/2Nb1/2)O3–0.49PbTi1−xSnxO3 (x = 0–0.2) were fabricated by the traditional solid-state reaction method using high purity (99.9%) PbO, Lu2O3, Nb2O5, TiO2, SnO2 as raw materials. Excess of 2 mol% of the total amount of PbO which was weighed according to the stoichiometry was added to compensate the evaporation of PbO during sintering. At first, all the raw materials were blended and ball-milled in ethanol with 2 mol% excess of PbO for 24 hours. Then the adequately milled powder was pressed into discs at 15 MPa and calcined at 850 °C in air for 3 hours. After calcination, the discs were remilled for 2 hours with 2 wt% polyvinyl alcohol (PVA) as a binder. Again, the powder was pressed into small pellets at 13 MPa, and the discs were heated up to 500 °C for 2 hours to eliminate PVA. At last, the discs were sintered at 930 °C to 970 °C for 3 hours in an Al2O3 crucible filled with PbZrO3 which prevents the excessive evaporation of PbO.The crystalline phase of sintered specimens was analyzed by X-ray diffractometer (XRD) (Miniflex 600, Rikagu, Japan) from 5° to 80° (2θ) with a speed of 2 deg min−1 and a step of 0.02 (2θ) at room temperature. Theoretical density of the ceramics was calculated through the XRD profile using the software Jade 6.0. The observations of the microstructure of the fractured surfaces of the specimens were carried out by a field emission scanning electron microscope (SEM, Hitachi SU-8010, Japan). The sintered disc ceramics were cut into rectangle with the area about 8 mm2 to avoid edge effects, and polished to about 300 μm in thickness with 800 grit SiC papers, and then annealed at 500 °C for 3 hours to eliminate the aging effect. Right after the annealing, the samples were pasted with silver paste and then electrical measurements were made immediately. Ferroelectric characterizations and fatigue behavior were measured by the aixACCT TF Analyzer 2000 standard ferroelectric test system. Before the fatigue treatment, the polarization–electric field (P–E) hysteresis loops were measured under an AC field of 5 Hz with the amplitude of 60 kV cm−1. It should be noted that the amplitude of the applied field was enhanced slowly in order not to break the sample. Then the samples were fatigued immediately. For fatigue behavior, the samples were subjected to a bipolar AC field with the amplitude of about 2 times of the coercive field (EC) (determined before the fatigue treatment) and frequency of 100 Hz up to 3 × 10⁶ cycles. Dielectric properties measurements were performed by Alpha-A high resolution impedance analyzer (Novocontrol GmbH). Oxygen vacancies and the oxidation states of Sn ions were investigated by X-ray photoelectron spectroscopy (XPS, ESCALAB 250Xi). The samples for XPS investigation were all polished to eliminate the influence of the surface state.
3. Results and discussion
3.1 Structure analysis
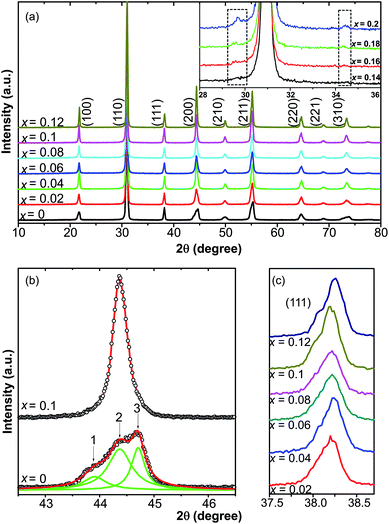
The XRD patterns of 0.51Pb(Lu1/2Nb1/2)O3–0.49PbTi1−xSnxO3 ceramics with compositions of x = 0–0.2 at room temperature are presented in Fig. 1(a), showing perovskite structures with x = 0–0.12 and small amount of secondary phase compositions with x > 0.14 (the XRD profiles of which were enclosed by two dashed squares in the inset of Fig. 1(a)), which was found to be Sn2Nb2O7 and cannot be eliminated easily by changing synthesis conditions. The pyrochlore phase was caused by the formation of Sn2+. The appearance of Sn2+ made it easy to form the Sn2Nb2O7 pyrochlore phase with Nb5+ ions. The valence state of Sn will be discussed later in the current article. In order to study the effect of Sn ions on the structure of PLN–PT ceramics, attention was paid to the XRD profiles of (200)C around 2θ = 45°. Shown in Fig. 1(b) were the profiles of (200) peaks of the composition of x = 0 and x = 0.1. For the pure PLN–PT (x = 0) ceramics, the (200) peak around 2θ = 45° showed an asymmetrical peak, composed of three peaks with Gauss distribution. The ratio of the intensities of peak 1 and peak 3 is about 1![[thin space (1/6-em)]](https://www.rsc.org/images/entities/char_2009.gif) :
:![[thin space (1/6-em)]](https://www.rsc.org/images/entities/char_2009.gif) 2. It is known that the profile of R(200) peak of rhombohedral (R) structure exhibits only a single sharp symmetrical peak because for rhombohedral phase, the relation among the lattice parameters is a = b = c, making the patterns of (200) and (002) peaks indistinguishable. While for the tetragonal (T) symmetry, the (200) peak ought to split into two peaks, corresponding to T(200)/(020) and T(002) with the ratio of the intensities of the two peaks about 2
2. It is known that the profile of R(200) peak of rhombohedral (R) structure exhibits only a single sharp symmetrical peak because for rhombohedral phase, the relation among the lattice parameters is a = b = c, making the patterns of (200) and (002) peaks indistinguishable. While for the tetragonal (T) symmetry, the (200) peak ought to split into two peaks, corresponding to T(200)/(020) and T(002) with the ratio of the intensities of the two peaks about 2![[thin space (1/6-em)]](https://www.rsc.org/images/entities/char_2009.gif) :
:![[thin space (1/6-em)]](https://www.rsc.org/images/entities/char_2009.gif) 1 because of a = b ≠ c.40,41 Obviously, peak 2 corresponds to the rhombohedral phase. Peak 1 and 3 correspond to the tetragonal phase. The (200)C (subscript C represents cubic) peak of all the doped compositions is sharper and more symmetrical than that of the virgin composition. Shown in Fig. 1(c) were the profile of (111) peak from x = 0.02 to x = 0.12. It could be seen that all the peaks showed asymmetric profile, which is a characteristic of rhombohedral structure.42 So the dopant of Sn changed the symmetry from an MPB region to a rhombohedral phase, eliminating the tetragonal phase.
1 because of a = b ≠ c.40,41 Obviously, peak 2 corresponds to the rhombohedral phase. Peak 1 and 3 correspond to the tetragonal phase. The (200)C (subscript C represents cubic) peak of all the doped compositions is sharper and more symmetrical than that of the virgin composition. Shown in Fig. 1(c) were the profile of (111) peak from x = 0.02 to x = 0.12. It could be seen that all the peaks showed asymmetric profile, which is a characteristic of rhombohedral structure.42 So the dopant of Sn changed the symmetry from an MPB region to a rhombohedral phase, eliminating the tetragonal phase.
The SEM micrographs of the selected ceramics (x = 0, 0.04, 0.08) are shown in Fig. 2, showing highly dense structure with clear grain boundaries, indicating intergranular structure. Theoretical density of the refined XRD data was calculated and the relative density of each sample without secondary phase is more than 90% of the theoretical density, namely, the low level of porosity. The average size of grains for the virgin specimens is about 7–9 μm. The grains shrink slightly with the increase of x with about 4–5 μm for x = 0.08. So the substitution of Sn for Ti ions has significant influence on the morphology of PLN–PT ceramics.
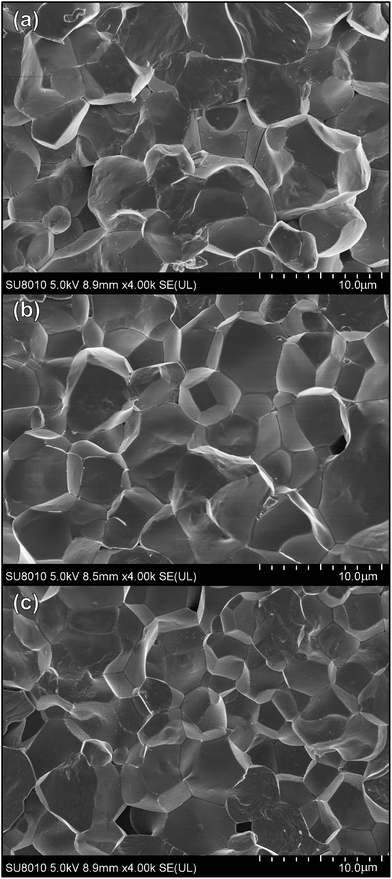 | ||
| Fig. 2 SEM micrographs of fractured surfaces of 0.51Pb(Lu1/2Nb1/2)O3–0.49PbTi1−xSnxO3 ceramics: (a) x = 0; (b) x = 0.04; (c) x = 0.08. | ||
3.2 Ferroelectric properties
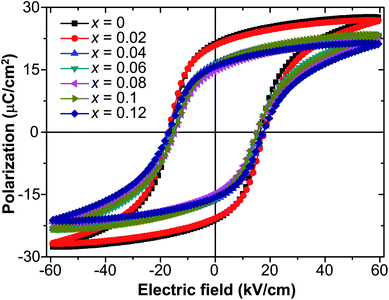
Fig. 3 presents the P–E hysteresis loops of the selected Sn-doped and un-doped PLN–PT ceramics. Well-saturated loops were found for every sample, indicating good ferroelectricity. The squareness (Rsq) of the loops quantifies the ferroelectricity from one aspect, and could be calculated via the following equation:43
 | (1) |
| x | Pr (μC cm−2) | Psat (μC cm−2) | P1.1EC (μC cm−2) | EC (kV cm−1) | Rsq |
|---|---|---|---|---|---|
| 0 | 21.2 | 27.6 | 25.0 | 16.2 | 1.95 |
| 0.02 | 20.7 | 26.8 | 24.6 | 17.5 | 1.96 |
| 0.04 | 16.3 | 23.2 | 20.4 | 17.3 | 1.95 |
| 0.06 | 16.1 | 24.0 | 20.1 | 15.4 | 1.92 |
| 0.08 | 14.6 | 22.8 | 18.6 | 14.9 | 1.91 |
| 0.1 | 15.9 | 23.8 | 20.2 | 15.0 | 1.94 |
| 0.12 | 15.7 | 21.7 | 19.1 | 17.3 | 1.94 |
To investigate the relation between the content of Sn and ferroelectric properties, the variation of Pr and coercive field EC in terms of the content of Sn is depicted in Fig. 4. Pr drops from x = 0 to x = 0.04, then changes little with x increasing. EC drops to the minimum at x = 0.08, then magnifies with more the content of Sn. The decrement of Pr and EC at low-Sn-ion region is attributed to the decrease of the content of PbTiO3 (PT). The magnifying of EC at x > 0.08 mainly results from the effect of defect dipoles formed as  It is found that when calcined at high temperature, the Sn4+ of SnO2 partly reduces to Sn2+ to form a mix state of the valence of +4 and +2.39 The multivalent behavior of Sn has already been investigated previously.44,45 The evidence of the change of valence state of Sn ions in this work will be presented below. The change of valence state from +4 to +2 thus leads to the formation of oxygen vacancies to balance the charge misfit. As a result, defect dipoles
  were formed. At x < 0.1, oxygen vacancies were not dense enough to have conspicuous effect on the materials, on which the decrease of the content of PT have more pronounced influence. At x > 0.08, enough oxygen vacancies were generated to form defect dipoles, leading the domain stability to be strengthened by the effect of defect dipoles. This effect stemmed from a symmetry-conforming property of point defects.31 The irreversible defect dipoles make the switching of spontaneous polarization much harder, resulting in an increment of EC at x > 0.08.
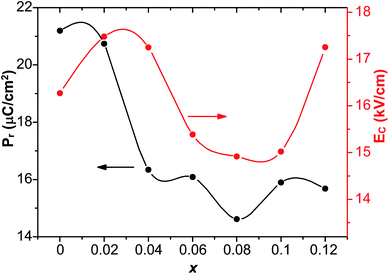 | ||
| Fig. 4 The values of Pr and EC of 0.51Pb(Lu1/2Nb1/2)O3–0.49PbTi1−xSnxO3 ceramics with respect to the content of Sn. | ||
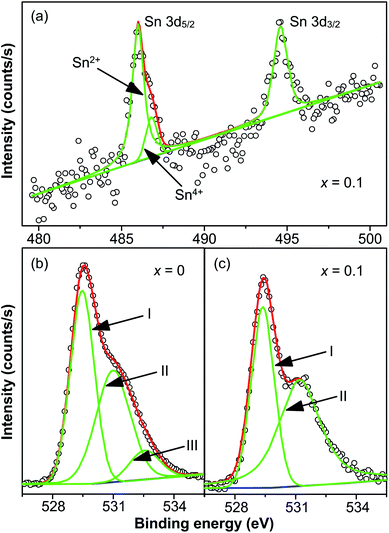
The chemical valence state of Sn and oxygen vacancies was examined X-ray photoelectron spectroscopy. Fig. 5(a) shows the XPS spectrum of Sn 3d core level of x = 0.1 at room temperature, showing two peaks in the binding energy range between 480 and 500 eV. The two peaks centered at 486.02 and 494.6 eV are for Sn 3d5/2 and Sn 3d3/2 respectively. Interestingly, two peaks centered at 486.02 and 486.84 eV are displayed after the fitting of the Sn 3d5/2 peak. It is reported that the two peaks of Sn 3d5/2 peak correspond to two valence states: Sn2+ (486.2 eV) and Sn4+ (487.1 eV).39 Hence it is believed that both Sn2+ (486.02 eV) and Sn4+ (487.1 eV) exist in doped samples. The intensity of Sn2+ peak was much larger than the peak of Sn4+, indicating that most Sn4+ ions were reduced to Sn2+ during the high-temperature calcination. This also supports the result discussed above that a pyrochlore phase with Sn2Nb2O7, in which the valence of Sn ions is +2, is formed as a secondary phase at high-level dopant.
The reduction of the valence state of Sn ions leads to the formation of oxygen vacancies to compensate the misfit of charge, which is demonstrated by the XPS of O 1s core level of x = 0 and x = 0.1 shown in Fig. 5(b) and (c). It should be noted that in Fig. 5, circles are the measured spectra, red curves are the fitted curves, green curves are the fitted Gaussian peaks and blue lines are the Tougaard-type background. The spectrum of x = 0 is well fitted with three Gaussian peaks with a Tougaard-type background, plotted as blue curves in the figures. The peaks are located at 529.46 eV (OI), 531 eV (OII) and 532.54 eV (OIII). The spectrum of x = 0.1 is well fitted with two Gaussian peaks with a Tougaard-type background. The centers of the peaks are centered at 529.38 eV (OI) and 531.24 eV (OII). Peak OI is associated with oxygen ions incorporated in the lattice sites in materials with perovskite structure. Peak OII is attributed to the formation of oxygen vacancies. Peak OIII, which was not found in the spectrum of x = 0.1, resulted from the chemisorbed oxygen or dissociated oxygen.46 Similar cases were also reported in several works.28,47–49 The ratio of the area of OII and OI (denoted as Ra) was also calculated to determine the density of oxygen vacancies. For x = 0, Ra = 0.85, while for x = 0.1, Ra = 1.28, suggesting that oxygen vacancies of x = 0.1 are denser than that of x = 0. Hence the reduction of valence state of Sn4+ ions leads to the formation of oxygen vacancies, and defect dipoles are formed.
3.3 Fatigue behavior
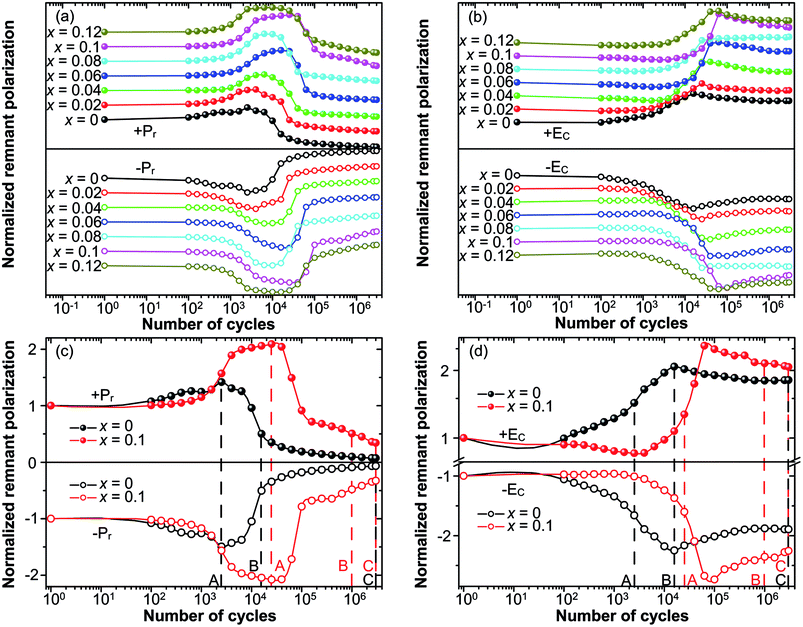
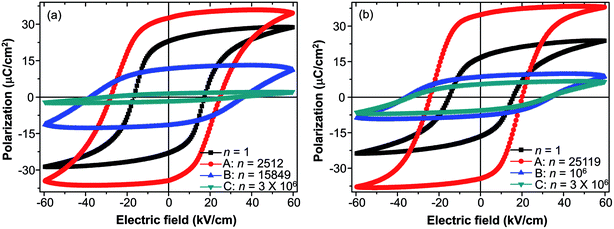
The fatigue behavior was studied as shown in Fig. 6. Fig. 6(a and b) show the variation of Pr and EC of all of the compositions measured at different n. For comparison, Pr and EC were normalized to the corresponding values measured at the first circle. It can be easily seen that the curves of Pr and EC of the studied samples show the similar trends. For precise study, the extracted curves of x = 0 and x = 0.1 compositions are shown in Fig. 6(c and d). Pr of both x = 0 and x = 0.1 shows an abnormal self-rejuvenation in the middle of the fatigue process, different from normal electric fatigue behavior of ferroelectrics, which doesn't show increment before decrement.12,50–53 EC of x = 0 first increased then decreased, with peak value located near point A. For x = 0.1, EC experienced a decrement before increasing to the peak value, after which decreased. Generally, an increase of EC was observed after the fatigue treatment for bulk ferroelectrics.54 The abnormal behavior of EC for x = 0.1 and Pr shall be discussed later.The study of fatigue behavior of Sn-doped PLN–PT ceramics indicate that the fatigue endurance is enhanced greatly with Sn doped. In the following, we give some elucidation. Special attention was focused on: point A, at which Pr reaches maximum; point B, at which Pr decreases to half of the value of the first circle; and point C, at the end of the fatigue process, 3 × 10⁶ cycles in the current work. To evaluate the fatigue endurance, the variation of the values of Pr and EC at point B is listed in Table 2, indicating enhanced fatigue endurance of doped samples, because the value of Pr of all of the doped samples drops to half at more cycles than that of undoped samples. Compared with x = 0 (n = 15![[thin space (1/6-em)]](https://www.rsc.org/images/entities/char_2009.gif) 849), the cycles are n = 106 for x = 0.1, which is elevated by two orders of magnitude. The variation of the value of Pr and EC of x = 0 and x = 0.1 compositions at point A, B, C are listed in Table 3. At point A, the value of Pr increases 45.6% for x = 0, while there is a 108.38% augment of Pr for x = 0.1. To have a direct understanding, the P–E hysteresis loops of x = 0 and x = 0.1 at three points and first cycle (n = 1) are presented in Fig. 7. At n = 1 for both compositions, the loops are not pinched or displaced, characteristic of the un-poled and un-aged case. For x = 0, the squareness increases from 1.96 to 1.97 from n = 1 to n = 2512, and the squareness shows an increment from 1.95 to 1.995 from n = 1 to n = 25
849), the cycles are n = 106 for x = 0.1, which is elevated by two orders of magnitude. The variation of the value of Pr and EC of x = 0 and x = 0.1 compositions at point A, B, C are listed in Table 3. At point A, the value of Pr increases 45.6% for x = 0, while there is a 108.38% augment of Pr for x = 0.1. To have a direct understanding, the P–E hysteresis loops of x = 0 and x = 0.1 at three points and first cycle (n = 1) are presented in Fig. 7. At n = 1 for both compositions, the loops are not pinched or displaced, characteristic of the un-poled and un-aged case. For x = 0, the squareness increases from 1.96 to 1.97 from n = 1 to n = 2512, and the squareness shows an increment from 1.95 to 1.995 from n = 1 to n = 25![[thin space (1/6-em)]](https://www.rsc.org/images/entities/char_2009.gif) 119 for x = 0.1. The improvement of the squareness of x = 0.1 is greater than that of x = 0, apart from the more improvement of Pr value. It could also be seen that after 3 × 10⁶-cycle fatigue treatment, the P–E hysteresis loop of x = 0 almost withers to a straight line clinging to the x-axis, while the loops of x = 0.1 still retained a moderate shape. This also helped elucidate the enhancement of fatigue endurance of the material via Sn doping.
119 for x = 0.1. The improvement of the squareness of x = 0.1 is greater than that of x = 0, apart from the more improvement of Pr value. It could also be seen that after 3 × 10⁶-cycle fatigue treatment, the P–E hysteresis loop of x = 0 almost withers to a straight line clinging to the x-axis, while the loops of x = 0.1 still retained a moderate shape. This also helped elucidate the enhancement of fatigue endurance of the material via Sn doping.
| x | n (cycles) | % change of EC |
|---|---|---|
| 0 | 15![[thin space (1/6-em)]](https://www.rsc.org/images/entities/char_2009.gif) 849 849 |
116.2 |
| 0.02 | 24![[thin space (1/6-em)]](https://www.rsc.org/images/entities/char_2009.gif) 821 821 |
95.6 |
| 0.04 | 35![[thin space (1/6-em)]](https://www.rsc.org/images/entities/char_2009.gif) 558 558 |
127.5 |
| 0.06 | 68![[thin space (1/6-em)]](https://www.rsc.org/images/entities/char_2009.gif) 013 013 |
150.2 |
| 0.08 | 100![[thin space (1/6-em)]](https://www.rsc.org/images/entities/char_2009.gif) 096 096 |
116.8 |
| 0.1 | 106 | 125.1 |
| 0.12 | 371![[thin space (1/6-em)]](https://www.rsc.org/images/entities/char_2009.gif) 735 735 |
88.8 |
| x | n (cycles) | Pr (μC cm−2) | EC (kV cm−1) | % change of Pr | % change of EC | Note |
|---|---|---|---|---|---|---|
| a A, Pr increases to its maximum; B, Pr decreases to below 50% of the value of n = 1; C, the end of the fatigue process. | ||||||
| 0 | 2512 | 33.4 | 26.3 | 45.6 | 54.4 | A |
15![[thin space (1/6-em)]](https://www.rsc.org/images/entities/char_2009.gif) 849 849 |
11.6 | 36.8 | −49.7 | 116.2 | B | |
| 3 × 10⁶ | 1.6 | 31.6 | −93.1 | 85.2 | C | |
| 0.1 | 25![[thin space (1/6-em)]](https://www.rsc.org/images/entities/char_2009.gif) 119 119 |
34.6 | 22.2 | 108.4 | 43.5 | A |
| 106 | 8.2 | 34.8 | −50.6 | 125.1 | B | |
| 3 × 10⁶ | 5.5 | 33.4 | −66.6 | 116.2 | C | |
As above mentioned, the abnormal behavior of Pr and EC is attributed to the effect of the reorientation of defect dipoles. The abnormal increment has also been reported for acceptor doped PZT-based ceramics.32,33 But the PZT samples studied before fatigue treatment were poled and fully aged. Such abnormal behavior, to our knowledge, has not been reported for un-poled and un-aged acceptor-doped ferroelectric materials with perovskite structure. It is known that oxygen vacancies have high mobility. Under strong electric field, charged defect dipoles can migrate even at a relatively low temperature.55 Defect dipoles thus reorient and become more reversible under strong bipolar electric field. The reorientation and enhanced reversibility of defect dipoles under the bipolar field make the switching of spontaneous polarization much easier.32 The release of spontaneous polarization from defect dipoles thus leads to the increase of Pr (for both x = 0 and x = 0.1) and decrease of EC (for x = 0.1) at the first half part of the fatigue process. The fact mentioned above that Pr of x = 0.1 increases much more than that of x = 0 at point A suggests that more defect dipoles were generated and reoriented in the sample of x = 0.1, supporting the conclusion we drew above that the dopant of Sn ions leads to the formation of oxygen vacancies. The decrease of Pr and EC after point A was the result of the field-shielding effect, resulting from the formation of layers with weak ferroelectric and dielectric properties under large number of cyclic electric field. And it is clear that in the fatigue process the reorientation of defect dipoles dominated before point A and field-shielding effect dominated after point A.
It is well known that there exists a correlation between the magnitude of internal bias field and the alignment of defect dipoles.56 To further manifest the reorientation of defect dipoles, the internal bias with respect to n during the fatigue process is plotted in Fig. 8. The internal bias field in the current work is defined as Ei = (E− − E+)/2, where E+ and E− are the magnitude of the intersections of the P–E hysteresis loops and the electric field axis. Ei of both x = 0 and x = 0.1 increased to maximum near point A. The maximum of Ei for x = 0.1 appear at more cycles than that of x = 0, and the peak value of Ei of x = 0.1 is also larger than that of x = 0. It suggests that much more defect dipoles are formed and reorient in the sample of x = 0.1. In addition, a rather drastic fluctuation was detected of x = 0.1 after reaching the maximum. It is due to the competition between the reorientation of defect dipoles and the field-shielding effect, and it is this competition that leads to the enhancement of fatigue endurance of fatigue endurance.
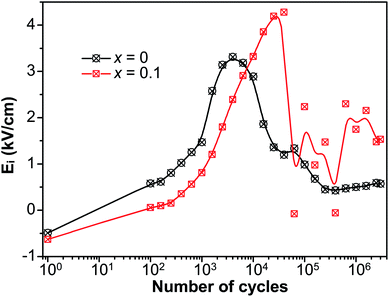 | ||
| Fig. 8 The internal bias (Ei) of P–E hysteresis loops versus the number of cycles (n) during the fatigue process. | ||
3.4 Dielectric properties
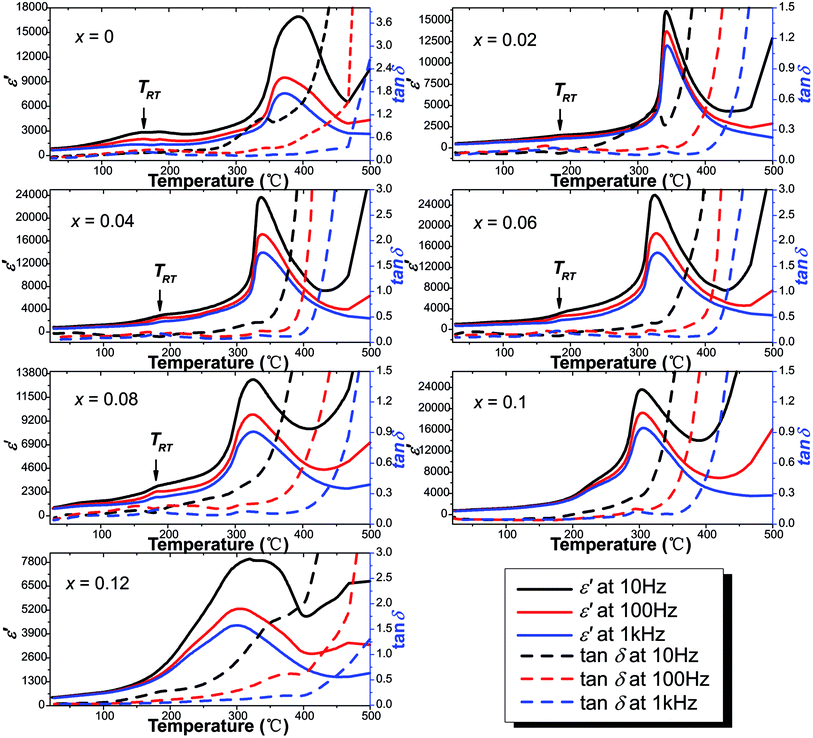
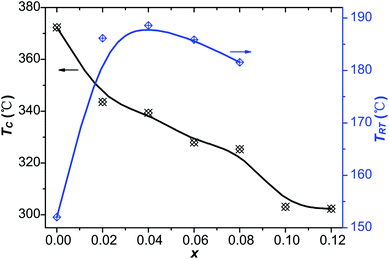
Fig. 9 shows the temperature dependence of the real part of the relative dielectric constant (ε′) and the dielectric loss (tan![[thin space (1/6-em)]](https://www.rsc.org/images/entities/char_2009.gif) δ) of the virgin and Sn-doped PLN–PT ceramics at the frequency of 10 Hz, 100 Hz and 1k Hz, respectively. Two peaks were detected in samples with x ≤ 0.08. The sharper one corresponds to Curie temperature TC, and the lesser one below TC is known as rhombohedral–tetragonal transition temperature, denoted as TRT. For samples with x ≥ 0.1, TRT disappears. The values of ε′, tan
δ) of the virgin and Sn-doped PLN–PT ceramics at the frequency of 10 Hz, 100 Hz and 1k Hz, respectively. Two peaks were detected in samples with x ≤ 0.08. The sharper one corresponds to Curie temperature TC, and the lesser one below TC is known as rhombohedral–tetragonal transition temperature, denoted as TRT. For samples with x ≥ 0.1, TRT disappears. The values of ε′, tan![[thin space (1/6-em)]](https://www.rsc.org/images/entities/char_2009.gif) δ, TRT and TC of the studied compositions were listed in Table 4. The variation of TRT and TC with respect to the content of Sn is shown in Fig. 10. It can be seen that TC decreases from 372 °C to 302 °C as x increases. TRT first increases, reaching maximum at x = 0.04, then decreases as x increases to 0.08, after which TRT disappears. It is found that the trend of TC and TRT of this work fits well to that of PLN–PT crystals that Liu et al. reported,4 in which TC of PLN–PT also decrease as the content of PT decreases, and the TRT also shows a small peak around the composition 0.55PLN–0.45PT.
δ, TRT and TC of the studied compositions were listed in Table 4. The variation of TRT and TC with respect to the content of Sn is shown in Fig. 10. It can be seen that TC decreases from 372 °C to 302 °C as x increases. TRT first increases, reaching maximum at x = 0.04, then decreases as x increases to 0.08, after which TRT disappears. It is found that the trend of TC and TRT of this work fits well to that of PLN–PT crystals that Liu et al. reported,4 in which TC of PLN–PT also decrease as the content of PT decreases, and the TRT also shows a small peak around the composition 0.55PLN–0.45PT.
| x | ε′ at RT | tan![[thin space (1/6-em)]](https://www.rsc.org/images/entities/char_2009.gif) δ at RT δ at RT |
TRT (°C) | TC (°C) |
|---|---|---|---|---|
| 0 | 869.2 | 0.09 | 152.0 | 372.3 |
| 0.02 | 524.4 | 0.07 | 186.2 | 343.5 |
| 0.04 | 844.8 | 0.17 | 188.6 | 339.4 |
| 0.06 | 1060 | 0.16 | 186.0 | 327.9 |
| 0.08 | 795.4 | 0.06 | 181.6 | 325.3 |
| 0.1 | 759.3 | 0.07 | — | 303.1 |
| 0.12 | 450.1 | 0.03 | — | 302.4 |
4. Conclusions
In summary, the structure, electric fatigue behavior and related electric properties of 0.51Pb(Lu1/2Nb1/2)O3–0.49PbTi1−xSnxO3 ceramics were studied. The valence state of Sn was examined by XPS to change from +4 to +2 during high-temperature calcination so that the oxygen vacancies were created to balance the charge misfit. At high level of Sn content, defect dipoles caused by Sn ions and oxygen vacancies induce an increment of EC. The electric fatigue endurance is enhanced after the doping of Sn. The best fatigue endurance is achieved at composition x = 0.1, n of which was elevated by two orders of magnitude. An abnormal strong self-rejuvenation of the Pr was also detected for un-poled and un-aged samples. The enhancement of fatigue endurance and abnormal self-rejuvenation result from the reorientation of defect dipoles The temperature dependence of the relative dielectric constant of different compositions shows that the TC decreased as the content of Sn increased and the TRT decreased after an increment at x < 0.04. In this work, we gave evidence that defect dipoles not only play a positive role in the electric fatigue behavior of un-poled and un-aged acceptor-doped ferroelectric materials with perovskite structure, but also induce an abnormal self-rejuvenation behavior during the fatigue process.
Conflicts of interest
There are no conflicts to declare.Acknowledgements
This work was supported by National Natural Science Foundation of China (grant no. 11404331, 91422303, 11504373, 51602308), Youth Innovation Promotion Association CAS and “Chunmiao” Talents Program for Young Scientists of Haixi Institute, CAS (CMZX-2016-006).References
- S. Zhang and F. Li, J. Appl. Phys., 2012, 111, 031301 CrossRef.
- X. F. Long, J. B. Lin, X. Z. Li, Z. J. Wang and Z.-G. Ye, Cryst. Growth Des., 2009, 9, 657–659 CAS.
- A. A. Bokov and Z.-G. Ye, J. Mater. Sci., 2006, 41, 31–52 CrossRef CAS.
- Y. Liu, X. Z. Li, Z. J. Wang, C. He, T. Li, L. D. Ai, T. Chu, D. F. Pang and X. F. Long, CrystEngComm, 2013, 15, 1643–1650 RSC.
- D. Q. Shen, X. Z. Li, Z. J. Wang, Y. Liu, C. He, T. Li, H. Tailor and X. F. Long, Mater. Lett., 2012, 84, 1–4 CrossRef CAS.
- M. Antonova, L. Shebanovs, M. Livinsh, J. Y. Yamashita, A. Sternberg, I. Shorubalko and A. Spule, J. Electroceram., 2000, 4, 179–187 CrossRef CAS.
- V. V. Shvartsman, A. L. Kholkin, C. Verdier, Z. Yong and D. C. Lupascu, J. Eur. Ceram. Soc., 2005, 25, 2559–2561 CrossRef CAS.
- B. Rawal, N. N. Wathore, B. Praveenkumar and H. S. Panda, J. Mater. Sci.: Mater. Electron., 2017, 28, 16426–16432 CrossRef CAS.
- N. Balke, D. C. Lupascu, T. Granzow and J. Roedel, J. Am. Ceram. Soc., 2007, 90, 1081–1087 CrossRef CAS.
- M. Promsawat, N. Promsawat, S. Jiansirisomboon, O. Namsar, F. Marlton, J. Daniels and S. Pojprapai, J. Eur. Ceram. Soc., 2017, 37, 4609–4616 CrossRef CAS.
- A. A. Jeyaseelan, D. Rangappa and S. Dutta, Thin Solid Films, 2017, 642, 136–141 CrossRef.
- F.-J. Yang, X. Cheng and Y. Zhang, Ceram. Int., 2016, 42, 2324–2329 CrossRef CAS.
- N. M. Murari, S. Hong, H. N. Lee and R. S. Katiyar, Appl. Phys. Lett., 2011, 99, 052904 CrossRef.
- J. Nuffer, D. C. Lupascu and J. Rodel, Acta Mater., 2000, 48, 3783–3794 CrossRef CAS.
- J. Glaum, T. Granzow, L. A. Schmitt, H.-J. Kleebe and J. Roedel, Acta Mater., 2011, 59, 6083–6092 CrossRef CAS.
- X. J. Lou, M. Zhang, S. A. T. Redfern and J. F. Scott, Phys. Rev. B: Condens. Matter Mater. Phys., 2007, 75, 224104 CrossRef.
- A. K. Tagantsev, I. Stolichnov, E. L. Colla and N. Setter, J. Appl. Phys., 2001, 90, 1387–1402 CrossRef CAS.
- Q. Zhang and R. W. Whatmore, Mater. Sci. Eng., B, 2004, 109, 136–140 CrossRef.
- S. J. Kang and Y. H. Joung, J. Mater. Sci., 2007, 42, 7899–7905 CrossRef CAS.
- L. X. Zhang and X. Ren, Phys. Rev. B: Condens. Matter Mater. Phys., 2005, 71, 174108 CrossRef.
- M. Dawber, K. M. Rabe and J. F. Scott, Rev. Mod. Phys., 2005, 77, 1083–1130 CrossRef CAS.
- C. A-Paz de Araujo, J. D. Cuchiaro, L. D. McMillan, M. C. Scott and J. F. Scott, Nature, 1995, 374, 627–629 CrossRef.
- D. Damjanovic, Rep. Prog. Phys., 1998, 61, 1267–1324 CrossRef CAS.
- P. Jaiban, A. Watcharapasorn, R. Yimnirun, R. Guo and A. S. Bhalla, J. Alloys Compd., 2017, 695, 1329–1335 CrossRef CAS.
- J. Chen, M. P. Harmer and D. M. Smyth, J. Appl. Phys., 1994, 76, 5394–5398 CrossRef CAS.
- S. Priya, H. W. Kim, J. Ryu and K. Uchino, Appl. Phys. Lett., 2002, 80, 1625–1627 CrossRef CAS.
- C. H. Park and D. J. Chadi, Phys. Rev. B: Condens. Matter Mater. Phys., 1998, 57, R13961–R13964 CrossRef CAS.
- R. Das, S. Sharma and K. Mandal, J. Magn. Magn. Mater., 2016, 401, 129–137 CrossRef CAS.
- D. A. Muller, N. Nakagawa, A. Ohtomo, J. L. Grazul and H. Y. Hwang, Nature, 2004, 430, 657–661 CrossRef CAS PubMed.
- M. V. Raymond and D. M. Smyth, J. Phys. Chem. Solids, 1996, 57, 1507–1511 CrossRef CAS.
- X. B. Ren, Nat. Mater., 2004, 3, 91–94 CrossRef CAS PubMed.
- C. Y. Chen, Z. Y. Zhou, R. H. Liang, X. B. Zhao, W. B. Zhang and X. L. Dong, Ceram. Int., 2017, 43, 5870–5874 CrossRef CAS.
- J. Glaum, Y. A. Genenko, H. Kungl, L. A. Schmitt and T. Granzow, J. Appl. Phys., 2012, 112, 034103 CrossRef.
- A. K. Nath and N. Medhi, Bull. Mater. Sci., 2012, 35, 847–852 CrossRef CAS.
- Z. Xing, Y. J. Feng and X. Y. Wei, J. Alloys Compd., 2015, 627, 238–243 CrossRef CAS.
- G. Chitgopikar, M. Chickpatil and R. L. Raibagkar, J. Mater. Sci.: Mater. Electron., 2006, 17, 963–970 CrossRef CAS.
- C. He, Z. J. Wang, X. Z. Li, X. M. Yang, X. F. Long and Z.-G. Ye, Acta Mater., 2017, 125, 498–505 CrossRef CAS.
- T. Yamashita and P. Hayes, Appl. Surf. Sci., 2008, 254, 2441–2449 CrossRef CAS.
- M. Yamaguchi, A. Ide-Ektessabi, H. Nomura and N. Yasui, Thin Solid Films, 2004, 447/448, 115–118 CrossRef.
- Z. G. Xia and Q. Li, Solid State Commun., 2007, 142, 323–328 CrossRef CAS.
- L. Wang, Q. Li, L. H. Xue and X. M. Liang, J. Mater. Sci., 2007, 42, 7397–7401 CrossRef CAS.
- B. Wang, X. Q. Wu, W. Ren and Z.-G. Ye, IEEE Trans. Sonics Ultrason., 2015, 62, 1016–1021 CrossRef PubMed.
- I. Coondoo, N. Panwar, H. Amorin, V. E. Ramana, M. Alguero and A. Kholkin, J. Am. Ceram. Soc., 2015, 98, 3127–3135 CrossRef CAS.
- P. Pyykko, Chem. Rev., 1988, 88, 563–594 CrossRef CAS.
- K. Biswas, S. Lany and A. Zunger, Appl. Phys. Lett., 2010, 96, 201902 CrossRef.
- J. P. B. Silva, M. Vorokhta, F. Dvorak, K. C. Sekhar, V. Matolin, J. Agostinho Moreira, M. Pereira and M. J. M. Gomes, Appl. Surf. Sci., 2017, 400, 453–460 CrossRef CAS.
- M. W. Zhu, H. L. Wang, H. Lei, Y. J. Zhang, N. Jia and Z. J. Wang, Appl. Phys. A: Mater. Sci. Process., 2016, 122, 364 CrossRef.
- A. T. Kozakov, A. G. Kochur, L. A. Reznichenko, L. A. Shikina, A. V. Pavlenko, K. A. Googlev and V. G. Smotrakov, J. Electron Spectrosc. Relat. Phenom., 2013, 186, 14–24 CrossRef CAS.
- S. K. Das and B. K. Roul, J. Magn. Magn. Mater., 2014, 363, 77–81 CrossRef CAS.
- S. T. Zhang, G. L. Yuan, J. Wang, Y. F. Chen, G. X. Cheng and Z. G. Liu, Solid State Commun., 2004, 132, 315–318 CrossRef CAS.
- A. Hussain, N. Sinha, A. J. Joseph, K. Dhankhar, S. Goel and B. Kumar, J. Mater. Sci.: Mater. Electron., 2017, 28, 14298–14307 CrossRef CAS.
- Q. Y. Jiang, E. C. Subbarao and L. E. Cross, J. Appl. Phys., 1994, 75, 7433–7443 CrossRef CAS.
- M. Promsawat, N. Promsawat, J. W. Wong, Z. H. Luo, S. Pojprapai and S. Jiansirisomboon, Ceram. Int., 2017, 43, 13475–13482 CrossRef CAS.
- X. J. Lou, J. Appl. Phys., 2009, 105, 024101 CrossRef.
- N. Kumar, T. Y. Ansell and D. P. Cann, J. Appl. Phys., 2014, 115, 154104 CrossRef.
- T. Rojac, M. Kosec, B. Budic, N. Setter and D. Damjanovic, J. Appl. Phys., 2010, 108, 074107 CrossRef.
| This journal is © The Royal Society of Chemistry 2018 |

