 Open Access Article
Creative Commons Attribution 3.0 Unported Licence
Acid–base sites synergistic catalysis over Mg–Zr–Al mixed metal oxide toward synthesis of diethyl carbonate†
Tingting Yan,
Weihan Bing,
Ming Xu,
Yinwen Li,
Yusen Yang,
Guoqing Cui,
Lan Yang * and
Min Wei
 *
*
State Key Laboratory of Chemical Resource Engineering, Beijing Advanced Innovation Center for Soft Matter Science and Engineering, Beijing University of Chemical Technology, Beijing 100029, P. R. China. E-mail: yanglan@mail.buct.edu.cn; weimin@mail.buct.edu.cn
First published on 26th January 2018
Abstract
In heterogeneous catalysis processes, development of high-performance acid–base sites synergistic catalysis has drawn increasing attention. In this work, we prepared Mg/Zr/Al mixed metal oxides (denoted as Mg2ZrxAl1−x–MMO) derived from Mg–Zr–Al layered double hydroxides (LDHs) precursors. Their catalytic performance toward the synthesis of diethyl carbonate (DEC) from urea and ethanol was studied in detail, and the highest catalytic activity was obtained over the Mg2Zr0.53Al0.47MMO catalyst (DEC yield: 37.6%). By establishing correlation between the catalytic performance and Lewis acid–base sites measured by NH3-TPD and CO2-TPD, it is found that both weak acid site and medium strength base site contribute to the overall yield of DEC, which demonstrates an acid–base synergistic catalysis in this reaction. In addition, in situ Fourier transform infrared spectroscopy (in situ FTIR) measurements reveal that the Lewis base site activates ethanol to give ethoxide species; while Lewis acid site facilitates the activated adsorption of urea and the intermediate ethyl carbamate (EC). Therefore, this work provides an effective method for the preparation of tunable acid–base catalysts based on LDHs precursor approach, which can be potentially used in cooperative acid–base catalysis reaction.
1. Introduction
Dialkyl carbonates have attracted widespread interest during the last decades due to their extensive industrial applications.1 As an important homologue of the dialkyl carbonate family, diethyl carbonate (DEC) has become increasingly important as a green solvent, a replacement of some toxic substances such as phosgene, dimethyl sulphate and alkyl halide in carbonylation and alkylation reactions, and an electrolyte in lithium ion batteries.2–4 Additionally, DEC can be used as an ideal additive for gasoline for its higher oxygen content and favorable fuel/water distribution coefficient with negligible environmental pollution.5 Up to now, DEC can be synthetized via several routes: phosgenation of ethanol,6 oxidative carbonylation of ethanol,7,8 transesterification of organic carbonates,9,10 and ethanolysis of urea,11,12 among which ethanolysis of urea is particularly promising due to cost effectiveness, mild reaction conditions and safe operations. Furthermore, this process involves an indirect utilization of CO2: the by-product ammonia can be recycled and further reacts with CO2 to produce urea, which is sustainable and friendly process. Zinc oxide (ZnO) catalyst has been commonly used in this reaction with a relatively high yield of DEC, but suffered from dissolution of solid ZnO during the reaction.13 Therefore, the exploration of highly efficient, stable catalysts is desirable. Previous studies have shown that both acidity and basicity are crucial to determine the catalytic performance in ethanolysis of urea;14,15 however, the cooperation of acid–base sites as well as their respective contribution to catalytic performance are unclear. Thus, how to tune the acid–base properties of catalysts so as to achieve a synergistic catalysis with a high stability and efficiency remains a challenge.Layered double hydroxides (LDHs)16,17 are a class of anionic clay materials with alternating cationic brucite-type layers and charge-balancing anions located in the interlayer region, which can be represented by the formula [M1−x2+Mx3+(OH)2](An−)x/n·mH2O. In recent years, LDHs materials have attracted an intensive attention as catalysts and catalyst supports in heterogeneous catalysis, owing to their tunability in chemical composition and phase transformation from metal hydroxides to mixed metal oxides (MMOs) upon calcination treatments.18 If the chemical composition and element ratio in LDHs host matrix are modulated, the resulting MMOs would possess versatility in concentration and intensity of Lewis acid–base sites. This inspires us to explore the synthesis of LDH precursors and precise control over their structural transformation process, for the purpose of attaining acid–base sites synergistic catalysis toward synthesis of DEC.
In this work, Mg/Zr/Al mixed metal oxides (denoted as Mg2ZrxAl1−x–MMO) were prepared by a facile phase transformation process from Mg2ZrxAl1−x–LDH precursors, and their catalytic performance toward DEC synthesis from urea and ethanol was investigated. A tunable acid–base site can be obtained via changing the Zr/Al molar ratio in the LDHs precursors. The Mg2Zr0.53Al0.47MMO catalyst demonstrates the best catalytic behavior with a DEC yield of 37.6%, which is among the highest level compared with previous studies. It is found that the synergistic catalysis between weak Lewis acid and medium strength Lewis base site is responsible for the DEC production: medium strength base site facilitates the activated adsorption of ethanol while weak acid site activates urea and intermediate ethyl carbamate (EC, the intermediate production from the reaction of ethanol and urea), which is revealed by in situ FTIR measurements.
2. Experiment section
2.1 Materials
Chemical reagents, including Mg(NO3)2·6H2O, ZrO(NO3)2·xH2O, Al(NO3)3·9H2O, NaOH, Na2CO3, ethanol, urea, and cyclohexanol was purchased and used without further purification. Deionized water was used in all the experimental processes.2.2 Synthesis of MgZrAl–LDH precursors and MgZrAl–MMO catalysts
MgZrAl–LDH precursors with various compositions were synthesized by a co-precipitation method. Typically, Mg(NO3)2·6H2O, ZrO(NO3)2·xH2O and Al(NO3)3·9H2O with a Mg2+/(Zr4+ + Al3+) molar ratio of 2 were dissolved in 200 mL of deionized water to give a solution with a total cationic concentration of 0.1 M (solution A). NaOH (2 M) and Na2CO3 (0.3 M) were dissolved in water (100 mL) to obtain a base solution (solution B). Solution B was added dropwise to solution A at 45 °C with vigorous stirring until the pH value of the slurry reached to 10. The slurry was aged at 75 °C for 12 h, and the obtained precipitate was washed thoroughly and dried in an oven at 60 °C overnight. The resulting sample is labeled as Mg2ZrxAl1−x–LDH, where x is the molar ratio of Zr/(Zr + Al). Subsequently, the Mg2ZrxAl1−x–LDH precursor was calcined at 550 °C for 4 h in a N2 atmosphere at a heating rate of 5 °C min−1. The calcination process results in the phase transformation from Mg2ZrxAl1−x–LDH precursor to MgO–ZrO2–Al2O3 mixed metal oxides (denoted as Mg2ZrxAl1−x–MMO).2.3 Catalytic evaluation
The catalytic performance was conducted on a stainless steel autoclave (50 mL) equipped with a magnetic stirrer. In a typical method, the catalyst, urea, and ethanol were packed into the reaction reactor. The air in the reaction reactor was replaced by N2 three times and then sealed. The reaction was performed at 200 °C for 5 h. The product was analyzed off-line by using gas chromatograph (Shimadzu GC-2014C equipped with a flame ionization detector). The internal standard method was applied for the quantitative analysis with cyclohexanol as internal standard. For recycling tests, the used catalyst was separated from the liquid by centrifugation, washed thoroughly and dried, and then reused for the next reaction cycle.For the reaction of urea and ethanol, the yield of diethyl carbonate (DEC) or ethyl carbamate (EC) was determined by the formulas:
 | (1) |
2.4 Characterization
Transmission electron microscopy (TEM) and high-resolution TEM (HRTEM) observations were carried out on a JEOL JEM-2100 transmission electron microscope. The morphology of the samples was investigated using a Zeiss Supra 55 scanning electron microscope (SEM) with an accelerating voltage of 20 kV. Powder X-ray diffraction (XRD) patterns were obtained on a Rigaku XRD-6000 diffractometer, using Cu Kα radiation (λ = 0.15418 nm) at 40 kV, 30 mA, a scanning rate of 10° min−1, and a 2θ angle ranging from 3 to 90°. Low-temperature N2 adsorption–desorption isotherms of the samples were obtained on a Quantachrome Autosorb-1C-VP analyzer. Prior to N2 adsorption, the sample was outgassed at 200 °C overnight. The total specific surface area was evaluated from the multipoint Brunauer–Emmett–Teller (BET) method.In situ Fourier-transformed infrared absorption of pyridine (Py-IR) spectra were obtained using a Nicolet 380 instrument spectrophotometer. The sample (20 mg) was pressed into a self-supporting wafer and installed in an IR cell with CaF2 window, activated at 450 °C for 1 h in a flow of N2, and then the temperature was cooled down to 150 °C for recording the background spectrum. Subsequently, pyridine was introduced into the cell at 150 °C for 1 h. The spectra were recorded after the sample was purged with flowing N2 to remove physisorbed pyridine.
Temperature-programmed desorption (TPD) was performed by using a Micromeritics AutoChem II 2920 apparatus, equipped with a thermal conductivity detector (TCD). Prior to adsorption, the sample (100 mg) was pretreated in a helium flow (50 cm3 min−1) at 823 K for 1 h (heating rate: 10 °C min−1) and then cooled to 50 °C. The sample was exposed to CO2 or NH3 for 0.5 h, and then was maintained in a He flow for 1 h to remove physisorbed CO2 or NH3. Afterwards, the temperature was increased linearly at a rate of 10 °C min−1 to 600 °C for recording the signal of CO2 or NH3.
In situ Fourier transform infrared spectroscopy (in situ FTIR) measurements were carried out using a Nicolet 380 instrument spectrophotometer with 4 cm−1 of resolution. For the adsorption study of urea (or EC), 2 mg of urea (or EC) and 20 mg of catalyst were pressed into a self-supporting wafer, and then was packed into the IR cell. In the case of ethanol adsorption, the catalyst (20 mg) was pressed into a self-supporting wafer and installed in the IR cell, followed by the introduction of ethanol vapor. IR spectra were recorded in the temperature range 30–210 °C.
3. Results and discussion
3.1 Structural and morphological studies on catalysts
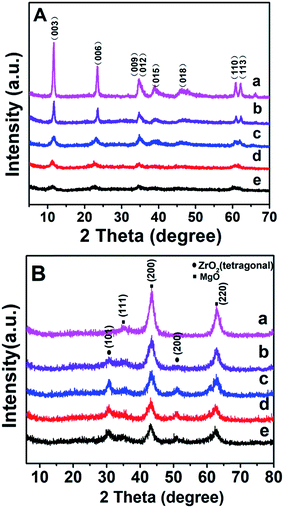
Fig. 1A shows the XRD patterns of as-synthesized Mg2ZrxAl1−x–LDH precursors with various Mg/Zr/Al molar ratios. All the samples exhibit characteristic Bragg reflections at 2θ 12° and 24°, which can be indexed to (003) and (006) of an LDH structure (JCPDS no. 35-0964), respectively. However, the crystallinity of Mg2ZrxAl1−x–LDH decreases gradually with the increase of Zr content, probably owing to the distortion in LDH layers caused by the substitution of Al3+ (ionic radius 0.053 nm) by Zr4+ (ionic radius 0.072 nm). Calcination of LDH precursors at 550 °C results in the structural transformation from LDHs to mixed metal oxides. XRD patterns of Mg2ZrxAl1−x–MMO samples (Fig. 1B) give superimposition of two kinds of oxide phases: Bragg reflections at 2θ 36°, 43° and 63° are indexed to (111), (200) and (220) of periclase MgO phase (JCPDS no. 45-0946) and those at 2θ 30° and 51° indicate the existence of tetragonal ZrO2 (t-ZrO2) phase (JCPDS no. 42-1164). Interestingly, with the increase of Zr/Mg molar ratio, the peak intensity of MgO phase decreases gradually while that of ZrO2 phase enhances progressively. Additionally, no reflection of Al2O3 is observed, indicating an amorphous phase.As a typical sample, the structural transformation from Mg2Zr0.53Al0.47–LDH precursor to Mg2Zr0.53Al0.47–MMO was studied by SEM, TEM and HRTEM measurements (Fig. 2). The Mg2Zr0.53Al0.47–LDH precursor (Fig. 2A and C) shows smooth and uniform thin platelet nanocrystal; Mg2Zr0.53Al0.47–MMO still inherits the original lamellar morphology of LDH precursor (Fig. 2B and D), but with a porous structure resulting from the calcination process. In addition, HRTEM image of Mg2Zr0.53Al0.47–MMO sample (Fig. 2E) exhibits two identified lattice fringe distances of 0.210 nm and 0.295 nm, which are indexed to the (200) plane of MgO and (101) plane of t-ZrO2 phase, respectively. This displays a homogeneous dispersion of MgO and t-ZrO2 in an amorphous Al2O3 platelet matrix, in good accordance with the XRD results.
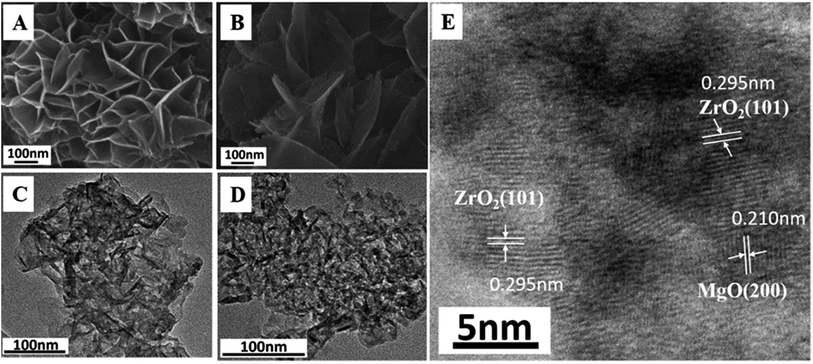 | ||
| Fig. 2 SEM images of (A) Mg2Zr0.53Al0.47–LDH, (B) Mg2Zr0.53Al0.47–MMO. TEM images of (C) Mg2Zr0.53Al0.47–LDH, (D) Mg2Zr0.53Al0.47–MMO. (E) HRTEM image of Mg2Zr0.53Al0.47–MMO. | ||
Specific surface area and pore-size distribution of all these Mg2ZrxAl1−x–MMO samples were studied by the nitrogen adsorption–desorption isotherms and porosity measurements. All the samples display IV type isotherms with H3 shaped hysteresis loops, which are typical characteristic of mesoporous materials and plate-like particles (Fig. 3). As listed in Table 1, with the increase of Zr content, the surface area shows an increase trend from 113.27 m2 g−1 to 159.45 m2 g−1 and then decreases to 143.64 m2 g−1, with an average pore diameter ranging in 8–10 nm. Noticeably, in comparison with the Mg2Al–MMO sample (111.12 m2 g−1), the Mg2ZrxAl1−x–MMO samples show higher surface area (113.27–159.45 m2 g−1), as a result of the introduction of Zr, which would be favorable in heterogeneous catalysis process.
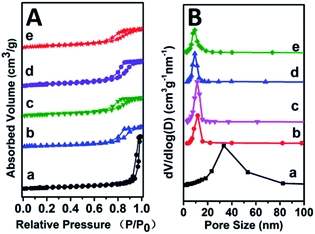 | ||
| Fig. 3 (A) N2 adsorption–desorption curves and (B) pore size distributions of: (a) Mg2Al–MMO, (b) Mg2Zr0.22Al0.78–MMO, (c) Mg2Zr0.33Al0.67–MMO, (d) Mg2Zr0.53Al0.47–MMO, (e) Mg2Zr0.67Al0.33–MMO. | ||
| Sample | SBETa/m2 g−1 | DBJHb/nm | VBJHc/cm3 g−1 |
|---|---|---|---|
| a BET surface area.b BJH desorption average pore diameter.c BJH desorption cumulative pore volume. | |||
| Mg2Al–MMO | 111.12 | 30.87 | 1.11 |
| Mg2Zr0.22Al0.78–MMO | 113.27 | 10.28 | 0.41 |
| Mg2Zr0.33Al0.67–MMO | 129.16 | 9.78 | 0.57 |
| Mg2Zr0.53Al0.47–MMO | 159.45 | 8.32 | 0.43 |
| Mg2Zr0.67Al0.33–MMO | 143.64 | 8.21 | 0.42 |
3.2 Acid–base properties of catalysts
CO2-TPD, NH3-TPD and IR spectroscopy of adsorbed pyridine (Py-IR) are powerful measurements to investigate the concentration and strength of basic and acid sites of catalyst,19 which were performed in this work (Fig. 4 and Table 2). For the CO2-TPD profiles, the samples show a broad CO2 desorption peak in the range 50–550 °C, which can be deconvoluted into three peaks with maximal temperatures (TM) in the region 120–130 °C, 170–220 °C, 300–350 °C by a Gaussian peak fitting method, corresponding to the weak, medium and strong base site, respectively. According to previous studies, the weak, medium and strong base site are derived from OH group, metal–oxygen pair and low-coordination oxygen anion, respectively.20 In the case of NH3-TPD profiles, three desorption peaks with TM at ∼130 °C, 250 °C and 350 °C are denoted as the weak, medium and strong acid site, respectively.21,22 Notably, it is observed that with the increase of Zr4+/(Zr4+ + Al3+) ratio from 0.22 to 0.53, the amount of medium basic site or weak acid site enhances significantly, and then decreases from 0.53 to 0.67. The sample of Mg2Zr0.53Al0.47–MMO gives the largest amount of both medium basic site and weak acid site, showing a Zr4+/Al3+ ratio-dependent acid–base site. The increment of medium basic site can be attributed to the enrichment of Zr4+–O2−, in light of a constant Mg content (Mg2+–O2−) in all these samples. As for the increase of weak acid site, we propose that ZrO2 phase gives predominant contribution, since Al2O3 mainly provides medium-strong acid site.23–25 It should be noted that the sample of Mg2Zr0.53Al0.47–MMO possesses the largest specific surface area (159.45 m2 g−1), which is favorable for the exposure of medium basic or weak acid site. In addition, Py-IR measurements were performed over Mg2ZrxAl1−x–MMO samples to study Lewis and Brønsted acid site.26,27 All these samples display a characteristic band of pyridine adsorption at 1444 cm−1, indicating the presence of Lewis acid site originating from ZrO2 and Al2O3. Moreover, as the Zr/Al ratio increases, the peak intensity at 1444 cm−1 strengthens gradually and reaches to maximum value over the sample of Mg2Zr0.53Al0.47–MMO, consistent with the results of NH3-TPD.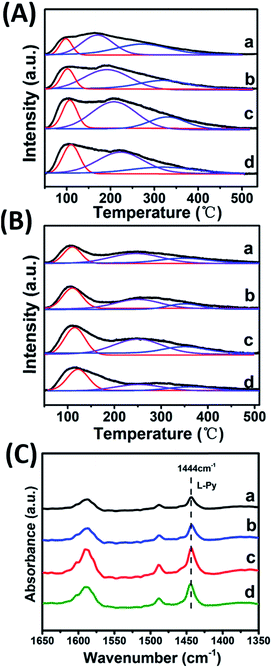 | ||
| Fig. 4 (A) CO2-TPD, (B) NH3-TPD profiles and (C) Py-IR spectra of (a) Mg2Zr0.22Al0.78–MMO, (b) Mg2Zr0.33Al0.67–MMO, (c) Mg2Zr0.53Al0.47–MMO, and (d) Mg2Zr0.67Al0.33–MMO. | ||
| Sample | Base sites (mmol g−1) | Acid sites (mmol g−1) | ||||||
|---|---|---|---|---|---|---|---|---|
| BTOTALa | BWb | BMb | BSb | ATOTALc | AWd | AMd | ASd | |
| a BTOTAL is the total concentration of base sites calculated based on CO2-TPD.b BW, BM, and BS represent the concentration of weak, medium, and strong base site, respectively, which are calculated according to CO2-TPD and the deconvoluted TPD profiles in the temperature range 50–550 °C.c ATOTAL is the total concentration of acid sites calculated based on NH3-TPD.d AW, AM, and AS denote the concentration of weak, medium, and strong acid site, respectively, which are calculated according to NH3-TPD and the deconvoluted TPD profiles in the temperature range 50–550 °C. | ||||||||
| Mg2Zr0.22Al0.78–MMO | 0.311 | 0.045 | 0.151 | 0.115 | 0.277 | 0.074 | 0.143 | 0.060 |
| Mg2Zr0.33Al0.67–MMO | 0.367 | 0.060 | 0.209 | 0.098 | 0.299 | 0.115 | 0.132 | 0.052 |
| Mg2Zr0.53Al0.47–MMO | 0.543 | 0.103 | 0.315 | 0.125 | 0.436 | 0.160 | 0.224 | 0.052 |
| Mg2Zr0.67Al0.33–MMO | 0.411 | 0.076 | 0.254 | 0.081 | 0.306 | 0.143 | 0.107 | 0.056 |
3.3 Catalytic performance of catalysts
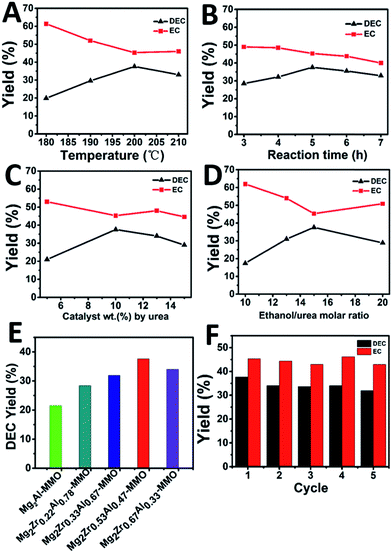
The catalytic performance of Mg2ZrxAl1−x–MMO catalysts toward the synthesis of DEC from ethanol and urea was studied. As shown in Fig. 5A, the yield of DEC shows an increase trend (from 19.9% to 37.6%) as the reaction temperature rises from 180 to 200 °C, followed by a decrease (from 37.6% to 33.0%) within 200–210 °C. In contrast, the intermediate product, ethyl carbamate (EC), shows an opposite change tendency, with the lowest yield at 200 °C. The reason is that a higher reaction temperature will lead to the reverse reaction from DEC to EC as well as the decomposition of EC to N-ethyl ethyl carbamate (side reactions).14 Thus, the reaction temperature is chosen as 200 °C. Fig. 5B displays the DEC synthesis as a function of reaction time, from which the largest yield of DEC is obtained at 5 h. Afterwards, the influence of catalyst weight on the catalytic behavior was also studied, and it was found that DEC yield reached the maximal value at 10% catalyst weight (Fig. 5C). Finally, as for the urea/ethanol molar ratio (Fig. 5D), the yield of DEC achieves the largest one with the ethanol/urea molar ratio of 15.Furthermore, the catalytic performance of various Mg2ZrxAl1−x–MMO catalysts were evaluated under the optimum catalytic reaction (Fig. 5E and Table 3). The Mg2Al–MMO catalyst shows catalytic activity toward DEC synthesis, yielding 21.5% DEC. The introduction of element Zr results in a significant enhancement: the DEC yield increases gradually from 21.5% to 37.6% with the increase of Zr content, and then decreases to 34.0%; the maximum value is present in the sample of Mg2Zr0.53Al0.47–MMO. This is, to the best of our knowledge, among the highest level compared with previous reports.6,11,12,14 In addition, the reusability of Mg2Zr0.53Al0.47–MMO catalyst was also studied (Fig. 5F). The used catalyst was separated from the liquid product by centrifugation, washed thoroughly and dried, directly reused for the next recycle evaluation. The catalytic performance toward DEC yield shows a slight decrease after five recycles but still remains at 32.0%, indicating a satisfactory reusability.
| Sample | Product yield (%) | |
|---|---|---|
| EC | DEC | |
| Mg2Al–MMO | 53.2 | 21.5 |
| Mg2Zr0.22Al0.78–MMO | 53.6 | 28.4 |
| Mg2Zr0.33Al0.67–MMO | 50.9 | 31.9 |
| Mg2Zr0.53Al0.47–MMO | 45.3 | 37.6 |
| Mg2Zr0.67Al0.33–MMO | 51.9 | 34.0 |
3.4 Studies on structure–property correlation
Previous studies have shown that both acidity and basicity are important to determine the catalytic activity in ethanolysis of urea.14 Herein, to give a deep insight into the relationship between the catalytic performance and acid–base sites of Mg2ZrxAl1−x–MMO samples, we correlate the DEC yield with surface acidity and basicity measured by NH3- and CO2-TPD. As shown in Fig. 6, it's interesting that the DEC yield increases along with the specific surface concentration of medium strength basicity or weak acidity, respectively, demonstrating a synergistic acid–base catalysis for the ethanolysis of urea reaction to synthesize DEC. To further investigate the cooperation mechanism between medium strength basicity and weak acidity and their respective contribution, in situ FTIR of reactants on the catalysts was conducted. The ethanolysis of urea includes two consecutive steps: the formation of intermediate ethyl carbamate (EC) from urea and ethanol, followed by the subsequent conversion to DEC. The second step (reaction of EC with ethanol), is regarded as the rate-limiting step for its unfavorable thermodynamics.2 Thus, we carried out the adsorption measurements of urea, EC and DEC over Mg2Zr0.53Al0.47–MMO and control sample (Mg2Al–MMO), respectively. Fig. 7A shows the urea adsorption over Mg2Zr0.53Al0.47–MMO within the temperature range 30–210 °C. At room temperature, the characteristic bands of urea are observed: bands at 3436 cm−1 and 3345 cm−1 are due to N–H stretching vibrations; bands at 3213 cm−1 is attributed to the N–H stretching vibration with intermolecular association; bands at 1681 cm−1 and 1161 cm−1 are assigned to C![[double bond, length as m-dash]](https://www.rsc.org/images/entities/char_e001.gif) O and C–N stretching vibrations. A new band at 2165 cm−1 appears at 130 °C with gradually enhanced intensity until 200 °C, accompanied with decreased bands of urea. This band is assigned to the formation of metal isocyanato group: O
O and C–N stretching vibrations. A new band at 2165 cm−1 appears at 130 °C with gradually enhanced intensity until 200 °C, accompanied with decreased bands of urea. This band is assigned to the formation of metal isocyanato group: O![[double bond, length as m-dash]](https://www.rsc.org/images/entities/char_e001.gif) C
C![[double bond, length as m-dash]](https://www.rsc.org/images/entities/char_e001.gif) N bound to the metal oxide surface (O
N bound to the metal oxide surface (O![[double bond, length as m-dash]](https://www.rsc.org/images/entities/char_e001.gif) C
C![[double bond, length as m-dash]](https://www.rsc.org/images/entities/char_e001.gif) N–M asymmetric stretching, M represent Al3+, Zr4+),15 as a result of the adsorption of urea onto Lewis acid sites (ZrO2 and Al2O3 in Mg2Zr0.53Al0.47–MMO catalyst).
N–M asymmetric stretching, M represent Al3+, Zr4+),15 as a result of the adsorption of urea onto Lewis acid sites (ZrO2 and Al2O3 in Mg2Zr0.53Al0.47–MMO catalyst).
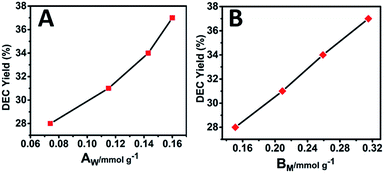 | ||
| Fig. 6 Correlations between the DEC yield and (A) the surface weak acid site (AW) or (B) surface medium strength basic site (BM) over Mg2ZrxAl1−x–MMO samples. | ||
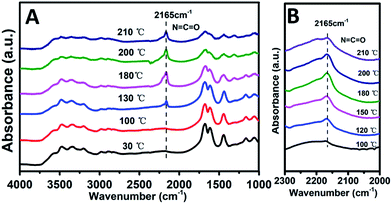 | ||
| Fig. 7 In situ FTIR spectra of (A) urea and (B) EC over Mg2Zr0.53Al0.47–MMO sample, respectively, within the temperature range 30–210 °C. | ||
Furthermore, the adsorption of EC on the catalysts was studied. As shown in Fig. 7B, a band at 2165 cm−1 corresponding to the stretching vibration of O![[double bond, length as m-dash]](https://www.rsc.org/images/entities/char_e001.gif) C
C![[double bond, length as m-dash]](https://www.rsc.org/images/entities/char_e001.gif) N bound to the metal oxide surface (O
N bound to the metal oxide surface (O![[double bond, length as m-dash]](https://www.rsc.org/images/entities/char_e001.gif) C
C![[double bond, length as m-dash]](https://www.rsc.org/images/entities/char_e001.gif) N–M asymmetric stretching, M represent Al3+, Zr4+) is observed, whose intensity increases as the temperature rises from 100 to 200 °C, indicating that EC is effectively activated. Compared with EC adsorption on Mg2Al–MMO catalyst (Fig. S4:† O
N–M asymmetric stretching, M represent Al3+, Zr4+) is observed, whose intensity increases as the temperature rises from 100 to 200 °C, indicating that EC is effectively activated. Compared with EC adsorption on Mg2Al–MMO catalyst (Fig. S4:† O![[double bond, length as m-dash]](https://www.rsc.org/images/entities/char_e001.gif) C
C![[double bond, length as m-dash]](https://www.rsc.org/images/entities/char_e001.gif) N–M stretching at 2160 cm−1, adsorption temperature at 180 °C), a higher frequency of 2165 cm−1 and a lower temperature of 100 °C are observed for Mg2Zr0.53Al0.47–MMO catalyst. This lower temperature implies the activation of EC on Mg2Zr0.53Al0.47–MMO is more favorable than that on Mg2Al–MMO catalyst. A higher frequency indicates a stronger O
N–M stretching at 2160 cm−1, adsorption temperature at 180 °C), a higher frequency of 2165 cm−1 and a lower temperature of 100 °C are observed for Mg2Zr0.53Al0.47–MMO catalyst. This lower temperature implies the activation of EC on Mg2Zr0.53Al0.47–MMO is more favorable than that on Mg2Al–MMO catalyst. A higher frequency indicates a stronger O![[double bond, length as m-dash]](https://www.rsc.org/images/entities/char_e001.gif) C
C![[double bond, length as m-dash]](https://www.rsc.org/images/entities/char_e001.gif) N bond but a weaker interaction between O and acid site in Mg2Zr0.53Al0.47–MMO.2 As discussed above, Mg2Zr0.53Al0.47–MMO catalyst possesses mainly weak acid site deprived from ZrO2 while Mg2Al–MMO offers medium–strong acid site (Fig. S2†) provided by Al2O3. In other words, weak Lewis acid site serves as main active site to activate EC over Mg2Zr0.53Al0.47–MMO while medium–strong Lewis acid site accounts for the activated adsorption of EC over Mg2Al–MMO. This is in accordance with the correlation between DEC yield and surface weak acidity measured by NH3-TPD (Fig. 4). The activation of EC by weak Lewis acid site over Mg2Zr0.53Al0.47–MMO catalyst is more efficient than by the medium–strong Lewis acid site over Mg2Al–MMO sample, which promotes the conversion of EC to DEC (the rate-limiting step) with a higher yield of DEC.
N bond but a weaker interaction between O and acid site in Mg2Zr0.53Al0.47–MMO.2 As discussed above, Mg2Zr0.53Al0.47–MMO catalyst possesses mainly weak acid site deprived from ZrO2 while Mg2Al–MMO offers medium–strong acid site (Fig. S2†) provided by Al2O3. In other words, weak Lewis acid site serves as main active site to activate EC over Mg2Zr0.53Al0.47–MMO while medium–strong Lewis acid site accounts for the activated adsorption of EC over Mg2Al–MMO. This is in accordance with the correlation between DEC yield and surface weak acidity measured by NH3-TPD (Fig. 4). The activation of EC by weak Lewis acid site over Mg2Zr0.53Al0.47–MMO catalyst is more efficient than by the medium–strong Lewis acid site over Mg2Al–MMO sample, which promotes the conversion of EC to DEC (the rate-limiting step) with a higher yield of DEC.
Finally, we investigated the adsorption behavior of ethanol over Mg2Zr0.53Al0.47–MMO at various temperatures (Fig. 8). In the CH2/CH3 stretching region, two peaks at 2962 and 2923 cm−1 are attributed to CH3 stretching and the peak at 2865 cm−1 is due to CH2 stretching in ethoxide.28 In C–C–O stretching regions, the band at 1064 cm−1 and 1118 cm−1 are assigned to adsorbed ethoxide species28 over the catalyst, which indicates that ethanol is effectively activated over Mg2Zr0.53Al0.47–MMO through the abstraction of Hδ+ by Lewis basic site. Additionally, the peaks intensity of ethoxide species increases gradually when the temperature rises from 100 °C to 200 °C, indicating an enhanced activation of ethanol over Mg2Zr0.53Al0.47–MMO at a higher temperature. In comparison, Mg2Al–MMO sample displays two peaks at 1102 cm−1 and 1165 cm−1 (Fig. S5†) in C–C–O stretching region, corresponding to the adsorbed ethoxide species.29 The large difference in band position suggests that the basic sites provided by the two catalysts are different for the activation of ethanol: Zr4+–O2− as main basic site is responsible for the activated adsorption of ethanol (ethoxide species) over Mg2Zr0.53Al0.47–MMO while Mg2+–O2− serves as predominant active center in Mg2Al–MMO sample. Previous study reported that weak basic site can not activate ethanol in this catalytic system.4 Thus, based on the combination of in situ FTIR spectra and CO2-TPD results, it is proposed that the presence of medium strength Lewis basic sites (Zr4+–O2−, Mg2+–O2−) in Mg2Zr0.53Al0.47–MMO facilitates the activated adsorption of ethanol to produce ethoxide which is involved in the following reaction.
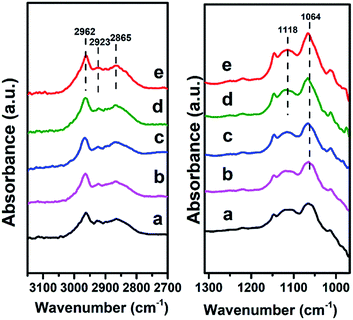 | ||
| Fig. 8 In situ FTIR spectra evolution of ethanol over Mg2Zr0.53Al0.47–MMO at: (a) 100 °C, (b) 120 °C, (c) 150 °C, (d) 180 °C, (e) 200 °C, respectively. | ||
4. Conclusions
In summary, acid–base Mg/Zr/Al mixed metal oxides (denoted as Mg2ZrxAl1−x–MMO) were successfully synthesized via the calcination transformation of Mg2ZrxAl1−x–LDH precursors. The obtained Mg2ZrxAl1−x–MMO catalysts are evaluated by the ethanolysis of urea reaction to produce DEC, and the sample of Mg2Zr0.53Al0.47–MMO demonstrates the largest DEC yield of 36.7%. Studies on structure–activity correlation reveal a cooperative catalysis between medium strength base site and weak acid site of Mg2Zr0.53Al0.47–MMO in this reaction. Moreover, CO2- and NH3-TPD study as well as the in situ FTIR measurements verify that the medium strength Lewis base sites (Zr4+–O2−, Mg2+–O2−) serve as active center to activate ethanol to produce ethoxide species; while weak Lewis acid sites (mostly ZrO2) act as active site toward EC activation to produce O![[double bond, length as m-dash]](https://www.rsc.org/images/entities/char_e001.gif) C
C![[double bond, length as m-dash]](https://www.rsc.org/images/entities/char_e001.gif) N–M. Therefore, a synergistic acid–base catalysis is demonstrated in the Mg2Zr0.53Al0.47–MMO catalyst, accounting for its higher DEC yield toward ethanolysis of urea reaction.
N–M. Therefore, a synergistic acid–base catalysis is demonstrated in the Mg2Zr0.53Al0.47–MMO catalyst, accounting for its higher DEC yield toward ethanolysis of urea reaction.
Conflicts of interest
There are no conflicts to declare.Acknowledgements
This work was supported by the National Key Research and Development Program (Grant No. 2017YFA0206804), the National Natural Science Foundation of China (NSFC) and the Fundamental Research Funds for the Central Universities (buctylkxj01).Notes and references
- S. Huang, B. Yan, S. Wang and X. Ma, Chem. Soc. Rev., 2015, 44, 3079–3116 RSC.
- F. Li, H. Li, L. Wang, P. He and Y. Cao, Catal. Sci. Technol., 2015, 5, 1021–1034 CAS.
- K. Shukla and V. C. Srivastava, RSC Adv., 2016, 6, 32624–32645 RSC.
- D. Wang, X. Zhang, C. Liu, T. Cheng, W. Wei and Y. Sun, Appl. Catal., A, 2015, 505, 478–486 CrossRef CAS.
- D. Wang, B. Yang, X. Zhai and L. Zhou, Fuel Process. Technol., 2007, 88, 807–812 CrossRef CAS.
- I. E. Muskat and F. Strain, US Pat., 2,379,250, 1941.
- I. Prymak, V. N. Kalevaru, S. Wohlrab and A. Martin, Catal. Sci. Technol., 2015, 5, 2322–2331 CAS.
- J. Wang, Z. Hao and S. Wohlrab, Green Chem., 2017, 19, 3595–3600 RSC.
- I. Zielinska-Nadolska, K. Warmuzinski and J. Richter, Catal. Today, 2006, 114, 226–230 CrossRef CAS.
- S.-J. Wang, S.-H. Cheng, P.-H. Chiu and K. Huang, Ind. Eng. Chem. Res., 2014, 53, 5982–5995 CrossRef CAS.
- W. Zhao, W. Peng, D. Wang, N. Zhao, J. Li, F. Xiao, W. Wei and Y. Sun, Catal. Commun., 2009, 10, 655–658 CrossRef CAS.
- A. Angelini, A. Dibenedetto, D. Curulla-Ferré and M. Aresta, RSC Adv., 2015, 5, 88401–88408 RSC.
- A. Dibenedetto, A. Angelini, M. Aresta, S. Fasciano, M. E. Cucciolito, F. Ruffo, B. M. Aresta, D. Curulla-Ferré and E. De Giglio, Appl. Catal., A, 2015, 493, 1–7 CrossRef CAS.
- K. Shukla and V. C. Srivastava, Fuel Process. Technol., 2017, 161, 116–124 CrossRef CAS.
- Y. Gao, W. Peng, N. Zhao, W. Wei and Y. Sun, J. Mol. Catal. A: Chem., 2011, 351, 29–40 CrossRef CAS.
- Q. Wang and D. O'Hare, Chem. Rev., 2012, 112, 4124–4155 CrossRef CAS PubMed.
- C. Li, M. Wei, D. G. Evans and X. Duan, Small, 2014, 10, 4469–4486 CrossRef CAS PubMed.
- J. Liu, W. Bing, X. Xue, F. Wang, B. Wang, S. He, Y. Zhang and M. Wei, Catal. Sci. Technol., 2016, 6, 3976–3983 CAS.
- J. Xie, W. Zhuang, W. Zhang, N. Yan, Y. Zhou and J. Wang, ChemCatChem, 2017, 9, 1076–1083 CrossRef CAS.
- P. Liu, M. Derchi and E. J. M. Hensen, Appl. Catal., A, 2013, 467, 124–131 CrossRef CAS.
- F. Jiang, L. Zeng, S. Li, G. Liu, S. Wang and J. Gong, ACS Catal., 2014, 5, 438–447 CrossRef.
- H. Chen, S. He, M. Xu, M. Wei, D. G. Evans and X. Duan, ACS Catal., 2017, 7, 2735–2743 CrossRef CAS.
- S.-K. Wu, P.-C. Lai, Y.-C. Lin, H.-P. Wan, H.-T. Lee and Y.-H. Chang, ACS Sustainable Chem. Eng., 2013, 1, 349–358 CrossRef CAS.
- W. Li, X. Nie, X. Jiang, A. Zhang, F. Ding, M. Liu, Z. Liu, X. Guo and C. Song, Appl. Catal., B, 2018, 220, 397–408 CrossRef CAS.
- J. R. Copeland, I. A. Santillan, S. M. Schimming, J. L. Ewbank and C. Sievers, J. Phys. Chem. C, 2013, 117, 21413–21425 CAS.
- G. S. Foo, D. Wei, D. S. Sholl and C. Sievers, ACS Catal., 2014, 4, 3180–3192 CrossRef CAS.
- J. Sun, K. Zhu, F. Gao, C. Wang, J. Liu, C. H. Peden and Y. Wang, J. Am. Chem. Soc., 2011, 133, 11096–11099 CrossRef CAS PubMed.
- J. J. Bravo-Suárez, B. Subramaniam and R. V. Chaudhari, Appl. Catal., A, 2013, 455, 234–246 CrossRef.
- T. W. Birky, J. T. Kozlowski and R. J. Davis, J. Catal., 2013, 298, 130–137 CrossRef CAS.
Footnote |
| † Electronic supplementary information (ESI) available. See DOI: 10.1039/c7ra13629c |
| This journal is © The Royal Society of Chemistry 2018 |

