DOI:
10.1039/C8RA00044A
(Paper)
RSC Adv., 2018,
8, 12260-12268
Bio-distribution and bio-availability of silver and gold in rat tissues with silver/gold nanorod administration†
Received
3rd January 2018
, Accepted 23rd March 2018
First published on 29th March 2018
Abstract
Along with the increasing applications of nanomaterials in medical fields, to know the systemic distribution of nanomaterials in the body through a precise method is required for the biosafety assessment of nanomaterials. In this study, we firstly have established a reliable inductively coupled plasma mass spectrometry (ICP-MS) method for concentration measurement of silver (Ag) and gold (Au) in biological tissues. Then, based on this method, the Ag or Au distribution in rat blood and almost all of the organs were analyzed after an i.v. or s.c. administration of Au@Ag NRs. Both the time-dependent contents of Ag and Au in blood and two pharmacokinetic models confirmed the rapid clearance of Ag from blood. At 24 h after i.v. injection, there was the highest level of Ag in liver, followed by portal nodes, spleen, lung, bone marrow and pancreas. In addition, we also found there were gender-related distributions of Ag and Au in some organs, especially after s.c. injection. Therefore, these more comprehensive and important results would give fundamental information for the biological risk assessment of nanomaterials.
1. Introduction
Nanomaterial plays an increasingly important role in our daily life due to its broad applications. For example, silver nanoparticles (AgNPs) have a broad spectrum of antibacterial activity and have been widely applied in various products, including textiles, personal care, cosmetics, home furnishing, appliances, biomedicine, etc.1,2 Gold nanoparticles (AuNPs) have been widely used in biomedical sciences, including drug delivery, imaging, diagnostics and therapies.3–6 For the applications of nanomaterials in our daily life, concerns and arguments on the safety of nanomaterials have been raised.7 As we know, regardless of administration ways, once nanomaterials get into the body, they could become systemically available. Owing to their extremely small sizes, ingested nanomaterials may be retained in some tissues and cause toxicity.8,9 Thereby, the biological safety of nanomaterials is closely related to their concentration to be ingested, distribution and metabolism in the body.10 A fundamental question is that, after exposed or administrated with nanomaterials, what concentration of nanoparticles or released ions in the blood is as time elapses and in which organs the nanoparticles or released ions accumulate.
Despite the enormous benefits of AgNPs due to their excellent antimicrobial ability, their health and environmental effects are under intense investigation. Many researchers endeavour to find out what and where AgNPs are in vivo. Large amounts of in vitro experimental evidence have characterized the boilogical responses to AgNPs as their increased exposure to human and environment, but there are only limited literatures in respect of the AgNPs biosafety in vivo.11,12 Thus, too many issues are still unresolved. The systemic distribution of AgNPs is found in almost all in vivo studies even though different administration ways and sizes of AgNPs may be used. However, the distribution patterns and toxicity generated in different animal models could be various. That's why different groups may obtain different results. For example, after i.v. injection of AgNPs into rats, some groups found the highest concentration of AgNPs was found in liver,13,14 while Recordati C. et al.15 reported that the highest silver concentration appeared in spleen. Additionally, the measured silver concentration in blood also varies.8,13,15 The possible reasons about these inconsistent results might be due to a lack of standard analytical methods including digesting biological samples containing nanomaterials besides differences on nanomaterial sizes, administration methods and doses etc. Inductively coupled plasma mass spectrometry (ICP-MS) can give quantitative information about nanomaterial content in various samples with excellent sensitivity and selectivity,16,17 compared to other quantitative detection methods (histotomy, autometallography (AMG) staining, UV-visible, energy dispersive X-ray fluorescence (EDXRF) spectroscopy and atomic absorption spectroscopy (AAS)).15,18–20 Therefore, ICP-MS has been widely used in geochemistry, industries, environmental and life sciences, forensic science and archaeology.21 In the analysis of biological samples with low target metal concentration, this method needs to be optimized for accurate measurement, especially for the procedures of digesting biological tissues to fully release metal ions. In addition, due to matrix effects and systemic influence, the detection range for specific elements should be considered prior to sample pretreatment and analysis.13 However, very few quantitative experiments for nanoparticle content analysis by ICP-MS have given enough consideration for the detection range and accuracy.13,22
So far, there are mainly six kinds of administration ways for the in vivo research of AgNPs. They are oral administration, inhalation exposure, intranasal administration, intravenous (i.v.) injection, subcutaneous (s.c.) injection, intraperitoneal injecttion. AgNPs administrated by the other five ways except i.v. injection finally get into blood and then transfer to other organs. Thus, the bioavailability of these administration ways is very important for the assessment of biosafety of AgNPs exposure. However, there are so few studies related to this problem. Park K et al.14 demonstrated that the bioavailability of 1 mg kg−1 AgNPs by oral administration in rats was 1.2% and in another group orally treated with 10 mg kg−1 AgNPs, the bioavailability was a little higher 4.2%. In addition, in most in vivo studies, researchers only detected Ag distribution in a few of organs including liver, spleen, kidney, lung, heart, bone marrow and brain.8,13–15 Although these organs are so important for the body, some other organs including lymph nodes can still play a key role in excellent health. If we cannot give comprehensive evaluation of systemic distribution of Ag in all tissues, the biosafety assessment may not be accurate and reliable for the application of AgNPs.
Therefore, in this study, we optimized sample digestion procedures to carefully test the detection range for silver (Ag) and gold (Au) in biological samples. In order to minimize the sediment of Ag ion caused by HCl and elevate the Ag ion recovery in organic samples, we optimized the ratio of nitrichydrochloric mixed acid to 9![[thin space (1/6-em)]](https://www.rsc.org/images/entities/char_2009.gif) :1 in the digestion process. Further, the well-established ICP-MS protocol was used to analyze biokinetics of Ag and Au in blood and their distribution in most organs of rats after a single intravenous (i.v.) or subcutaneous (s.c.) injection of Ag/Au nanorods (NRs). This nanomaterial is silver nanorods (NRs) composed of gold cores and silver shells (Au@Ag NRs).16 Gold as an internal reference due to its inert in biological environment can track the NRs in vivo so as to evaluate the dissolution of silver shells. However, the reason of choosing the intravenous route of administration is to avoid a number of potentially confounding factors by other extravascular administration.8 Moreover, since AgNPs are largely applied in wound dressing, subcutaneous administration could simulate the wound situation. In addition, in our study, the bioavailability of subcutaneous-administrated Au@Ag NRs was also evaluated by the construction of two pharmacokinetic models. Here, we have to address that nanostructures with different shapes may display some differences in pharmacokinetic profiles and tissue distribution.23,24 Although the results of Au@Ag NRs cannot be totally regarded as that of AgNPs in vivo, they have some similarities including the dissolution of Ag or the release of Ag ions. Therefore, our results would provide comprehensive and valuable information about the accumulation and metabolism of AgNPs as well as AuNPs in the biological study.
:1 in the digestion process. Further, the well-established ICP-MS protocol was used to analyze biokinetics of Ag and Au in blood and their distribution in most organs of rats after a single intravenous (i.v.) or subcutaneous (s.c.) injection of Ag/Au nanorods (NRs). This nanomaterial is silver nanorods (NRs) composed of gold cores and silver shells (Au@Ag NRs).16 Gold as an internal reference due to its inert in biological environment can track the NRs in vivo so as to evaluate the dissolution of silver shells. However, the reason of choosing the intravenous route of administration is to avoid a number of potentially confounding factors by other extravascular administration.8 Moreover, since AgNPs are largely applied in wound dressing, subcutaneous administration could simulate the wound situation. In addition, in our study, the bioavailability of subcutaneous-administrated Au@Ag NRs was also evaluated by the construction of two pharmacokinetic models. Here, we have to address that nanostructures with different shapes may display some differences in pharmacokinetic profiles and tissue distribution.23,24 Although the results of Au@Ag NRs cannot be totally regarded as that of AgNPs in vivo, they have some similarities including the dissolution of Ag or the release of Ag ions. Therefore, our results would provide comprehensive and valuable information about the accumulation and metabolism of AgNPs as well as AuNPs in the biological study.
2. Experimental
2.1 Reagents and materials
Chloroauric acid (HAuCl4·3H2O), sulphuric acid (H2SO4), sodium chloride (NaCl), and silver nitrate (AgNO3) were purchased from Beijing Chemical Reagent Company (Beijing, China). All chemicals used for digestion and ICP-MS were of metal–oxide-semiconductor (MOS) grade or of high purity. Nitric acid (HNO3) and hydrochloric acid (HCl) were purchased from Beijing Institute of Chemical Reagents (Beijing, China). The standard solution of silver (Ag) ion and gold (Au) ion as well as indium (In) ion used as the internal standard were purchased from ALADDIN (Shanghai, China), Acros Organics (Geel, Belgium) and Melone-pharma (Dalian, China), respectively. Gold nanoparticles (AuNPs, 40 nm) were purchased from BBI Solutions (Cardiff, UK). Deionized water (18 MΩ cm) was used in all the preparations.
2.2 Preparation of gold core/silver shell nanorods (Au@Ag NRs) and 40 nm AgNPs
The gold core/silver shell nanorods (Au@Ag NRs) were synthesized by a seed-mediated growth method as described in the ref. 25. Silver nanoparticles (AgNPs, 40 nm) were also synthesized by seed growth strategy. In brief, 0.25 mL of AgNO3 (0.1 M) was injected into the boiling 5 mL 0.1 M sodium citrate (SC) and 0.25 mL 0.1 M tannic acid (TA) mixture solution to prepare ∼15 nm silver seeds. Then, 900 mL deionized water was added, the reaction temperature was set to 90 °C before 5 mL of SC (0.1 M), 0.75 mL of TA (0.1 M), and 5 mL of AgNO3 (0.1 M) were sequentially injected with a time delay of ∼1 min. After growing 30 min, the injection of SC, TA and AgNO3 was repeated once and the reaction continued for another hour. The final AgNPs were purified by centrifugation twice (9500 rpm, 20 min). The precipitate was re-dispersed in 200 mL deionized water.
2.3 Determination of detection limit of ICP-MS for blood and tissue samples
The systemic interference on ICP-MS measurement was studied by the recovery calculation of Ag or Au standard ion solution containing a series of Ag or Au with the known absolute amount from 0.001 to 100 μg. For studying the matrix effects on nanoparticles recovery, we used 40 nm AgNPs or 40 nm gold nanoparticles (AuNPs) to test the detection limit of Ag or Au content in rat tissues. In details, about 0.2 g of blood or liver from blank male rats in the polyfluortetraethylene digest vessels was mixed with AgNPs or AuNPs solution containing the predetermined amount Ag or Au (0.001–100 μg). Then, all samples were prepared for ICP-MS measurement and the recovery yields of silver and gold were analyzed to determine the lower limit of detection (LOD).
2.4 Characterization of Au@Ag NRs
The morphology, sizes and energy dispersive X-ray spectroscopy (EDS) mapping of Au@Ag NRs was acquired by transmission electron microscopy (TEM, JEM-2100F, Hitachi, Tokyo, Japan) at an acceleration voltage of 200 kV. 6 μL NRs solution in Milli-Q water were dropped onto a cupper grid and dried at room temperature before observation. The UV/visible/near infrared (UV/vis/NIR) spectrophotometer (Lambda 950, Perkin Elmer Instruments Co. Ltd., USA) was used for measuring the NRs from 200 nm to 1100 nm. Au@Ag NRs zeta potential was measured by dynamic light scattering (DLS) (Zetasizer Nano ZS, Malvern, UK) in clear disposable zeta cell. The samples including 10 μg mL−1 of Ag were dispersed in deionized water at 25 °C before measurement. The results were reported as the average of 3 measurements, in which each measurement contained 12 individual runs.
2.5 Animal experiment
Sprague Dawley (SD) rats of 6–8 weeks old were maintained under specific pathogen-free conditions in the Experimental Animal Center of National Institutes for Food and Drug Control (Beijing, China), and the protocol for animal experiment was reviewed and approved by the Institutional Review Board. The rats were acclimatized to laboratory conditions for 1 week prior to the experiment, and then divided into 2 groups which were exposed to Au@Ag NRs through intravenous and subcutaneous injection, respectively. Each group included 16 rats, male and female in half. The average body weight of male and female rats at the beginning of the experiment is 143.4 ± 5.8 g and 149.4 ± 8.2 g, respectively, and no significant differences between male and female. Here, the i.v. administration was selected to avoid the absorption variability from different exposure sites and identify the potential target organs for Au@Ag NRs or released Ag ions.15 The Au@Ag NRs were centrifuged and resuspended in deionized water. The injected volume per rat was 500 μL, containing Ag of 0.6 mg and Au of 0.34 mg (1.7 × 10⁻³ nmol NRs). Before injection and at the indicated times after intravenous exposure (3 min, 10 min, 30 min, 1 h, 2 h, 4 h, 8 h, 16 h, day 1, day 2, day 4, day 7, day 14) and subcutaneous exposure (30 min, 2 h, 4 h, 8 h, 16 h, day 1, day 2, day 3, day 5, day 7, day 10, day 14), blood samples for ICP-MS analysis were collected from two different groups which were day 0–1 and day 2–14 group, respectively. In each group, there were 8 rats (4 males and 4 females). The blood was collected from the eye socket of rats and added into an Eppendorf tube containing anticoagulant, and then kept in −80 °C. Furthermore, on day 1 and day 14, 8 rats (4 males and 4 females) from each group were sacrificed from which the organs were collected and kept in −80 °C. The blank organs for the baseline detection of Ag or Au were from four non-treated female and non-treated male rats, respectively.
2.6 Sample digestion prior to ICP-MS measurement
About 0.2 g blood or tissue was weighed in each measurement and added into 10 mL of a mixture of concentrated HNO3 and HCl (9:1) in a PFA digestion vessel. All vessels were shortly shaken by hand and capped for pre-dissolution overnight. Then, all samples were digested by a microwave digestion instrument (MARS, CEM, Matthews, NC, USA). The microwave heating programs for digestion were 120 °C (2 min)-160 °C (5 min)-195 °C (50 min). When the vessels were cooled down, the digested products were heated to about 150 °C in a heating block (BHW-09C, BOTONYC, Shanghai, China) to drive off the vapor of HCl and nitrogen oxides and then diluted with 1% (v/v) HNO3 (for Ag) or 1% (v/v) HNO3 and 1% (v/v) HCl (for Au) to a final acid concentration of ∼3% before ICP-MS measurement. Each sample was prepared in triplicates.
2.7 Measurement with ICP-MS
All prepared standards and samples were measured by ICP-MS system (NexION 300X, Perkin Elmer, USA). Quantification was carried out with In element (25 ppb) internal standard correction. The main operating conditions for ICP-MS were as follows: the radio frequency (RF) power 1600 W; argon gas flow rates for the plasma, auxiliary, and nebulizer flow were 18 L min−1, 1.2 L min−1, and 0.98 L min−1, respectively.
2.8 Pharmacokinetic modeling
Non-compartmental analyses of the whole blood Ag or Au concentrations versus time results were conducted using WinNonLin, a pharmacokinetic analysis program (Pharsight®, St. Louis, MI, USA). Non-compartmental method used to calculate pharmacokinetic parameters did not assume the number of compartments. For non-compartmental analysis, area under the concentration–time curve (AUClast; h mg L−1), maximum concentration (Cmax; mg L−1), half-life (t1/2, h), and mean residence time (MRT, h) were calculated. The squared correlation of distances (Rsq) and correlation between time (X) and Ag or Au concentrations (Y) (Corr-XY) were used to measure the goodness of fit. AUClast was calculated by using the trapezoidal rule without making any assumption concerning the number of compartments. The terminal half-life t1/2 was readily estimated from the terminal slope λ as t1/2 = ln(2)/λ. Compartmental analyses of the whole blood Ag or Au concentrations versus time results were conducted using WinNonLin. Two-compartment model included a central compartment (blood and well-perfused organs) and a peripheral compartment (poorly-perfused tissues) to which the drug may distribute. The blood concentration time curve did not decline smoothly as a linear line but as two different phases (i.e. distribution and elimination). For two-compartmental analysis, area under the concentration–time curve (AUClast; h mg L−1), maximum concentration (Cmax; mg L−1), first half-life (t1/2, h), second half-life (t1/2, h), Vss (mL), and mean residence time (MRT, h) were calculated. Goodness of fit was based on visual inspection, weighted corrected sum of squares, sum of square residuals, weighted sum of square residuals, random distribution of residuals, Akaike's information criteria and Swartz criteria. The initial estimates for model parameters were calculated as below. The semi-logarithmic plots of blood concentration vs. time data showed the two-compartment kinetic model as C(t) = R1e−λ1t + R2e−λ2t. R1 and R2 represent intercepts on the concentration (Y) axis of the back-extrapolated initial and terminal phases, respectively. λ1 and λ2 were the initial and terminal slopes, respectively. The elimination half-lives (t1/2) were calculated as t1/2λ1 = ln(2)/λ1 and t1/2λ2 = ln(2)/λ2. MRT was calculated as MRT = AUMC/AUC. Vss was calculated as Vss = Dss/Cpss (Dss: the amount of drug in the body at steady state; Cpss: the blood concentration).26
2.9 Statistical analysis
All of the data are presented as mean ± standard deviation. Statistical analysis was performed using One-Way ANOVA, and p < 0.05 was considered as statistically significant different between male and female groups after s.c. injection.
3. Results and discussion
3.1 Characterization of Au@Ag NRs
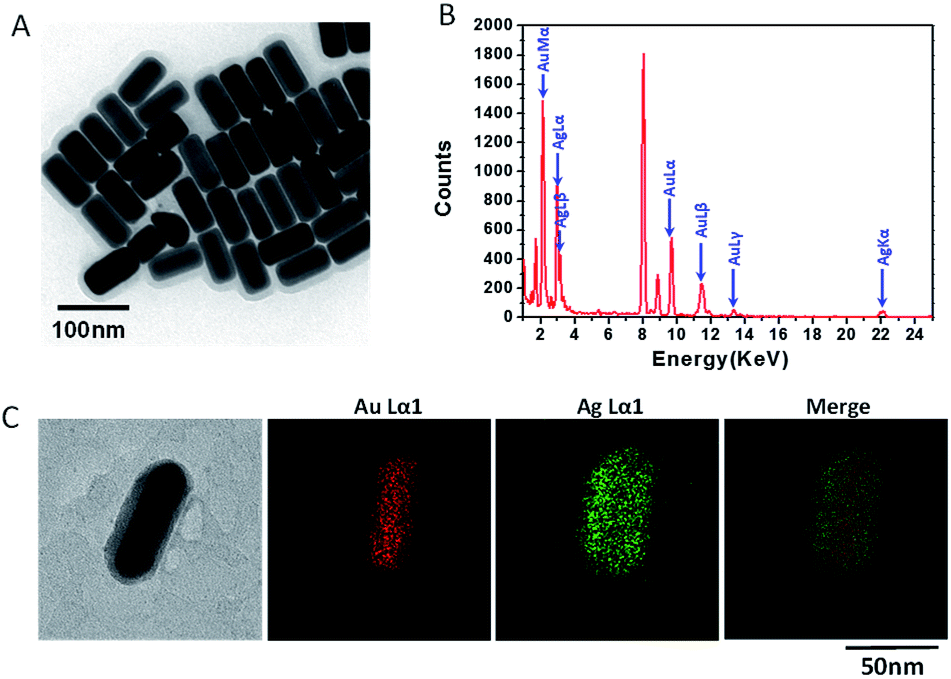
Au@Ag NRs were characterized for their physicochemical properties by TEM, UV/vis/NIR spectroscopy and DLS. TEM images showed that Au@Ag NRs were a kind of nanorods with uniform sizes (Fig. 1A). The average length and diameter of Au NRs@Ag were 73.4 ± 3.2 nm, 34.6 ± 1.9 nm (Fig. S1†). And according to TEM images, it can be found that the surface of gold nanorods (AuNRs) was homogeneously covered by a thin layer of Ag with a thickness of 7.7 ± 1.0 nm (Fig. S1†). Au@Ag NRs were further characterized with energy dispersive X-ray spectroscopy (EDS). The EDS spectrum verified that the NRs composed of element Au and Ag (Fig. 1B). Moreover, the EDS mapping results also evidenced that a layer of Ag wrapped up the AuNRs (Fig. 1C). Other physicochemical characterization was provided in ESI (Fig. S2†).
 |
| | Fig. 1 Physicochemical characterization of Au@Ag NRs used in animal experiments. (A) A representative TEM image. (B) EDS analysis. (C) EDS mapping image. | |
3.2 Limit of detection (LOD) of Ag and Au in biological samples by ICP-MS
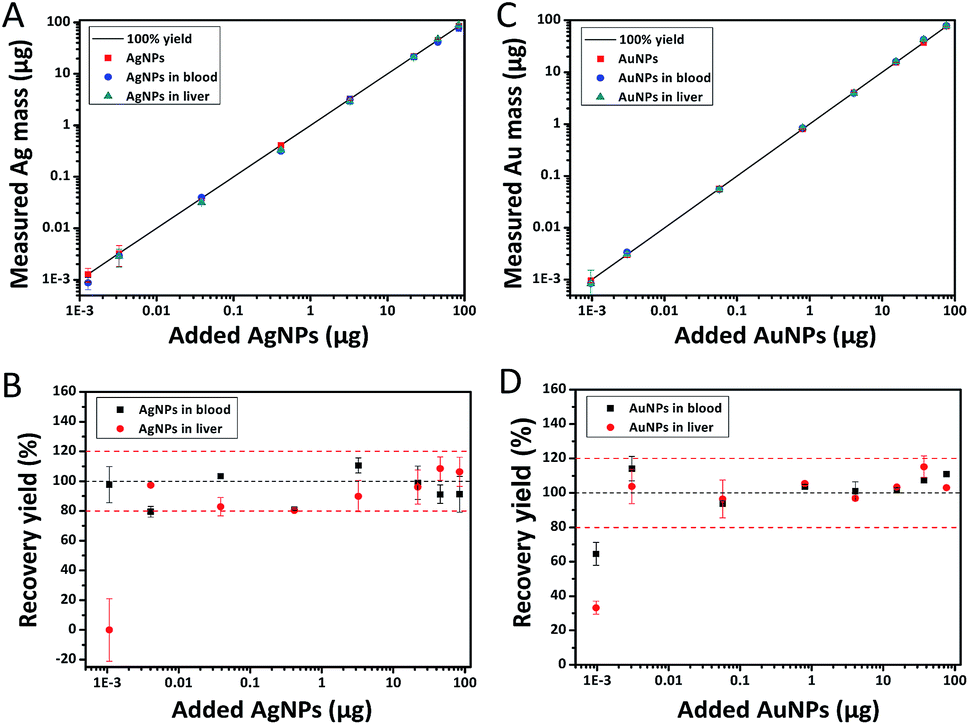
Before exploring the accurate concentration range of Ag as well as Au detected by ICP-MS, we first checked the recovery yields of Ag and Au by testing standard Ag and Au ion solution all through the process. The detection limit is determined as the lowest concentration within an absolute error within ±20%. As shown in Fig. S3,† the LOD of Ag as well as Au was 0.003 μg and 0.005 μg, respectively. Further, the biological matrix effects on the accuracy of ICP-MS measurement were investigated by measuring nanoparticle solution at known concentrations mixed with blood or liver. Fig. 2 showed the detected values of Ag or Au content for a series amount of AgNPs or AuNPs from 0.001 μg to 100 μg mixed with ∼0.2 g blood or liver matrix from blank rats. The LOD for AgNPs in liver tissue and in blood sample detected by ICP-MS was 0.020 μg g−1 and 0.005 μg g−1, respectively (Fig. 2A and B). And the LOD of AuNPs in both liver tissue and blood sample was measured to be 0.015 μg g−1 (Fig. 2C and D). The low recovery yield of Ag or Au at the lower concentration may be due to the absorption of silver ions and/or nanoparticles onto the surface of instrument or vessels.
 |
| | Fig. 2 The detection range of nanoparticles in biological tissues. 0.001–100 μg of 40 nm silver (A and B) or gold nanoparticles (C and D) were mixed with about 0.2 g liver or blood from blank rats before microwave digestion and ICP-MS measurement (n = 3 for each concentration). (A and C) Measured mass of nanoparticles with or without tissues. (B and D) The recovery yield of nanoparticles. Black line: the recovery yield of 100%. Red line: the recovery yield of 100 ± 20%. | |
3.3 Ag and Au contents in rat blood after Au@Ag NRs injection
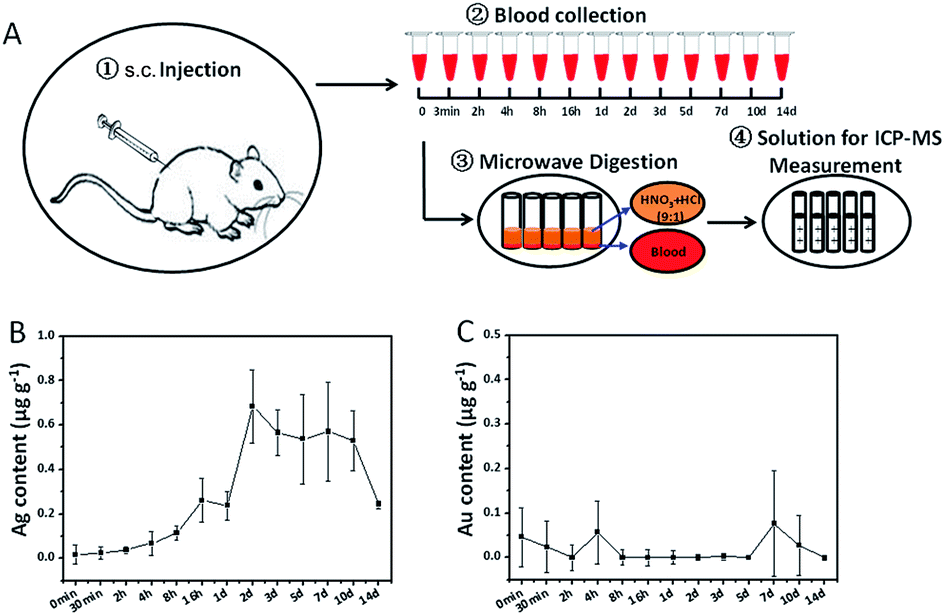
Since their efficacy largely depends on the control of their distribution within the body for the medical applications of nanomaterials, it is so important to illustrate the concentration–time profiles in blood and organs of interest. Our well-established ICP-MS method can be used to accurately measure Ag and Au concentrations in animals after nanorod injection. We carried out a single i.v. or s.c. injection of Au@Ag NRs in SD rats. Blood samples collected at predetermined time intervals after injection were prepared for ICP-MS measurement (Fig. 3A and 4A). All measured data were corrected by the blank value. For i.v. injection, the content of Ag as well as Au in blood reached its maximum value at about 3 min (15.81 ± 6.03 μg g−1, 2.96 ± 1.23 μg g−1, respectively) and then dropped dramatically, which displayed a similar trend to other reports.8,13 From 10 min to 14 d after injection, there were extremely low levels of Ag (Fig. 3B) and Au (Fig. 3C), suggesting no accumulation of Ag in blood. The concentration–time profile of Au@Ag NRs by i.v. administration showed that Au@Ag NRs could be rapidly cleared out from blood and transfer to various organs within 1 h and after that there would be an equilibrium of distribution.8 For s.c. injection, we observed a quite different scenario. The content of Ag as well as Au was far below that after i.v. injection in blood (Fig. 4B and C), suggesting that the majority of Au@Ag NRs after the s.c. administration did not go into blood circulation. The Ag content in blood increased slowly at 4 h and reached to the maximum of 0.70 ± 0.17 μg g−1 at 2 d after s.c. injection. At 14 d after injection, the level of Ag was still relatively high (0.24 ± 0.01 μg g−1). In sharp contrast, the Au content was very low from the beginning to 14 d after s.c. injection (Fig. 4C). These results show that the whole Ag@Au NRs can rarely ingested and transported into the blood but can release Ag ion (Ag+) into blood. Here, Au ion cannot be released into blood due to its high oxidation potential (1.498 V for Au3+/Au, in contrast 0.2223 V for Ag+/Ag).
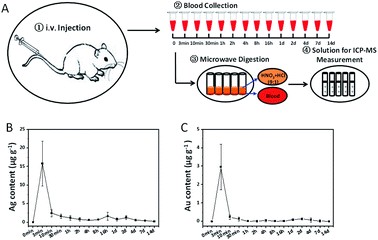 |
| | Fig. 3 Contents of Ag and Au in blood after i.v. injection. (A) The flowchart of experimental procedures. (B) Average content of Ag in blood at different time points. (C) Average content of Au in blood at different time points. (n = 8, 4 males and 4 females). All data were deducted by the background value from the blank blood. | |
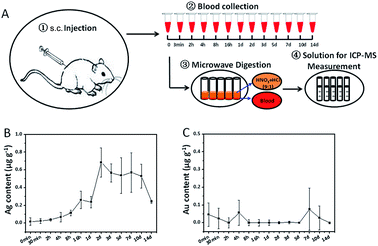 |
| | Fig. 4 Contents of Ag and Au in blood after s.c. injection. (A) A flowchart of experimental procedures. (B) Average content of Ag in blood at different time points. (C) Average content of Au in blood at different time points. (n = 8, 4 males and 4 females). All data were deducted by the background value from the blank blood. | |
3.4 Pharmacokinetic of Au@Ag NRs in rats
The measured Ag and Au concentrations in blood and organs can be quantitatively analyzed to get bioavailability of Au@Ag NRs in rats. Pharmacokinetic models were constructed using the detected Ag or Au concentrations in whole blood from each individual rat's results. Non-compartmental models showed the best fits for Ag concentrations from nanorods after i.v. injection (Rsq = 0.94; Corr XY = −0.97). Fig. S4† showed the calculated model versus the obtained Ag concentrations for the i.v. group using non-compartmental model. However, Au concentrations from the nanorods after i.v. injection and Ag concentrations from nanorods after s.c. injection were poorly fitted by non-compartmental models. Detailed results were showed in Table 1. The Cmax in the i.v. group was 19 times higher than the s.c. group. However, after 14 d (336 h), silver concentrations were also similar between the i.v. group and s.c. group. On the premise of a rapid clearance of Ag from plasma, the subcutaneous exposure of Ag in Au@Ag NRs was about 78.9% of i.v. exposure calculated by s.c. AUClast/i.v.AUClast. In general, the AUC ratio within 80–125% is considered as bioequivalence.27 Silver exposure in the s.c. group was slightly lower than its exposure in the i.v. group. The results demonstrated that the routes of administration did not influence silver exposures of nanorods. For i.v. administration, Cmax (15.85 mg L−1) of Ag was reached 0.05 h after injection. However, after 240 h of injection, Cmax of Ag was 0.84 mg L−1 for s.c administration. This result shows that silver has different kinetics between i.v. and s.c. administrations. As shown in Fig. 3, the blood concentration time curve did not decline smoothly as a linear line but as two different phases (i.e., distribution and elimination). Two compartments showed the best model fit for Ag concentrations from nanorods after i.v. injection. Fig. S5† demonstrated the calculated model versus the obtained Ag concentrations for the i.v. group using two compartment model. Other groups were poorly fitted by compartmental models. Detailed results were showed in Table 2. The results showed that after i.v. injection, Ag from nanorods was cleared very fast within 10 min after nanorods entering the body (t1/2 = 0.032 h). Then it had a slow clearance phase with a half-life 193 h.
Table 1 Pharmacokinetic parameters from the noncompartmental model
| |
Tmax (h) |
Cmax (mg L−1) |
t1/2 (h) |
Clast (mg L−1) |
AUClast (h mg L−1) |
| Ag after i.v. |
0.05 |
15.85 |
112 |
0.28 |
258.65 |
| Au after i.v. |
0.05 |
2.51 |
— |
0.32 |
92.55 |
| Ag after s.c. |
240 |
0.84 |
— |
0.40 |
203.97 |
Table 2 Pharmacokinetic parameters from the two-compartmental model
| Ag after i.v. |
Parameter units |
AUC (h mg L−1) |
First half life (h) |
Second half life (h) |
Cmax (mg L−1) |
MRT (h) |
Vss (mL) |
| Two compartments |
Estimate |
383.31 |
0.032 |
193 |
44.61 |
277 |
288.85 |
| Std. error |
210.63 |
0.005 |
115 |
7.40 |
166 |
35.13 |
In the present study, approximately 46% of Ag and 13% of Au (theoretical value: dosage × 100%/(rat's bodyweight × 7% (the proportion of blood to body weight in rats))) remained in blood at 3 min after i.v. injection, respectively. However, it decreased to 7% of Ag and 4% of Au in blood at 10 min after i.v. injection. The results demonstrated that after i.v. injection, they remained in blood with a very slow clearance till 14 d (336 h). The two-compartment model also demonstrated that the second half-life of Ag was 193 h after i.v. injection. After s.c. injection, Ag concentrations were similar to i.v. injection after 336 h. However, it did not have apparently clearance and even increased after 2 d, which demonstrated the continuous release of Ag ions to blood for the s.c. injected nanorods in rats.
3.5 Tissue distribution of Ag and Au after i.v. injection of Au@Ag NRs
Nearly 30 organs were harvested at 24 h after a single i.v. injection of Au@Ag NRs. Table 3 provided the whole data from all tested organs. There was the highest level of Ag in liver, followed by portal nodes, spleen, lung, bone marrow and pancreas. Ag was rarely distributed in other organs including kidney, heart, brain, stomach etc. On the whole, the distribution pattern of Ag was similar to other labs' studies,16–18,20 confirming that liver and spleen may be the major target organs for nanoparticle accumulation, especially after intravenous administration.28 Au was also mainly accumulated in liver, portal nodes, spleen and bone marrow, while there was extremely low level of Au in some other organs, especially in brain (Table 3). It was worth noting that Ag or Au largely accumulated in some special lymph nodes such as portal nodes, which was also confirmed by TEM images as shown in Fig. 5A. This result indicated that Au@Ag NRs can successfully enter lymphatic system, which has not been previously reported. Furthermore, EDS mapping results displayed that a few of Au nanorods were still coated by a small quantity of Ag and there were also some free Ag around Au nanorods (Fig. 5B). It indicated that a majority of Ag had been released from nanorods. In addition, although the i.v. injection way may not be a relevant route of AgNPs exposure to consumers, this administration route can provide some valuable information about Ag behaviours in vivo for traversing the primary internal barriers (e.g. skin, lung and so on) after adminstration.15 Au content in brain was too low to be detected, suggesting that Au@Ag NRs cannot cross over the blood–brain barrier (BBB) at 24 h after i.v. injection. This result is quite different from several previous studies which have claimed that AgNPs could traverse BBB as particles and accumulate in the brain.19,29,30 Possible explanation could be the different shapes and different surface groups of nanoparticle samples. Anyway, in our case, the reliable ICP-MS method gives strong confidence in the accuracy of measurement for Ag or Au content in tissues. We also noticed that the Ag/Au ratio also changes in different tissues. For instance, the Ag/Au ratios in lung, pancreas and ileum were much higher than in liver or spleen. It may indicate different release behaviours or accumulation trends of Ag+ in different tissues. In addition, these two organs (liver and spleen) are responsible for the particle removal from the blood circulation. So the accumulation of Au@Ag NRs might also explain the high levels of Au compared to the Ag levels, especially in the liver.
Table 3 The content of Ag and Au in different organs at 24 h after i.v. injection
| i.v. injection (n = 8, including 4 males and 4 females) |
| Organs |
Ag content (μg g−1) |
Au content (μg g−1) |
| Inguinal nodes |
2.31 ± 0.92 |
0.11 ± 0.05 |
| Iliac nodes |
3.58 ± 1.07 |
0.65 ± 1.72 |
| Portal nodes |
160.64 ± 27.88 |
159.18 ± 29.24 |
| Superior mesenteric nodes |
11.80 ± 9.58 |
0.81 ± 0.67 |
| Axillary nodes |
2.17 ± 1.03 |
0.32 ± 0.25 |
| Facial nodes |
3.23 ± 1.15 |
1.60 ± 0.73 |
| Parathymic nodes |
1.81 ± 1.09 |
0 |
| Testis |
0.52 ± 0.10 |
0.10 ± 0.06 |
| Uterus |
3.66 ± 0.56 |
0.16 ± 0.03 |
| Epididymis |
1.97 ± 0.53 |
0.70 ± 0.23 |
| Ovary |
2.04 ± 1.28 |
0.76 ± 0.06 |
| Kidney |
3.35 ± 1.44 |
0.58 ± 0.33 |
| Adrenal gland |
5.26 ± 1.94 |
3.36 ± 1.43 |
| Spleen |
36.64 ± 10.46 |
37.58 ± 9.64 |
| Liver |
165.44 ± 58.61 |
727.34 ± 757.46 |
| Thymus |
1.27 ± 0.19 |
0.36 ± 0.14 |
| Heart |
1.24 ± 0.30 |
0.48 ± 0.112 |
| Lung |
26.51 ± 12.43 |
9.65 ± 2.58 |
| Brain |
0.87 ± 0.83 |
0.02 ± 0.03 |
| Bladder |
5.36 ± 3.44 |
0.17 ± 0.11 |
| Stomach |
2.97 ± 1.65 |
0.08 ± 0.010 |
| Pancreas |
24.50 ± 23.06 |
0.40 ± 0.21 |
| Ileum |
16.58 ± 13.67 |
0.33 ± 0.18 |
| Colon |
2.19 ± 0.81 |
0.54 ± 0.39 |
| Skeletal muscle |
1.64 ± 0.94 |
0.19 ± 0.134 |
| Fat |
0.81 ± 0.57 |
0.34 ± 0.30 |
| Bone marrow |
24.67 ± 13.61 |
15.16 ± 4.40 |
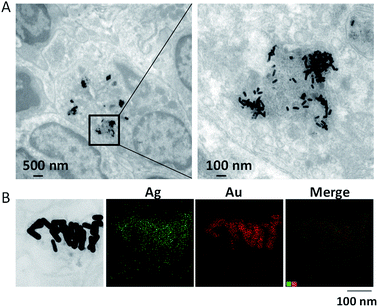 |
| | Fig. 5 The distribution of Au@Ag NRs in portal lymph nodes at 24 h after a single i.v. injection of Au@Ag NRs. (A) TEM images. (B) EDS mapping images. | |
3.6 Gender-related tissue distribution after s.c. administration of Au@Ag NRs
Furthermore, for s.c. administration, the contents of Ag and Au in all tested organs were generally lower than those after i.v. injection (Table S1†). This implies that the nanorods may not easily migrate from subcutis towards blood circulation and then distribute systemically to other tissues. However, we found the gender-related tissue distribution of Ag, especially after s.c. injection of Au@Ag NRs. As shown in Fig. 6 and Table 4, in almost all detected organs, the accumulation of Ag in female rats was more than that in male rats. In a previous report, they only found there were sex-dependent differences in kidneys after 28 day oral administration.31 However, in our case, there were many other important organs with higher accumulation of Ag in females compared with that in males, which has not been previously reported. Especially in adrenal gland and heart, Ag deposition in females were about 78-fold and 151-fold more than that in males, respectively. It is yet still unknown about the influence of AgNPs or Ag+ on the secretion of adrenaline in female animals as well as heart diseases. For i.v. administration way, only in a few of organs including superior mesenteric nodes, lung, bladder and pancreas, the Ag content in female rats was higher than that in male rats (Fig. S6 and Table S2†). But only in lungs there were significant differences between males and females. This is consistent with a previous study in which lungs were also reported with significantly higher levels of Ag in female mice compared with male ones following a 14 day i.v. injection.8 Therefore, further research concerning the specific mechanisms of sex-related different tissue distribution of AgNPs would be warranted. Additionally, to be interesting, there was more Au accumulation in male livers than that in female ones after i.v. injection (Table S2†). These results suggest that different administration ways may lead to various gender-related distributions of different nanomaterials.
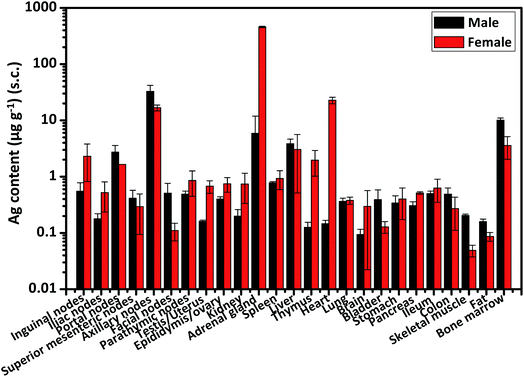 |
| | Fig. 6 The content of Ag in male and female organs at 24 h after s.c. injection. All data were deducted by the background value from blank organs. | |
Table 4 The gender-related distribution of Ag and Au in different organs at 24 h after s.c. injectiona
| s.c. injection (n = 8 including 4 males and 4 females) |
| Organs |
Ag content (μg g−1) |
Au content (μg g−1) |
| Male |
Female |
Male |
Female |
| **Significant difference by One-Way ANOVA between males and females. (**p < 0.01). |
| Inguinal nodes |
0.55 ± 0.23 |
2.31 ± 1.49 |
0 |
0 |
| Iliac nodes |
0.18 ± 0.04 |
0.52 ± 0.28 |
0 |
0 |
| Portal nodes |
2.74 ± 0.85 |
1.65 |
0 |
0 |
| Superior mesenteric nodes |
0.41 ± 0.16 |
0.29 ± 0.20 |
0 |
0 |
| Axillary nodes |
32.68 ± 9.41 |
16.77 ± 1.97 |
2.30 ± 1.88 |
0 |
| Facial nodes |
0.51 ± 0.25 |
0.11 ± 0.04 |
0 |
0 |
| Parathymic nodes |
0.49 ± 0.06 |
0.86 ± 0.41 |
0 |
0 |
| Testis/uterus |
0.16 ± 0.01 |
0.68 ± 0.17 |
0.06 |
0.05 ± 0.04 |
| Epididymis/ovary |
0.40 ± 0.04 |
0.74 ± 0.21 |
0.14 ± 0.07 |
0.03 ± 0.02 |
| Kidney |
0.20 ± 0.06 |
0.74 ± 0.41 |
0.26 ± 0.22 |
0.05 |
| Adrenal gland |
5.92 ± 6.06 |
459.73 ± 12.66** |
0 |
0 |
| Spleen |
0.78 ± 0.04 |
0.93 ± 0.34 |
0.44 ± 0.34 |
0.01 ± 0.01 |
| Liver |
3.85 ± 0.80 |
3.06 ± 2.55 |
2.14 ± 1.82 |
0.02 ± 0.02 |
| Thymus |
0.13 ± 0.03 |
1.97 ± 0.95 |
0.03 ± 0.03 |
0.12 ± 0.06 |
| Heart |
0.15 ± 0.02 |
22.76 ± 2.99** |
0.02 ± 0.02 |
0.03 ± 0.03 |
| Lung |
0.36 ± 0.05 |
0.38 ± 0.06 |
0.05 ± 0.02 |
0.07 ± 0.06 |
| Brain |
0.09 ± 0.02 |
0.30 ± 0.27 |
0 |
0 |
| Bladder |
0.39 ± 0.19 |
0.13 ± 0.03 |
0.05 ± 0.04 |
0 |
| Stomach |
0.34 ± 0.12 |
0.40 ± 0.23 |
0.22 ± 0.18 |
0 |
| Pancreas |
0.31 ± 0.05 |
0.51 ± 0.03 |
0.11 ± 0.04 |
0 |
| Ileum |
0.50 ± 0.06 |
0.63 ± 0.28 |
0.01 |
0 |
| Colon |
0.49 ± 0.14 |
0.27 ± 0.16 |
0.10 ± 0.08 |
0.03 ± 0.02 |
| Skeletal muscle |
0.21 ± 0.01 |
0.05 ± 0.01 |
0.06 ± 0.02 |
0 |
| Fat |
0.16 ± 0.02 |
0.09 ± 0.02 |
0.03 ± 0.00 |
0.01 ± 0.01 |
| Bone marrow |
10.12 ± 0.90 |
3.59 ± 1.56 |
0 |
0.13 |
In addition, we have also done the comparisons between i.v. and s.c. injections for male and female groups, separately (Table 4 and Table S2†). As expected, it showed the typical pattern of i.v. vs. s.c. injection. There were much more content of Ag or Au in most tissues after i.v. injection than that after s.c. injection since the s.c. injected Ag or Au had to break through various barriers before getting into blood vessels. However, the content of Ag as well as Au in axillary nodes of male rats displayed the opposite pattern. The possible reason might be due to the accumulation of phagocytes which phagocytosed Au@Ag NRs in the draining lymph nodes. Some published papers reported the similar results for other nanomaterials but not silver nanomaterials. A part of multi-walled carbon nanotubes (MWCNTs) injected subcutaneously into mice were engulfed by macrophages in the injection site and then carried away by these macrophages to enter the lymph nodes via the lymph ducts.32 Another group also reported that lymph nodes could collect a lot of AuNPs.33 In addition, the level of Ag, especially in adrenal gland of female rats was much higher than that in i.v. injection. The cause of this abnormality is not yet clear. We plan to do more experiments to explore it in the future.
4. Conclusions
Taken together, in this study, we have established an accurate and reliable ICP-MS method for measuring Ag and Au concentrations in biological tissues with a very low detection limit (0.005 μg g−1 for Ag and 0.015 μg g−1 for Au in blood; 0.020 μg g−1 for Ag and 0.015 μg g−1 for Au in liver) and good linearity up to 500 μg g−1. Further, this method has been used to analyze Ag or Au distribution in rat blood and organs after an i.v or s.c. administration of Au@Ag NRs. The time-dependent contents of Ag and Au in blood were investigated and two-related pharmacokinetic models have been constructed for quantitative bioavailability evaluation of AgNPs according to the measured Ag/Au contents in blood. There was the highest level of Ag in liver, followed by portal nodes, spleen, lung, bone marrow and pancreas at 24 h after i.v. injection. More importantly, we first found there were different gender-related distribution of Ag and Au in some organs, especially after s.c. injection. These important results can help us to evaluate and identify related biological risks of silver as well as gold nanomaterials.
Conflicts of interest
There are no conflicts to declare.
Acknowledgements
This study is financially supported by “Strategic Priority Research Program” of Chinese Academy of Sciences (XDA09040300) and the National Key Research and Development Program of China (2016YFA0200900, 2016YFA0200903).
Notes and references
- S. K. Singh, K. Goswami, R. D. Sharma, M. V. Reddy and D. Dash, Int. J. Nanomed., 2012, 7, 1023 CAS.
- M. Ahamed, M. S. Alsalhi and M. K. Siddiqui, Clin. Chim. Acta, 2010, 411, 1841 CrossRef CAS PubMed.
- R. A. Sperling, G. P. Rivera, F. Zhang, F. M. Zanella and W. J. Parak, Chem. Soc. Rev., 2008, 37, 1896 RSC.
- E. Boisselier and D. Astruc, Chem. Soc. Rev., 2009, 38, 1759 RSC.
- H. Zhou, P. Jiao, L. Yang, X. Li and B. Yan, J. Am. Chem. Soc., 2011, 133, 680 CrossRef CAS PubMed.
- X. Li, H. Zhou, L. Yang, G. Du, A. S. Pai-Panandiker, X. Huang and B. Yan, Biomaterials, 2011, 32, 2540 CrossRef CAS PubMed.
- H. J. Johnston, G. Hutchison, F. M. Christensen, S. Peters, S. Hankin and V. Stone, Crit. Rev. Toxicol., 2010, 40, 328 CrossRef CAS PubMed.
- Y. Xue, S. Zhang, Y. Huang, T. Zhang, X. Liu, Y. Hu, Z. Zhang and M. Tang, J. Appl. Toxicol., 2012, 32, 890 CrossRef CAS PubMed.
- R. Zhang, Y. Bai, B. Zhang, L. Chen and B. Yan, J. Hazard. Mater., 2012, 211, 404 Search PubMed.
- Q. Mu, G. Jiang, L. Chen, H. Zhou, D. Fourches, A. Tropsha and B. Yan, Chem. Rev., 2014, 114, 7740 CrossRef CAS PubMed.
- X. Zhang, W. Shen and S. Gurunathan, Int. J. Mol. Sci., 2016, 17, 1603 CrossRef PubMed.
- K. B. Riaz Ahmed, A. M. Nagy, R. P. Brown, Q. Zhang, S. G. Malghan and P. L. Goering, Toxicol. In Vitro, 2017, 38, 179 CrossRef CAS PubMed.
- D. P. Lankveld, A. G. Oomen, P. Krystek, A. Neigh, A. Troost-de Jong, C. W. Noorlander, J. C. Van Eijkeren, R. E. Geertsma and W. H. De Jong, Biomaterials, 2010, 31, 8350 CrossRef CAS PubMed.
- K. Park, E. J. Park, I. K. Chun, K. Choi, S. H. Lee, J. Yoon and B. C. Lee, Arch. Pharm. Sci. Res., 2011, 34, 153 CrossRef CAS PubMed.
- C. Recordati, M. De Maglie, S. Bianchessi, S. Argentiere, C. Cella, S. Mattiello, F. Cubadda, F. Aureli, M. D'Amato, A. Raggi, C. Lenardi, P. Milani and E. Scanziani, Part. Fibre Toxicol., 2016, 13, 12 CrossRef PubMed.
- J. Meng, Y. Ji, J. Liu, X. Cheng, H. Guo, W. Zhang, X. Wu and H. Xu, Nanotoxicology, 2014, 8, 686 CrossRef CAS PubMed.
- M. van der Zande, R. J. Vandebriel, E. Van Doren, E. Kramer, Z. Herrera Rivera, C. S. Serrano-Rojero, E. R. Gremmer, J. Mast, R. J. Peters, P. C. Hollman, P. J. Hendriksen, H. J. Marvin, A. A. Peijnenburg and H. Bouwmeester, ACS Nano, 2012, 6, 7427 CrossRef CAS PubMed.
- W. H. De Jong, L. T. Van Der Ven, A. Sleijffers, M. V. Park, E. H. Jansen, H. Van Loveren and R. J. Vandebriel, Biomaterials, 2013, 34, 8333 CrossRef CAS PubMed.
- S. C. G. Kiruba Daniel, V. Tharmaraj, T. Anitha Sironmani and K. Pitchumani, Appl. Clay Sci., 2010, 48, 547 CrossRef.
- D. K. Tiwari, T. Jin and J. Behari, Toxicol. Mech. Methods, 2011, 21, 13 CrossRef CAS PubMed.
- A. A. Ammann, J. Mass Spectrom., 2007, 42, 419 CrossRef CAS PubMed.
- Y. Nia, S. Millour, L. Noel, P. Krystek, W. D. Jong and T. Guérin, J. Nanomed. Nanotechnol., 2015, 6, 1 Search PubMed.
- D. P. Lankveld, R. G. Rayavarapu, P. Krystek, A. G. Oomen, H. W. Verharen, T. G. van Leeuwen, W. H. De Jong and S. Manohar, Nanomedicine, 2011, 6, 339 CrossRef CAS PubMed.
- K. C. Black, Y. Wang, H. P. Luehmann, X. Cai, W. Xing, B. Pang, Y. Zhao, C. S. Cutler, L. V. Wang, Y. Liu and Y. Xia, ACS Nano, 2014, 8, 4385 CrossRef CAS PubMed.
- Y. Xiang, X. Wu, D. Liu, Z. Li, W. Chu and L. Feng, Langmuir, 2008, 24, 3465 CrossRef CAS PubMed.
- Johan Gabrelsson, Pharmacokinetic and Pharmacodynamic Data Analysis: Concepts and Applications, 4th Edition, Swedish Pharmaceutical Press, ISBN: 9789197651004, 2007 Search PubMed.
- FDA, Bioavailability and Bioequivalence Studies Submitted in NDAs or INDs–General Considerations, Guidance for Industry, Rockville, MD, 2014 Search PubMed.
- A. Chrastina and J. E. Schnitzer, Int. J. Nanomed., 2010, 5, 653 Search PubMed.
- J. Tang, L. Xiong, S. Wang, L. Liu, J. Li, F. Yuan and T. Xi, J. Nanosci. Nanotechnol., 2009, 9, 4924 CrossRef CAS PubMed.
- H. S. Sharma, S. Hussain, J. Schlager, S. F. Ali and A. Sharma, Acta Neurochirurgica Supplementum, 2010, 106, 359 Search PubMed.
- Y. S. Kim, J. S. Kim, H. S. Cho, D. S. Rha, J. M. Kim, J. D. Park, B. S. Choi, R. Lim, H. K. Chang, Y. H. Chung, I. H. Kwon, J. Jeong, B. S. Han and I. J. Yu, Inhalation Toxicol., 2008, 20, 575 CrossRef CAS PubMed.
- J. Meng, M. Yang, F. Jia, Z. Xu, H. Kong and H. Xu, Nanotoxicology, 2011, 5, 583 CrossRef CAS PubMed.
- K. E. Carr, R. A. Hazzard, S. Reid and G. M. Hodges, Pharm. Res., 1996, 13, 1205 CrossRef CAS.
Footnotes |
| † Electronic supplementary information (ESI) available. See DOI: 10.1039/c8ra00044a |
| ‡ Contributed equally to this work. |
|
| This journal is © The Royal Society of Chemistry 2018 |
Click here to see how this site uses Cookies. View our privacy policy here. 
 Open Access Article
 This Open Access Article is licensed under a Creative Commons Attribution-Non Commercial 3.0 Unported Licence
 *d,
Liming Xu*b and
Liming Xie
*d,
Liming Xu*b and
Liming Xie