 Open Access Article
Creative Commons Attribution 3.0 Unported Licence
Structural changes, thermodynamic properties, 1H magic angle spinning NMR, and 14N NMR of (NH4)2CuCl4·2H2O
Ae Ran Lim *ab and
Sun Ha Kimcd
aAnalytical Laboratory of Advanced Ferroelectric Crystals, Jeonju University, Jeonju 55069, South Korea. E-mail: aeranlim@hanmail.net; arlim@jj.ac.kr; Fax: +82-63-220-2053; Tel: +82-63-220-2514
bDepartment of Science Education, Jeonju University, Jeonju 55069, South Korea
cSeoul Western Center, Korea Basic Science Institute, Seoul 03759, South Korea
dDepartment of Chemistry, Kyungpook National University, Daegu 41566, South Korea
First published on 9th February 2018
Abstract
The structural changes and thermodynamic properties of (NH4)2CuCl4·2H2O were studied by differential scanning calorimetry (DSC) and thermogravimetric (TG) analysis. In addition, the chemical shift, line width, and spin-lattice relaxation time of the crystals were also investigated by 1H magic angle spinning nuclear magnetic resonance (MAS NMR), focusing on the role of NH4 and H2O near the phase transition temperature. The change at TC2 (=406 K) and TC3 (=437 K) seems to be a chemical change caused by thermal decomposition rather than a physical change such as a structural phase transition. The changes in the temperature dependence of these data near TC2 are related to variations in the environments surrounding NH4 and H2O. The 14N NMR spectrum is also measured in order to investigate local phenomena related to the phase transition.
I. Introduction
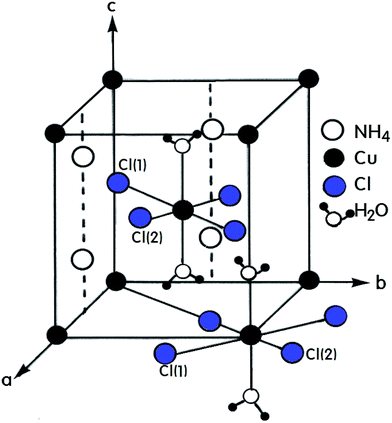
A number of compounds with the chemical formula A2BX4·2H2O, where A = NH4, K, Rb, Cs and B = Cu, Mn, Ca, Ni are monovalent and divalent metal ions, respectively, and X = Cl, Br is a halide ion, crystallize as perovskite-type two-dimensional layered structures.1–7 Crystals with this arrangement can be divided into two classes according to their symmetry and structure.8–10 The first class includes compounds containing Cu2+ ions that crystallize with tetragonal symmetry with the space group P42/mnm at room temperature. The tetrahedrons surrounding the divalent metal ions placed at the corners of the unit cell are rotated by exactly 90° with respect to the tetrahedron surrounding the ion at the center of the cell. The A+ ions are placed in the almost cubic cavities formed by the tetrahedrons.11,12 Crystals containing Mn2+, Ca2+, and Ni2+ ions form the second of these two classes with triclinic symmetry and the space group P1. The (NH4)2CuCl4·2H2O crystal, which is an example of the former, exhibits a structural phase transition from the point group 4/mmm to the point group 4(bar)2m at 200 K.13–15 In addition, two different phase transitions at approximately 383 K and 413 K were observed in the DC electric conductivity measurements reported by Narsimlu et al.16 At room temperature, (NH4)2CuCl4·2H2O forms a tetragonal structure with space group P42/mnm, as shown in Fig. 1.14 The unit cell contains two formula units and has the lattice constants a = b = 7.596 Å, c = 7.976 Å.17 The unit cell contains two Cu2+ ions at equivalent positions (0, 0, 0) and (1/2, 1/2, 1/2) each surrounded by an approximate octahedron of four Cl− ions and two water molecules. The line connecting the water molecules is parallel to the crystallographic c-axis.1 The water molecule is trigonal coordinated and forms two equivalent O–H⋯Cl(1) hydrogen bonds with an H⋯Cl(1) length of 2.186 Å. The O–H distance in the water molecule is 0.965 Å. The NH4+ is hydrogen bonded to the Cl(1) atoms at 3.357 Å, while in the other orientation, it is bonded to the Cl(2) atoms at 3.370 Å. The respective N–H distances are 1.011 Å and 1.021 Å.17The purpose of this study is to investigate the structural changes and thermodynamic properties of (NH4)2CuCl4·2H2O single crystals using differential scanning calorimetry (DSC) and thermogravimetric (TG) analysis. Further, the chemical shift, line width, and spin-lattice relaxation time T1ρ in the rotating frame of (NH4)2CuCl4·2H2O are measured by 1H magic angle spinning/nuclear magnetic resonance (MAS/NMR) near the phase transition temperature, focusing on the role of NH4 and H2O. In addition, the 14N NMR spectrum in the laboratory frame is measured as a function of the temperature, in an attempt to understand the structural geometry near the phase transition temperature. Our findings represent the first report on the thermodynamic properties and NMR characteristics of (NH4)2CuCl4·2H2O, and are useful for understanding the phase transitions.
II. Experimental method
Single crystals of (NH4)2CuCl4·2H2O were grown by slowly evaporating aqueous solutions containing a stoichiometric mixture of NH4Cl and CuCl2·2H2O in the molar ratio of 2![[thin space (1/6-em)]](https://www.rsc.org/images/entities/char_2009.gif) :
:![[thin space (1/6-em)]](https://www.rsc.org/images/entities/char_2009.gif) 1 at room temperature. The obtained crystals were light blue. The phase transition temperature was determined using a Dupont 2010 DSC instrument. The rate of temperature change during heating was 10 °C min−1.
1 at room temperature. The obtained crystals were light blue. The phase transition temperature was determined using a Dupont 2010 DSC instrument. The rate of temperature change during heating was 10 °C min−1.
The 1H MAS NMR spectra of (NH4)2CuCl4·2H2O in a rotating frame were obtained using the Bruker DSX 400 FT NMR spectrometer at the Korea Basic Science Institute, Western Seoul Center. The static magnetic field used was 9.4 T, and the central radio frequency was set at ω0/2π = 400.13 MHz for the 1H nucleus. The powder sample was placed in a 4 mm MAS probe, and the MAS rate was set to 5 kHz to minimize spinning sideband overlap. The spin-lattice relaxation times in the rotating frame were measured using a saturation recovery pulse sequence called sat–t–π/2; the nuclear magnetizations of the 1H nuclei at time t after the sat pulse, a combination of one hundred π/2 pulses applied at regular intervals, were determined following the π/2 excitation pulse. The width of the π/2 pulse was 3.45 μs below 410 K and 6.7 μs above 420 K for 1H.
In addition, the 14N NMR spectra of the (NH4)2CuCl4·2H2O single crystals in the laboratory frame were measured using a Unity INOVA 600 NMR spectrometer at the Korea Basic Science Institute, Western Seoul Center. The static magnetic field was 14.1 T, and the Larmor frequency was set to ω0/2π = 43.342 MHz. The 14N NMR experiments were performed using the solid-state echo sequence: 3.7 μs–t–3.7 μs–t. The NMR measurements were obtained in the temperature range of 180–430 K. Unfortunately, the chemical shift and resonance frequency could not be measured above 430 K because the NMR spectrometer did not have adequate temperature control at high temperature. The temperatures of all the samples were maintained at constant values by controlling the helium gas flow and heater current, which yielded an accuracy of ±0.5 K.
III. Results and discussion
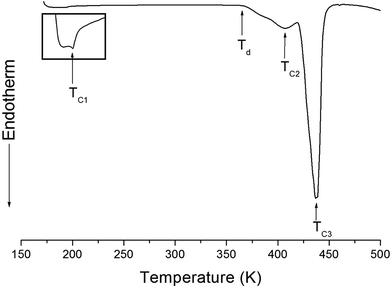
The structure of the (NH4)2CuCl4·2H2O crystals at room temperature was determined by X-ray diffraction (XRD) (PANalyical, X'pert Pro MPD) with a Cu-Kα (λ = 1.5418 Å) radiation source at the Korea Basic Science Institute, Western Seoul Center. Measurement was taken in a θ–2θ geometry from 10° to 60° at 45 kV and 40 mA tube power. The (NH4)2CuCl4·2H2O crystals were determined to have a tetragonal structure with the lattice constants a = b = 7.5991 Å, c = 7.9661 Å, α = β = γ = 90°. This result is consistent with those of previous studies.1,17 The DSC analysis of the (NH4)2CuCl4·2H2O crystals revealed three endothermic peaks during heating, as shown in Fig. 2. The mass of the powdered samples used in the DSC experiment is 6.6 mg. The endothermic peak enlarged in Fig. 2 near 200 K (=TC1) is consistent with the phase transition temperature reported previously, and is very small relative to the other endothermic peaks. The endothermic peaks near 406 K (=TC2) and 437 K (=TC3) are related to the thermal dehydration according to the below-mentioned loss of H2O. TG analysis was used to determine whether these high-temperature transformations were structural phase transitions or melting temperatures. The TG curve of (NH4)2CuCl4·2H2O is shown in Fig. 3. The first occurrence of mass loss begins at approximately 364 K, and at 406 K, 96.75% of mass remains, yielding (NH4)2CuCl4·1.5H2O. The mass loss at 430 K and 437 K reaches 6.49% and 9.74% for (NH4)2CuCl4·H2O and (NH4)2CuCl4·0.5H2O, respectively. The bulk mass of (NH4)2CuCl4·2H2O decreases at 364 K (Td), which is ascribed to the onset of partial thermal decomposition, and reaches complete thermal decomposition, thereby turning into (NH4)2CuCl4, at approximately 443 K. The transformation anomalies at 406 (=TC2) and 437 K (=TC3) in the DSC experiment are related to the phase transitions from (NH4)2CuCl4·2H2O to (NH4)2CuCl4·1.5H2O and from (NH4)2CuCl4·2H2O to (NH4)2CuCl4·0.5H2O, respectively. Optical polarizing microscopy showed that the crystals are light blue in color at room temperature and that they undergo color changes as the temperature increases. As the temperature increases, the color of the crystal varies from light blue (295 K and 373 K) to light green (386 K) to green (393 K) to dark yellow (433 K) and finally to brown (448 K), as shown in the inset of Fig. 3. This color change may be related to the partial loss of H2O. The DSC peaks at 406 K and 437 K are related to chemical changes through thermal dehydration, based on the TG and optical polarizing microscopy results. The weight loss evidenced by the TG curve suggests that TC2 and TC3 in (NH4)2CuCl4·2H2O are not related to physical changes such as structural phase transitions. Rather, they are related to a chemical change through thermal dehydration.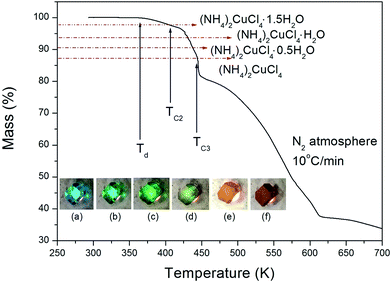 | ||
| Fig. 3 Thermogravimetric analysis (TGA) of (NH4)2CuCl4·2H2O (inset: color changes according to the temperature: (a) 295 K, (b) 373 K, (c) 386 K, (d) 393 K, (e) 433 K, and (f) 448 K). | ||
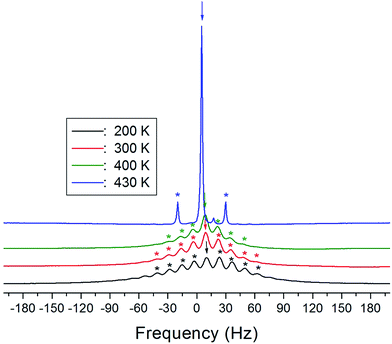
The 1H MAS NMR spectra of (NH4)2CuCl4·2H2O, which were obtained as a function of temperature, only exhibit one peak ascribed to chemical shift, as shown in Fig. 4. The spinning sidebands of the peak are marked with asterisks. There are two kinds of protons in (NH4)2CuCl4·2H2O: ammonium protons and water protons. The current experiment was unable to distinguish the signals resulting from these two types of protons, because the eight protons from ammonium and the four protons from water are expected to yield two superimposed lines. Thus, the signal generated by the ammonium protons might include the signal caused by the water protons.
The chemical shifts for the 1H nuclei in (NH4)2CuCl4·2H2O with respect to tetramethylsilane (TMS) at a frequency of 400.13 MHz are presented in Fig. 5 as a function of temperature. The chemical shifts of the 1H nucleus change abruptly near TC2, whereas those near TC1 are continuous. The change in the chemical shift with temperature indicates that the configuration of the atoms neighboring the 1H nuclei is undergoing change. The full width at half maximum (FWHM) of the 1H MAS NMR signal is shown in the inset of Fig. 5 as a function of temperature. As the temperature increases, the FWHM near TC1 is continuous, and that near TC2 decreases in a step-like shape. This stepwise narrowing is generally considered to be caused by internal motions, which have a temperature dependence related to that observed for the chemical shift. The shape of the line changes progressively with increasing temperature from the Gaussian-like shape of a rigid lattice to a Lorentzian shape. Near TC2 the line width undergoes an abrupt drop, after which the line width becomes considerably narrower.
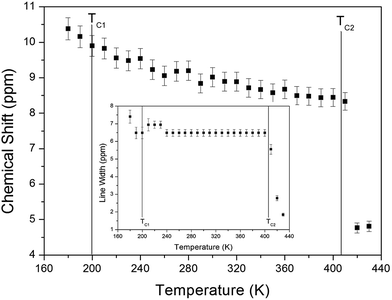 | ||
| Fig. 5 Chemical shift of 1H MAS NMR spectrum of (NH4)2CuCl4·2H2O as a function of temperature. (inset: line width of the 1H MAS NMR spectrum of (NH4)2CuCl4·2H2O). | ||
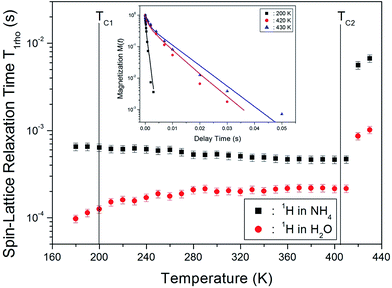
The nuclear magnetization recovery traces for 1H MAS NMR are usually represented by a single-exponential function. However, the magnetization recovery traces for 1H MAS NMR in (NH4)2CuCl4·2H2O could be described by the following double-exponential function:18–20
M(t)/M(∞) = a![[thin space (1/6-em)]](https://www.rsc.org/images/entities/char_2009.gif) exp(−t/T1ρ(s)) + b exp(−t/T1ρ(s)) + b![[thin space (1/6-em)]](https://www.rsc.org/images/entities/char_2009.gif) exp(−t/T1ρ(l)), exp(−t/T1ρ(l)),
| (1) |
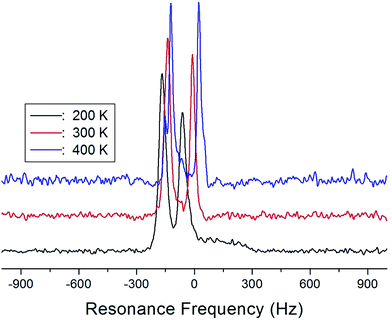
The NMR spectra of 14N of (NH4)2CuCl4·2H2O single crystals were recorded in order to investigate local phenomena related to the phase transition. The 14N nucleus has a spin number 1. Spectra were obtained by the solid-state echo method using static NMR at a Larmor frequency of ω0/2π = 43.342 MHz in the laboratory frame. The 14N NMR spectra of (NH4)2CuCl4·2H2O single crystals at 200, 300, and 400 K are shown in Fig. 7. Two resonance lines are expected because of the quadrupole interaction of the 14N (I = 1) nucleus.19 With respect to the crystal orientation, the magnetic field was applied along the crystallographic c-axis. The resonance frequencies of the 14N signals are plotted in Fig. 8, as a function of temperature. In the vicinity of TC1, the frequencies of both signals are discontinuous, whereas those near TC2 are continuous, and the resonance frequency increases with increasing temperature. In addition, the splitting of the 14N resonance lines above 200 K increases slightly with increasing temperature. These temperature-dependent changes in the 14N resonance frequencies are attributed to changes in the structural geometry of the NH4+ ion.22 In all temperature, all nitrogen is physically equivalent, and the 14N quadrupole parameter is slowly increased.23 In this case, the electric field gradient (EFG) tensors at the N sites are varied, reflecting the changing atomic configurations around the 14N nuclei in NH4.
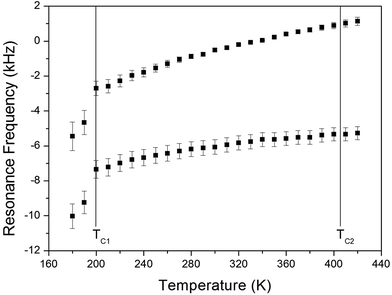 | ||
| Fig. 8 Resonance frequencies of 14N NMR spectrum of a (NH4)2CuCl4·2H2O single crystal as a function of temperature. | ||
IV. Conclusion
The thermodynamic properties and structural mechanisms near the phase transition temperatures in (NH4)2CuCl4·2H2O were studied through DSC, TG, NMR chemical shift, and the spin-lattice relaxation time T1ρ. The DSC and TG results indicate that the endothermic peak near 200 K (=TC1) is a structural phase transition, and the endothermic peaks near 406 K (=TC2) and 437 K (=TC3) are related to a chemical change through thermal dehydration due to the escape of H2O. On the other hand, the changes in the temperature dependence of the chemical shift, linewidth, and spin-lattice relaxation time T1ρ near TC2 are related to variations in the symmetry of the environments of NH4 and H2O. The mechanism of these changes at high temperature is related to hydrogen bond proton transfer involving the breakage of a weak hydrogen bond. The change at TC2 and TC3 seems to be a chemical change caused by thermal decomposition rather than a physical change such as a structural phase transition, and the tetrahedrons formed by the water molecules are probably disrupted by the loss of H2O. From the DSC, TG, and NMR data, it is clear that the structural change at high temperature arises due to the loss of the two water molecules coordinated to the Cu2+ ion along the c-axis.Conflicts of interest
There are no conflicts to declare.Acknowledgements
This research was supported by the Basic Science Research program through the National Research Foundation of Korea (NRF), funded by the Ministry of Education, Science and Technology (2016R1A6A1A03012069 and 2015R1A1A3A04001077).References
- N. Narsimlu and K. S. Kumar, Cryst. Res. Technol., 2002, 37, 945 CrossRef CAS.
- Z. Tylczynski, M. Wiesner and A. Trzaskowska, Phys. B, 2016, 500, 85 CrossRef CAS.
- A. R. Lim and J. Cho, J. Mol. Struct., 2017, 1146, 324 CrossRef CAS.
- T. O. Klaassen and N. J. Poulis, J. Phys. Colloq., 1971, 32(C1), 1157 CrossRef CAS.
- V. E. Zavodnik, V. K. Bel'skii, I. Diaz and V. Fernandez, Crystallogr. Rep., 1999, 44, 575 Search PubMed.
- W. Kaminsky, S. Haussuhl, A. Brandstadtor and C. Balarew, Z. Kristallogr., 1994, 209, 395 CAS.
- V. D. Franke, Y. O. Punin and L. A. P'yankova, Crystallogr. Rep., 2007, 52, 349 CrossRef CAS.
- M. Czlonkowska, Z. Tylczynski and M. Laniecki, Cryst. Res. Technol., 2006, 41, 464 CrossRef CAS.
- V. Stefov and B. Soptrajanov, Vib. Spectrosc., 1999, 19, 431 CrossRef CAS.
- S. N. Bhakay-Tamhane, A. Sequeira and R. Chidanbaram, Acta Crystallogr., Sect. B: Struct. Crystallogr. Cryst. Chem., 1980, 36, 2925 CrossRef.
- R. Chidambaram, Q. O. Navarro, A. Garcia, K. Linggoatmodjo, L. S. Chien and I.-H. Suh, Acta Crystallogr., Sect. B: Struct. Crystallogr. Cryst. Chem., 1970, 26, 827 CrossRef CAS.
- K. Waizumi, H. Masuda and H. Ohtaki, Acta Crystallogr., Sect. C: Cryst. Struct. Commun., 1992, 48, 1374 CrossRef.
- Z. Tylczynski and M. Wiesner, Mater. Chem. Phys., 2015, 149–150, 566 CrossRef CAS.
- M. L. bansal, V. C. Sahni and A. P. Roy, J. Phys. Chem. Solids, 1979, 40, 109 CrossRef CAS.
- H. Suga, M. Sorai, T. Yamanaka and S. Seki, Bull. Chem. Soc. Jpn., 1965, 38, 1007 CrossRef CAS.
- N. Narsimlu, K. Sivakumar and G. S. Sastry, Cryst. Res. Technol., 1996, 31, 385 CrossRef CAS.
- S. N. Bhakay-Tamhane, A. Sequeira and R. Chidambaram, Acta Crystallogr., Sect. B: Struct. Crystallogr. Cryst. Chem., 1980, 36, 2925 CrossRef.
- J. L. Koenig, Spectroscopy of Polymers, Elsevier, New York, 1999 Search PubMed.
- A. Abragam, The Principles of Nuclear Magnetism, Oxford University Press, 1961 Search PubMed.
- B. Cowan, Nuclear Magnetic Resonance and Relaxation, Cambridge University, UK, 1997 Search PubMed.
- A. R. Lim, S. W. Kim and Y. L. Joo, J. Appl. Phys., 2017, 121, 215501 CrossRef.
- A. R. Lim, Solid State Sci., 2016, 52, 37 CrossRef CAS.
- J. Seliger, R. Blinc, H. Arend and R. Kind, Z. Phys., B, Condens. matter, 1976, 25, 189 CAS.
| This journal is © The Royal Society of Chemistry 2018 |

