 Open Access Article
Experimental and theoretical investigation on corrosion inhibitive properties of steel rebar by a newly designed environmentally friendly inhibitor formula
Lijuan Feng†
 *ab,
Huaiyu Yang†*b,
Xin Cui†a,
Di Chen†a and
Guofu Li†a
aShandong Peninsula Engineering Research Center of Comprehensive Brine Utilization, Weifang University of Science and Technology, Shouguang, Weifang, 262700, P. R. China. E-mail: Ljfeng@alum.imr.ac.cn; Tel: +86-536-5107638
bState Key Laboratory for Corrosion and Protection, Insititute of Metal Research, Chinese Academy of Sciences, Shenyang, 110016, P. R. China
First published on 9th February 2018
Abstract
In order to mitigate the corrosion of steel rebar in concrete, a new environmentally friendly corrosion inhibitor formula (WKI) was designed and the corrosion inhibitive effects of WKI on steel rebar were studied by gravimetric method, electrochemical impendence spectroscopy (EIS), potentiodynamic polarization and Mott–Schottky scanning in simulated concrete pore solution. Furthermore, surface analysis and quantum chemical calculations were conducted in order to illustrate the corrosion inhibitive mechanism. The results indicate that WKI exhibits excellent corrosion inhibitive activities on steel rebar in simulated concrete pore solution. By the presence of WKI, local corrosion was significantly suppressed and no pitting could be detected during the whole experimental period. The total corrosion resistance was increased from 5469 Ω cm2 to 64![[thin space (1/6-em)]](https://www.rsc.org/images/entities/char_2009.gif) 440 Ω cm2 and the corrosion current density was reduced from 3.23 μA cm−2 to 0.21 μA cm−2 for the sample immersed in the corrosion medium for 7 d with WKI. The corrosion potential of the steel rebar electrode moved to a higher level and the charge transfer resistance increased, indicating that the anti-corrosion properties of the steel rebar were enhanced. The corrosion inhibitive mechanism of WKI can be attributed to the fact that it can promote the formation of a passive film and reduce its defect concentration via its adsorption and interaction with the metal surface, consequently inhibiting the corrosion of steel rebar caused by chloride ions.
440 Ω cm2 and the corrosion current density was reduced from 3.23 μA cm−2 to 0.21 μA cm−2 for the sample immersed in the corrosion medium for 7 d with WKI. The corrosion potential of the steel rebar electrode moved to a higher level and the charge transfer resistance increased, indicating that the anti-corrosion properties of the steel rebar were enhanced. The corrosion inhibitive mechanism of WKI can be attributed to the fact that it can promote the formation of a passive film and reduce its defect concentration via its adsorption and interaction with the metal surface, consequently inhibiting the corrosion of steel rebar caused by chloride ions.
1. Introduction
Reinforced concrete is one of the most widely used structures in the construction industry. However, the phenomenon of concrete failure is increasing year by year.1–5 Especially in a high salt environment, the corrosion problem of the concrete structure is very severe; accidents like collapse of bridges, fracture of steel rebars, and leakage of concrete components happen frequently. It is reported that the annual corrosion loss in China is more than 500 million yuan.6 As we know, the major reason for concrete damage is steel rebar corrosion, therefore, the key solution to enhance the durability of concrete is to control the corrosion of reinforcement.Steel rebar in concrete is normally very stable by virtue of the high pH condition in concrete which enable a passive film formed on the metal surface. However, as time goes by, aggressive species (such as Cl−) in the environment penetrate into the concrete structure or CO2 in atmosphere reacts with the alkaline substances in it, the service environment of steel rebar will be alternated and its passive state will be destroyed.7,8 Then significant structural damage will be incited when steel rebar corrosion is initiated due to that (i) the cross section of the steel rebar becomes smaller and the load carrying capacity of the reinforced concrete is reduced; (ii) the volume of corrosion product exerts internal pressure within the structure, leading to spalling and cracking of the concrete.9,10 Thus, reinforcement corrosion results in huge problems: not only the performance of the concrete structure will decline or even it goes failure, but also a serious threat to the life and property of people is caused. Therefore, it is of significant importance to take effective measures for the purpose of inhibiting steel rebar corrosion.
It has been confirmed that application of corrosion inhibitors during the concrete casting process is a recommended technology to prevent steel rebar from corrosion due to their high corrosion inhibitive efficiency, low cost and easy operation properties.7,11 However, while rebar inhibitors are applied in more and more constructions, the related problems ensued. The traditional inorganic inhibitors which have been proved to be of great help for extending the service life of reinforced concrete structure are forbidden by more and more countries.12–14 It is a trend to develop environmental-friendly organic corrosion inhibitors, but both theoretical and practical investigations are limited and there are conflicting opinions regarding with both their inhibitive effects and their inhibitive mechanism.7,15–17 Thereby, the application of new organic corrosion inhibitors in reinforced concrete structure is limited. Meanwhile, there is an oxide film formed on the steel surface due to the high alkaline of the concrete environment (pH = 12.5–13.5), which causes the steel rebar corrosion processes so complicated that the inhibition purposes can hardly be reached completely by using only one type of inhibitor.18,19 Thus, utilizing the synergistic effect of different type of inhibitors to mitigate steel rebar corrosion has been an important aspect for rebar inhibitors design.20,21
Previously, a sequence of organic inhibitors have been developed by our research group and the synergistic effects of these compounds were also attempted to be investigated.17,22–27 Based on these researches, a new type of inhibitors formula (WKI) was designed with 1-[N,N-bis(hydroxylethylether)-aminoethyl]-2-stearic-imidazoline (HASI), ascorbic acid (AA), sodium dodecyl benzene sulfonate (SDBS) and sodium dihydrogen phosphate (SDP) as the main components. The corrosion inhibitive behaviours of WKI were investigated by gravimetric method and electrochemical techniques in simulated concrete pore solutions. The adsorption mechanism was discussed based on the above experimental results, the surface analysis and quantum chemical calculations. The objective of this study was to design a type of environmental-friendly rebar inhibitors formula and to determine its corrosion inhibitive mechanism, further, to provide a practical and theoretical support for the application of similar rebar inhibitors and to propose a reference for the design of new inhibitors.
2. Experimental
2.1. Materials
The saturated Ca(OH)2 solution prepared from the reagent grade chemical and bi-distilled water was used to simulate the concrete pore solution. 1.15% NaCl was added to induce steel rebar corrosion in the light of technical specification for application of rebar inhibitors YB/T 9231-2009. The amount of WKI applied was 0.01% by weight. The samples used in the research were made from R 235 carbon steel rebar (0.15% C; 0.15% Si; 0.44% Mn; 0.30% P; 0.03% S and balance Fe).2.2. Gravimetric tests
The gravimetric tests were carried out using carbon steel specimens of national standard size (50 mm × 25 mm × 2 mm). Before the tests, they were progressively ground up to 800 grit with abrasive papers of increasing grit sizes (240 grit, 360 grit, 600 grit, 800 grit). Then the samples were rinsed with double-distilled water, degreased in the ethanol and dried with cold air.17,22,23,28–30 The weight of the samples was measured using the analytical balance (Mettler Toledo ME204T/02) after they were cleaned and dried. The experimental temperature was controlled at 25 °C and the experimental period was 7 d.2.3. Electrochemical experiments
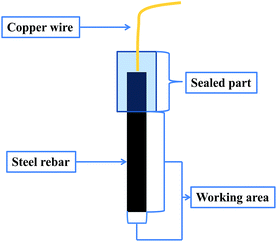
The samples used for electrochemical measurements were cylinders with the diameter of 10 mm and the length of 70 mm. Part of the side surface (with the length of 50 mm) and one bottom surface of the cylinder were served as the working surface, the rest part was embedded in epoxy resin (Fig. 1). The surface roughness of all the specimens was 6.3 μm. All the electrochemical tests were performed on the electrochemical workstation (Princeton Applied Research), using a three electrode system. The steel rebar sample was used as working electrode, a carbon cylinder (Ø 12 mm × 20 mm) as the counter electrode and saturated KCl calomel electrode (SCE) as reference electrode. The electrochemical impedance spectra were obtained in the frequency range from 100 kHz to 10 mHz at the open circuit potential (OCP). The amplitude of AC excitation signal was 5 mV, and the experimental results were analyzed by Zview software. Potentiodynamic polarization scans were conducted from −0.2 V (relative to OCP) to the potential at which anodic polarization current density suddenly increased rapidly (passive film broken down). The scan rate applied was 1 mV s−1, which is the most frequently used one in corrosion science study.31–35 The experimental results were analyzed by Corrview software. Mott–Schottky curves were recorded from −1.2 V to 0.4 V (SCE) using a sinusoidal signal of 5 mV at the scan rate of 20 mV s−1 after the sample was reduced at −1.0 V for 5 min and immersed in the test solution for 30 min. At that time, the open circuit potentials of the samples in the corrosion media without and with WKI were −0.402 V and −0.379 V, respectively. All the experiments were conducted at room temperature and all potentials reported are relative to the reference electrode (SCE).2.4. Surface morphological observation and analysis
Before the experiments, the samples were roughened down to 2.5 μm and immersed in the alkaline chloride solutions without and with WKI for 7 d. Scanning electron microscopy (SEM, Philip XL 30) was performed to observe the surface morphologies of metal samples. The energy of the acceleration beam employed was 25 kV. Chemical compositions of the inhibited and uninhibited samples surfaces were analyzed by an Energy Dispersive Spectrometer (EDS) detector affiliated to the SEM.2.5. Quantum chemical calculations
In order to reveal the inhibitive mechanism, quantum chemical calculations were carried out to determine the electronic structure of the compounds that consisted in the inhibitors formula. Quantum chemical calculations were conducted by Materials Studio 7.0 (MS) software (Accelrys Co.). Geometry optimizations of the compounds were carried out isolate by DMol3 module using density functional theory (DFT) which is widely applied in the analysis of structural natures of inhibitors on the interaction process with metals.36–41 Ultrasoft pseudopotential used was generalized gradient approximation (GGA PW91).42,43 DMol3 uses numerical orbitals for the basis functions and each function corresponds to an atomic orbital (AO). In DMol3, the basis functions χμ are given numerically as values on an atomic-centered spherical-polar mesh rather than as analytical functions (Gaussian orbitals). The angular portion of each function is the appropriate spherical harmonic Ylm(θ,φ). The radial portion F(r) is obtained by solving the atomic DFT equations numerically. Additional basis functions, including polarization, are obtained by DFT atomic ion calculations, DFT excited-state atom calculations as well as hydrogenic orbitals. A hydrogenic 2p function for Z = 1.3 is used for hydrogen. The use of various nuclear charges to generate polarization functions is analogous to the variation of zeta in Gaussian basis sets.44,45 One of the most accurate basis set in DMol3 module, i.e. the double numerical basis set with d and p polarization (DNP) was applied in the computational process. Previous investigations have indicated that the DNP basis set is of comparable quality to the 6-31G Gaussian basis set and it is more accurate than the Gaussian basis set of the same size.46–49 The integration accuracy and the self-consistent field tolerance were both set as fine. Core treatment was used to all electrons. The SCF tolerance was 1.0 × 10⁻⁶ with no smearing setup. The convergence tolerances of energy, the max force and the max displacement were 1.0 × 10⁻⁵ Ha, 0.002 Ha Å−1 and 0.005 Å, respectively. Molecular graphics were produced by MS itself. Grid interval was set as 0.25 Å and the border was 3.0 Å for the orbitals calculations.3. Results and discussion
3.1. Gravimetric study
Table 1 depicts the gravimetric test results of the samples immersed in the simulated concrete pore solutions without and with WKI. The corrosion rate can be calculated according to the following formula:
 | (1) |
| Corrosion media | W0 (g) | W1 (g) | W1 − W0 (g) | Corrosion rate (mm a−1) |
|---|---|---|---|---|
| Blank 1 | 20.9778 | 20.9740 | −0.0038 | 0.0169 |
| Blank 2 | 20.9817 | 20.9776 | −0.0041 | 0.0183 |
| Blank 3 | 20.9520 | 20.9483 | −0.0037 | 0.0165 |
| With WKI 1 | 20.9728 | 20.9732 | 0.0004 | — |
| With WKI 2 | 21.0703 | 21.0707 | 0.0004 | — |
| With WKI 3 | 20.9636 | 20.9639 | 0.0003 | — |
According to Table 1, the weight for the samples immersed in the solutions absence of WKI was significantly reduced and the average corrosion rate was as high as 0.0172 mm a−1. Moreover, it can be observed that rust was generated on the surface of the test samples. These results clearly illustrated that the passive film on the sample surface was broken down and the metal suffered serious local corrosion.51 However, after addition of WKI, the weight of the samples was not reduced but increased after 7 d immersion, indicating WKI can promote the passivity of steel rebar and the sample can form a complete protective film even in the presence of chloride ions. In addition, it can be seen from Table 1 that the differences among the three parallel specimens were very small, indicating that the experimental results are accurate and reliable.
3.2. Electrochemical impendence spectroscopy (EIS)
Fig. 2 shows the electrochemical impedance spectrum variations for the steel rebar sample in the blank solution with immersion time. It can be found that the capacitance arc radius of the sample decreased with the increase of immersion time in the Nyquist diagram; similarly, the modulus of the impedance was reduced in the Bode plots. This is because that a passive layer was formed on the steel surface due to the interaction of the metallic ions and hydroxyl ions when the metal was immersed in the high alkaline environment.52 Then after that, with the increase of immersion time, chloride ions gradually penetrated to the metal surface and interacted with the oxide film, leading to the dissolution of oxide film and the corrosion of steel rebar. Thus, the sample was still at passive sate in the initial stage of immersion, and the corrosion of steel rebar was mainly controlled by charge transfer process, therefore, the impedance spectroscopy depicted the passive characteristics of the steel rebar sample. Then an impedance capacitive arc with a huge diameter appeared at the impedance plane (the capacitive arc diameter was over 20![[thin space (1/6-em)]](https://www.rsc.org/images/entities/char_2009.gif) 000 Ω cm2) in Fig. 2(a) and there was only one time constant appeared in the electrochemical impedance spectrum as shown in Fig. 2(b). However, as time went by, the capacitance arc diameter was gradually decreased and the region with high phase angel was shrunk due to the invading of chloride ions. By the third day, chloride ions were penetrated to the metal surface and induced steel rebar corrosion, causing the capacitance arc diameter reduced to only about 4000 Ω cm2. Meanwhile, the electrochemical impedance spectrum of steel rebar had two time constants, indicating local corrosion had occurred.16 The time constant at high frequency region reflected the surface state of the electrode and the one at low frequency region reflected the Faraday charge transfer process of steel rebar corrosion.53
000 Ω cm2) in Fig. 2(a) and there was only one time constant appeared in the electrochemical impedance spectrum as shown in Fig. 2(b). However, as time went by, the capacitance arc diameter was gradually decreased and the region with high phase angel was shrunk due to the invading of chloride ions. By the third day, chloride ions were penetrated to the metal surface and induced steel rebar corrosion, causing the capacitance arc diameter reduced to only about 4000 Ω cm2. Meanwhile, the electrochemical impedance spectrum of steel rebar had two time constants, indicating local corrosion had occurred.16 The time constant at high frequency region reflected the surface state of the electrode and the one at low frequency region reflected the Faraday charge transfer process of steel rebar corrosion.53
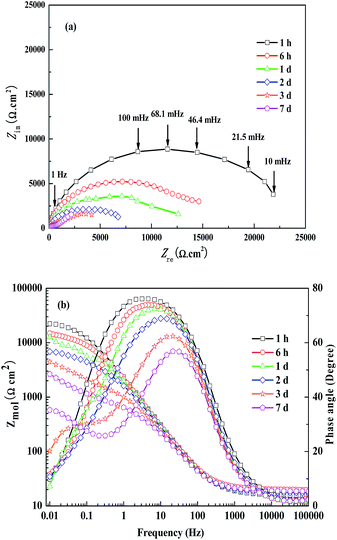 | ||
| Fig. 2 Evolution of EIS for the sample with immersed time in the corrosion medium without WKI, (a): Nyquist diagram; (b): Bode plots. | ||
Fig. 3 exhibits the electrochemical impedance spectrum of the steel electrode with immersion time after adding WKI. As can be seen from Fig. 3, the passivity of the steel rebar sample had been obviously increased by the presence of WKI. In the early stage of immersion, the charge transfer resistance of the electrode surface was huge and the time constant was very large, thus, the characteristic frequency was very low and it was difficult to obtain a complete capacitive loop, consequently, it can only be observed an electrochemical impedance arc with the imaginary part much larger than the real one.54 As immersion time increased, the chloride ions gradually diffused to the surface of sample, which resulted in the dissolution of the passive film on the metal surface to some extent. However, the passive film was repaired simultaneously under the action of the inhibitors; thus, the passive film was not damaged. The high phase angel region was very large and the modulus value of the impedance was high. In Fig. 3(a), the impedance capacitance arc diameter was still larger than 60![[thin space (1/6-em)]](https://www.rsc.org/images/entities/char_2009.gif) 000 Ω cm2 after 7 d immersion. During the whole immersion period, the corrosion inhibitive effect of WKI on steel rebar was so strong that the passive film had directly influenced the charge transfer process, thus, the electrochemical impedance spectroscopy showed only one time constant, indicating the steel rebar was at passive state.15,54
000 Ω cm2 after 7 d immersion. During the whole immersion period, the corrosion inhibitive effect of WKI on steel rebar was so strong that the passive film had directly influenced the charge transfer process, thus, the electrochemical impedance spectroscopy showed only one time constant, indicating the steel rebar was at passive state.15,54
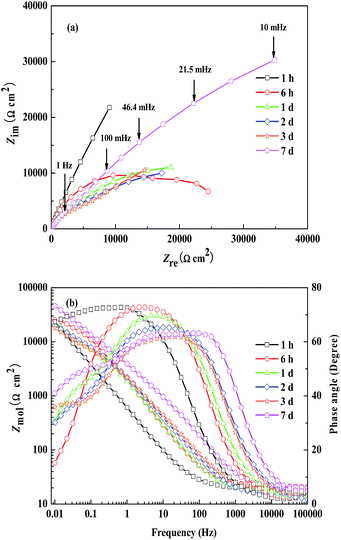 | ||
| Fig. 3 Evolution of EIS for the sample with immersed time in the corrosion medium with WKI, (a): Nyquist diagram; (b): Bode plots. | ||
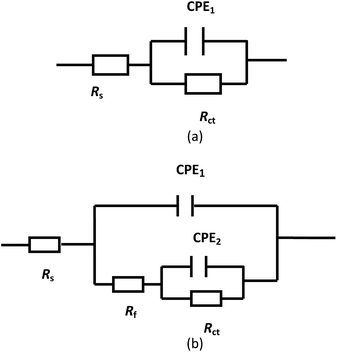
The equivalent circuits in Fig. 4 can be used to fit the impedance behaviours of steel rebar samples in the corrosion media. Fig. 4(a) was applied to fit the electrochemical impedance spectrum of the sample in the blank solution in the early stage of the immersion process and that of the sample in the solution with WKI.16,55 Fig. 4(b) was used to fit the electrochemical impedance behaviour of steel rebar sample in the blank solution when local corrosion occurred.53,56 Rs represents the solution resistance, Rf the film resistance, Rct the charge transfer resistance. Due to the surface inhomogeneous properties of the electrode, the shape of the capacitive loop often deviates from theoretical model, constant phase element CPE is used instead of the capacitor C, CPE1 represents the double layer capacitor, CPE2 represents the film capacitance.57,58
The impedance of the constant phase angle element CPE can be calculated by the following equation:
| Z(ω) = Z0−1(jω)−n | (2) |
 | (3) |
 | (4) |
Previous studies have revealed that the corrosion activity of steel rebar is closely related to the total resistance of the complex film resistance Rf and the charge transfer resistance Rct. Thus Rt is defined as Rt = Rf + Rct to reveal the corrosion behaviours of the steel rebar samples. The fitting results are shown in Table 2. From Table 2, it can be seen that the value of Rt for the sample in the system with WKI was obviously higher than that in the blank solution, which suggested the passivity of the sample was increased and the corrosion risk was reduced.58 It also can be observed that the interface capacitance of the sample was increased in addition of WKI. It may be ascribed to that the surface state of sample was improved by the inhibitors, whereas numerous hydroxyl ions and corrosion inhibitors were adsorbed on the sample surface even at the early stage of the immersion, leading to the increase of the dielectric constant of the electric double layer. Meanwhile, the interface roughness was increased (which was confirmed by the smaller value of n) due to the rapid formation of the surface film on the metal, which also resulted in the increase of the double layer capacitance.
| Solution | Time (h) | C1 (μF cm−2) | CPE1−n | Rct (Ω cm2) | C2 (μF cm−2) | CPE2−n | Rf (Ω cm2) | Rt (Ω cm2) |
|---|---|---|---|---|---|---|---|---|
| Blank | 1 | 87.9 | 0.87 | 22![[thin space (1/6-em)]](https://www.rsc.org/images/entities/char_2009.gif) 745 745 |
— | — | — | 22![[thin space (1/6-em)]](https://www.rsc.org/images/entities/char_2009.gif) 745 745 |
| 6 | 97.8 | 0.86 | 13![[thin space (1/6-em)]](https://www.rsc.org/images/entities/char_2009.gif) 883 883 |
— | — | — | 13![[thin space (1/6-em)]](https://www.rsc.org/images/entities/char_2009.gif) 883 883 |
|
| 24 | 111.8 | 0.83 | 9656 | — | — | — | 9656 | |
| 48 | 122.7 | 0.83 | 8613 | — | — | — | 8613 | |
| 72 | 123.4 | 0.83 | 1313 | 905.7 | 0.60 | 6176 | 7489 | |
| 168 | 153.2 | 0.81 | 763 | 2138.1 | 0.64 | 4706 | 5469 | |
| With WKI | 1 | 384.9 | 0.80 | 295![[thin space (1/6-em)]](https://www.rsc.org/images/entities/char_2009.gif) 400 400 |
— | — | — | 295![[thin space (1/6-em)]](https://www.rsc.org/images/entities/char_2009.gif) 400 400 |
| 6 | 139.1 | 0.79 | 32![[thin space (1/6-em)]](https://www.rsc.org/images/entities/char_2009.gif) 013 013 |
— | — | — | 32![[thin space (1/6-em)]](https://www.rsc.org/images/entities/char_2009.gif) 013 013 |
|
| 24 | 130.9 | 0.78 | 25![[thin space (1/6-em)]](https://www.rsc.org/images/entities/char_2009.gif) 073 073 |
— | — | — | 25![[thin space (1/6-em)]](https://www.rsc.org/images/entities/char_2009.gif) 073 073 |
|
| 48 | 120.6 | 0.74 | 23![[thin space (1/6-em)]](https://www.rsc.org/images/entities/char_2009.gif) 933 933 |
— | — | — | 23![[thin space (1/6-em)]](https://www.rsc.org/images/entities/char_2009.gif) 933 933 |
|
| 72 | 122.8 | 0.72 | 20![[thin space (1/6-em)]](https://www.rsc.org/images/entities/char_2009.gif) 524 524 |
— | — | — | 20![[thin space (1/6-em)]](https://www.rsc.org/images/entities/char_2009.gif) 524 524 |
|
| 168 | 75.1 | 0.68 | 64![[thin space (1/6-em)]](https://www.rsc.org/images/entities/char_2009.gif) 440 440 |
— | — | — | 64![[thin space (1/6-em)]](https://www.rsc.org/images/entities/char_2009.gif) 440 440 |
However, the composition of the passive film on the sample was gradually stabilized as the immersion time increased. Thus, the interface capacitance values of the sample in the blank solution and that with WKI both stayed at about 120 μF cm−2 after 2 d immersion. Then local corrosion occurred to the sample in the blank solution where the oxide film was damaged and the thickness of the double layer was decreased, leading to the increase of C1. By the 7 d, the value of Rt was decreased to 5469 Ω cm2 and the value of C1 reached 153.2 μF cm−2. Meanwhile, the thickness of the surface film was increased and the value of C1 was decreased for the sample immersed in the solution with WKI due to inhibitors were adsorbed on the metal surface and the passive film grew stably.15 Consequently, the passive film on the sample was still complete and the value of Rt was as high as 64![[thin space (1/6-em)]](https://www.rsc.org/images/entities/char_2009.gif) 440 Ω cm2 after 7 d immersion in the corrosion medium when WKI was added. This result also has been confirmed in the gravimetric tests. All these results further indicated that WKI effectively promoted the formation and stability of the passive film on the metal surface and enhanced its anti-corrosion properties.
440 Ω cm2 after 7 d immersion in the corrosion medium when WKI was added. This result also has been confirmed in the gravimetric tests. All these results further indicated that WKI effectively promoted the formation and stability of the passive film on the metal surface and enhanced its anti-corrosion properties.
3.3. Potentiodynamic polarization
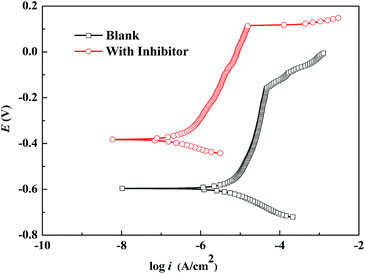
Fig. 5 shows the potentiodynamic polarization curves for the samples immersed in the corrosion media without and with WKI for 7 d. From Fig. 5, it is evident that there was a distinct Tafel region on the polarization curve and the potential had a linear relationship with logarithm form of the current density. Therefore, electrochemical corrosion kinetic parameters can be obtained by fitting the polarization curves using extrapolation method and the results are listed in Table 3, where, Ecorr is the corrosion potential, icorr is the corrosion current density, βa is the anodic Tafel slope and βc is the cathodic Tafel slope.50,62,63| Corrosion media | Ecorr (V vs. SCE) | icorr (μA cm−2) | βc (mV dec−1) | βa (mV dec−1) |
|---|---|---|---|---|
| Blank | −0.596 | 3.23 | 46 | 95 |
| With WKI | −0.382 | 0.21 | 49 | 96 |
From Fig. 5 and Table 3, compared with the steel rebar in the blank solution, the corrosion current density of the sample was reduced from 3.23 μA cm−2 to 0.21 μA cm−2 and both the anodic and cathodic current density decreased significantly after addition of WKI, indicating both the cathodic and anodic processes of electrochemical corrosion were effectively suppressed. The corrosion potential of the sample shifted to the positive direction after addition of WKI, indicating its inhibitive effects on the anodic processes were more significant. However, the variations of the cathodic and anodic Tafel slopes were very small, suggesting the electrochemical reaction mechanism was not changed by the addition of WKI, therefore, the corrosion inhibitive effect of WKI on the steel rebar sample was mainly attributed to that WKI promoted the formation and stability of the protective film on the metal surface, which is consistent with the gravimetric results.50,53
3.4. Mott–Schottky investigation
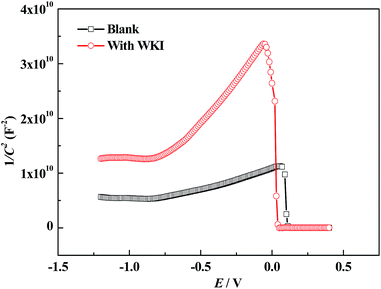
In acidic conditions, the inhibitive mechanism of corrosion inhibitors can be ascribed to that they can form a protective film via physical or chemical adsorption which reduces the active sites on the metal surface or decrease the contact area of the corrosion medium and metal.64,65 However, in alkaline environment, especially for the case that a passive film is formed on the metal surface, the inhibitive mechanism will be much more complicated.66 In such occasion, corrosion inhibitors not only react with the metal, but also interact with the surface oxides, and their effect with the surface film is much more important, so that it is of great significance to investigate the influence of inhibitors on the properties of the surface film.67It is well known that there is a bi-layer structure at the interface of the passive metal and the solution, as shown in Fig. 9. The outer layer is an amorphous structure which is formed by the iron hydroxides and adsorbed species. The inner layer is formed by the iron oxides (such as Fe3O4, Fe2O3) which is very condense and also called barrier layer.58,68 It is reported the inner layer is a conductor with many defects, which plays the most important role in the corrosion processes of metals. Previous studies suggested that iron oxides belong to n type semiconductor and the Mott–Schottky curve obtained under the perturbation frequency of 1 kHz can reflect the space charge distribution in the semiconductor film. For an n type semiconductor, the space charge capacitance has the following relationship with the scanning potential:
 | (5) |
| Solution | N (cm−3) |
|---|---|
| Blank | 1.64 × 10²¹ |
| With WKI | 3.70 × 10²⁰ |
From Table 4, it is obvious that the charge carrier density decreased significantly after addition of WKI, which implied that the defect concentration in the surface film decreased and the property of the surface film was improved remarkably. According to previous studies, the oxide layer on the surface of the reinforcement has spinel structure, which is a typical defective structure with excess oxygen vacancies.68 It is beneficial for the diffusion of anions and cations in such structure. Especially, aggressive species like chloride ions can easily invade the surface film via these defects, causing corrosion of steel.70,71 When WKI was present in the solution, it promoted the formation of a more stable protective film and reduced its defect concentration, thus, effectively inhibited the steel rebar corrosion induced by chloride ions.
3.5. Surface morphological observation and analysis
Fig. 7 shows the SEM images for the samples immersed in the corrosion media for 7 d in the absence and presence of WKI. The EDS analysis results of some special areas like local corrosion region (1) and surface area with particles (2) were also included. It is evident that there are significant differences in the corrosion morphologies before and after addition of WKI. It is overt that many corrosion pits and corrosion spots are distributed on the surface of the sample immersed in the blank solution, which indicated that it suffered serious local corrosion.72 A further analysis by the EDS illustrated Ca, O, C, Cl elements were presented in the steel surface, indicating the surface film formed without corrosion inhibitor was very weak and had many active sites. Thus, many substances can be easily adsorbed on the steel surface and adsorption of chloride ions caused the initial of local corrosion.51 However, in the presence of WKI, the surface of the sample (Fig. 7(b-1)) was much more homogeneous. No pitting sign can be observed but only some scattered white particles can be seen. The energy spectrum analysis implied the main elements that constituted the white particles were Ca, C and O, thereby, they might be adsorbed Ca(OH)2 and CaCO3. These results suggest that the surface film structure of the sample was significantly improved after adding WKI, and the anti-corrosion characteristics of the steel rebar were distinctively enhanced. In addition, no chloride peak was detected in the energy spectrum of the sample surface immersed in the solution with WKI, which may be attributed to the competitive adsorption between WKI and chloride ions on the steel surface.73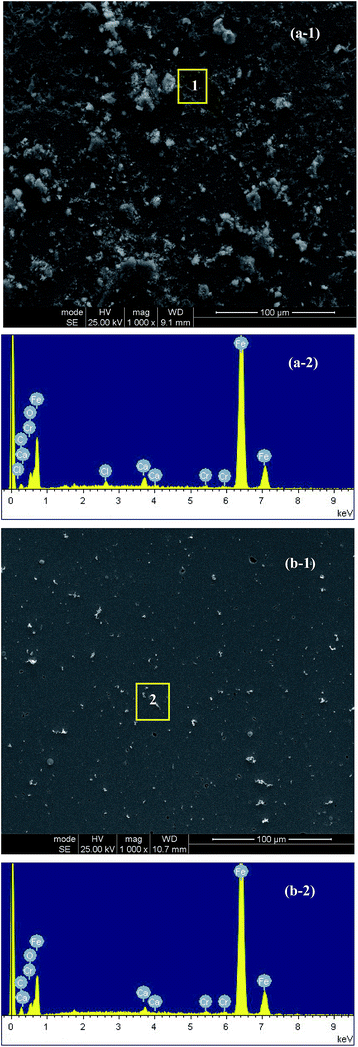 | ||
| Fig. 7 SEM micrographs (top) and EDS analysis results (bottom) of the samples surfaces exposed to the corrosion media without and with WKI for 7 d: (a) blank; (b) with WKI. | ||
3.6. Quantum chemical calculations
It is reported that the inhibitive activities of inhibitors are closely related to their electronic structure and spatial configuration.74,75 In order to further understand the mechanism of WKI, quantum chemical calculations were carried out using Dmol3 to analyze the structural parameters of the four compounds that consisted of WKI, namely, HASI, AA, SDP and SDBS. The optimized molecular structures, the electron density distributions in the highest occupied molecular orbital (HOMO) and the lowest unoccupied molecular orbital (LUMO) are given in Fig. 8. The structural parameters of the related molecules are listed in Table 5. The absolute hardness (η), electronegativity (χ) and fraction charge transfer number (ΔN) were calculated by the following equations, respectively:
 | (6) |
 | (7) |
| I = −EHOMO | (8) |
| A = −ELUMO | (9) |
| χ = I | (10) |
 | (11) |
 | (12) |
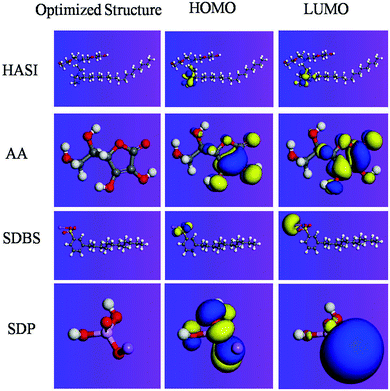 | ||
| Fig. 8 Optimized molecular structures and the Frontier molecular orbital density distributions of the four compounds consisted of WKI. | ||
| Inh. | Charge | EHOMO/(eV) | ELUMO/(eV) | η/(eV) | χ/(eV) | ΔN |
|---|---|---|---|---|---|---|
| HASI | 0 | −4.6845 | −0.1311 | 2.2767 | 2.4078 | 0.5298 |
| AA | 0 | −5.9014 | −2.1909 | 1.8552 | 4.0462 | 0.2085 |
| SDBS | 0 | −5.7762 | −2.0349 | 1.8706 | 3.9055 | 0.2444 |
| SDP | 0 | −5.7917 | −1.8783 | 1.9567 | 3.8350 | 0.2517 |
| AA | −1 | 0.1996 | 2.7049 | 1.2527 | −0.1996 | 2.0035 |
| SDBS | −1 | −1.0811 | 1.8883 | 1.4847 | 1.0811 | 1.2591 |
| SDP | −1 | −0.3738 | 4.4561 | 2.4149 | 0.3738 | 0.9206 |
The working function Φ was defined, as:
| φ = ΔV − μ | (13) |
According to the Frontier molecular orbital theory, the interaction between the inhibitors and the metallic atom depends on the energy of HOMO and LUMO of inhibitors. EHOMO corresponds to the electron donating ability of inhibitors while ELUMO is related to the electron affinity and portrays the tendency of inhibitors to accept electrons.36 The higher the value of EHOMO is, the more easily the inhibitors can donate electrons to vacant orbital of the metal and form a coordination bond; the lower the value of ELUMO is, the more easily the compound can accept electrons and form the feedback bond.68 Efficient corrosion inhibitors are usually organic compounds that can perform these two roles.The electron densities of HOMO and LUMO in HASI are mainly located in the imidazoline ring, particularly in the N![[double bond, length as m-dash]](https://www.rsc.org/images/entities/char_e001.gif) C–N region, revealing that the compound can be absorbed easily on the sample surface through sharing electrons with iron. Our previous studies have illustrated that this compound is easy to be adsorbed on the oxides, reducing their structural defects and inhibiting the corrosion of steel rebar caused by chloride ions.23,24 The electron densities of HOMO and LUMO in AA molecules are mainly distributed in the pentabasic ring especially in the C
C–N region, revealing that the compound can be absorbed easily on the sample surface through sharing electrons with iron. Our previous studies have illustrated that this compound is easy to be adsorbed on the oxides, reducing their structural defects and inhibiting the corrosion of steel rebar caused by chloride ions.23,24 The electron densities of HOMO and LUMO in AA molecules are mainly distributed in the pentabasic ring especially in the C![[double bond, length as m-dash]](https://www.rsc.org/images/entities/char_e001.gif) C location, indicating these parts deserve strong nucleophilic properties and are preferred active adsorption sites, which can provide electrons to the d-orbital of Fe and form coordination bond. At the same time, AA molecules can also receive electrons from Fe and form anti-bond to enhance molecular adsorption on the metal surface. Previous studies have also illustrated that this compound can react with iron and form a complex film to protect it from corrosion.16 The HOMO of SDBS is mostly located at the position of sulfonic groups, revealing that sulfur is the chief atom that donates electrons. LUMO is mostly in sodium, indicating its high ionic characteristics. Similarly, HOMO of SDP is mainly distributed in the O atom, suggesting that electrons will be mainly provided by oxygen. Sodium also exhibits ionic properties.
C location, indicating these parts deserve strong nucleophilic properties and are preferred active adsorption sites, which can provide electrons to the d-orbital of Fe and form coordination bond. At the same time, AA molecules can also receive electrons from Fe and form anti-bond to enhance molecular adsorption on the metal surface. Previous studies have also illustrated that this compound can react with iron and form a complex film to protect it from corrosion.16 The HOMO of SDBS is mostly located at the position of sulfonic groups, revealing that sulfur is the chief atom that donates electrons. LUMO is mostly in sodium, indicating its high ionic characteristics. Similarly, HOMO of SDP is mainly distributed in the O atom, suggesting that electrons will be mainly provided by oxygen. Sodium also exhibits ionic properties.
Absolute hardness (η) denotes the resistance of an atom to a charge transfer.80 It is often employed as an index of relative reactivity or stability of a compound. Since hardness is related to the energy gap between HOMO and LUMO, an inhibitor with the lower value of hardness is more possible to form a bond–anti-bond structure by offering and accepting electrons with metals and is expected to have high inhibitive efficiency.81 However, due to the different adsorption mechanisms of different compounds, η does not correlate with the inhibitive efficiency in many studies.35,73 Meanwhile, the values of electronegativity (χ) are always in good agreement with the inhibitive efficiency and it is expected that a low value of χ will inform high inhibitive performance.46 It is believed that χ reflects the ability of atoms to attract electrons, which can be used to measure the tendency of a molecule to retain its own electrons during donor–acceptor interactions that lead to corrosion inhibition.82 From Table 5, the values of χ for AA, SDBS and SDP are all high, which suggest their inhibitive activities may be very poor. However, their inhibitive performances are excellent based on the previous studies.16,26,27,53,83 Actually, in the alkaline solution, AA will be deprotonated while SDBS and SDP will be ionized. Then by calculation of the anions, it can be observed that deprotonated AA, dihydrogen phosphate anion and dodecyl benzene sulfonate anion all deserve low electronegativity values, indicating they are prone to donate electrons to Fe and exert good corrosion inhibitive performances.
Moreover, it should be noted that the fraction electron transfer number (ΔN) has positive value for all these compounds, indicating electrons transfer from the inhibitors to the metal surface in total.58 The values of ΔN are all less than 3.6, which suggest that the inhibitive efficiency will increase with increasing electron-donating ability of the inhibitors to the metal surface.81,82
Based on HSAB theory, inhibitor and metal act as Lewis base and Lewis acid, which follows soft–soft and hard–hard principle. In the Cl–Fe–H2O system, there are different Lewis acids on the metal surface: the bare iron belongs to soft acid; metal ions produced in the corrosion process are hard acids.66 AA has the lowest HOMO, which is deprotonated to be an anion in the alkaline solution, so that it can be classified as hard base. It is easy for AA to form a stable complex film by coordination with Fe3+ or Fe2+ ions and inhibit pitting generation. The phosphate anion and dodecyl benzene sulfonate anion also have low HOMO and are hard bases, which also can form a complex film with Fe3+ or Fe2+ ions and enhance the inhibitive effect. It is reported that phosphate is also a strong catalyzer and can promote the formation of oxide film.53 HASI belongs to soft base, which can protect the steel rebar mainly by its adsorption on the metal surface. Previous researches also indicate it can interact with the iron oxide surface and decrease the damage of the surface film induced by chloride ion. Thus, the four compounds applied in combination can effectively inhibit the corrosion of steel rebar in alkaline environment in the presence of chloride ions.
4. Corrosion inhibitive mechanism
Above all, the corrosion inhibitive effects of WKI on steel rebar can be explained by the point defect model (PDM) proposed by Macdonald in Fig. 9.52,68,84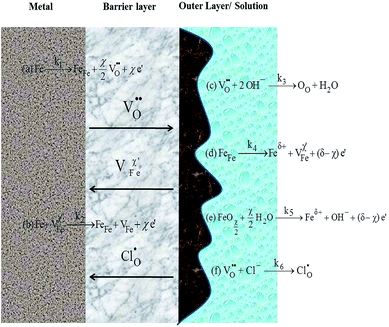 | ||
| Fig. 9 Sandwich structure of the surface film on the steel rebar sample and Point Defect Model proposed by Macdonald. | ||
From Fig. 9, the interfacial reaction of metal surface consists of two processes in absence of chloride ions: (i) the defect reactions (a) and (c) occur, namely, iron gives up electrons to form ferrous or ferric ions and oxygen vacancies are generated in the metal/barrier interface; at the same time, oxygen vacancies associate with hydroxyl ions and oxygen atoms occupy the oxygen vacancies in the spinel structure. The total result of such processes is the formation of a new oxide film. (ii) Reactions (b), (d) and (e) may also occur, leading to the dissolution of metals (reaction (d)) or oxides (reaction (e)). Processes (i) and (ii) compete with each other, and whether the surface film is formed or dissolved is depended on which one is dominated.85 Normally, the formation of passive film takes advantage at the initial stage of immersion. About 2 d later, the two processes begin to reach a balance, and the surface film on the metal is formed completely.
When chloride ions are present, reaction (f) occurs, chloride ions occupy the oxygen vacancies in the crystal and penetrated into the inner layer via the defects. However, lattice distortion is induced due to the unbalance charge of, thus, the defect concentration is increased significantly in the surface structure; meanwhile, the dissolution of iron (reaction (d)) is accelerated due to the soluble property of chlorides, leading to the increase of corrosion rate.69,71
More importantly, ascribed to the consumption of the oxygen vacancies by reaction (f), reaction (c) is suppressed on account of its competition with reaction (f). Thus, the growth rate of oxide layer is slowed down and the passive film is dissolved from the macro view.
Based on gravimetric tests, electrochemical experiments and surface analysis results, it is found that the passive film on the sample surface is more complete, the impedance is greater, and the concentration of the defects in the film is lower after addition of WKI. These results indicate that WKI can promote the formation and stability of the surface film on steel rebar. According to the quantum chemical calculations results, the compounds can interact with the metal surface by an electron-donating effect. AA, deprotonated to be an anion in the alkaline solution and performed as hard base, can form a stable complex film by coordination with Fe3+ or Fe2+ ions and inhibit pitting generation. The phosphate anion and dodecyl benzene sulfonate anion deserve the similar activities and enhance the corrosion inhibition effects. HASI, as a soft base, can mitigate the adsorption and penetration of chloride ions by interaction with the metal surface via sharing its unshared electron pairs and p electrons of the aromatic ring with the vacant d-orbital of iron. Thus, the corrosion inhibitive mechanism of WKI can be speculated: WKI promotes reaction (c) progresses, namely, it leads to the growth and stability of the passive film; in addition, WKI can be adsorbed on the metal surface and suppress the adsorption of chloride ions; moreover, WKI can react with the iron ions generated by reaction (d) and (e) and form insoluble complexes which cover the sample surface and restrain the adsorption of chloride ions on the surface or their penetration in the passive layer. Thereby, steel rebar corrosion caused by chloride ions is inhibited.
5. Conclusions
(1) As an environmental-friendly rebar inhibitors formula, WKI can effectively inhibit the corrosion of steel rebar: in the blank solution, local corrosion occurred on the steel rebar samples after 3 d immersion while the passive films on the samples in the solution with WKI were all complete even after 7 d, indicating WKI can promote the formation and stability of the passive film and effectively inhibit the steel rebar corrosion.(2) The electrochemical experiments exhibit that addition of WKI leads to a positive shift of the corrosion potential and the increase of both the charge transfer resistance and the total resistance, subsequently the steel rebar corrosion initial time is delayed and its anti-corrosion properties are increased.
(3) The inhibitive effects of WKI on the corrosion of steel rebar should be attributed to that the compositions of WKI include soft Lewis bases and hard Lewis bases, large molecules and small anions, which can act as a type of multifunctional corrosion inhibitors. WKI can be adsorbed on both the bare iron surface and the oxide film, which suppresses the chloride ions adsorption process on the steel surface. WKI can improve the surface state of the steel rebar and promote the formation and stability of the surface film, which reduces the concentration of defects in the barrier layer and mitigates the penetration of chloride ions in the metal surface. Thereby, WKI inhibits the steel rebar corrosion induced by chloride ions.
Conflicts of interest
There are no conflicts to declare.Acknowledgements
The authors gratefully acknowledge the financial support from a Project of Shandong Province Higher Educational Science and Technology Program (No. J15LA62), the Distinguished Middle-Aged and Young Scientist Encourage and Reward Foundation of Shandong Province (No. ZR2016HB24) as well as the Doctoral Fund Project of Weifang University of Science and Technology (No. 2017BS06).References
- F. Tang, G. Chen, J. S. Volz, R. K. Brow and M. L. Koenigstein, Cem. Concr. Compos., 2013, 35, 171–180 CrossRef CAS.
- L. Yohai, M. B. Valcarce and M. Vázquez, Electrochim. Acta, 2016, 202, 316–324 CrossRef CAS.
- L. Yohai, W. Schreiner, M. Vázquez and M. B. Valcarce, Electrochim. Acta, 2016, 202, 231–242 CrossRef CAS.
- F. Fei, J. Hu, J. Wei, Q. Yu and Z. Chen, Constr. Build. Mater., 2014, 70, 43–53 CrossRef.
- P. Faustino, A. Brás and T. Ripper, Constr. Build. Mater., 2014, 53, 360–369 CrossRef.
- J. G. Li and B. Cao, China Surf. Eng., 2004, 68, 5–10 Search PubMed.
- T. A. Söylev and M. G. Richardson, Constr. Build. Mater., 2008, 22, 609–622 CrossRef.
- J. P. Hwang, M. S. Jung, M. Kim and K. Y. Ann, Constr. Build. Mater., 2015, 101, 239–245 CrossRef.
- S. J. Jaffer and C. M. Hansson, Cem. Concr. Res., 2009, 39, 116–125 CrossRef CAS.
- F. Farcas, T. Chaussadent, C. Fiaud and I. Mabille, Anal. Chim. Acta, 2002, 472, 37–43 CrossRef CAS.
- Z. H. Dong, W. Shi, G. A. Zhang and X. P. Guo, Electrochim. Acta, 2011, 56, 5890–5897 CrossRef CAS.
- S. A. Asipita, M. Ismail, M. Z. A. Majid, Z. A. Majid, C. Abdullah and J. Mirza, J. Cleaner Prod., 2014, 67, 139–146 CrossRef CAS.
- M. M. Mennucci, E. P. Banczek, P. R. P. Rodrigues and I. Costa, Cem. Concr. Compos., 2009, 31, 418–424 CrossRef CAS.
- S. M. Abd El Haleem, S. Abd El Wanees and A. Bahgat, Corros. Sci., 2014, 87, 321–333 CrossRef CAS.
- M. V. Diamanti, E. A. Pérez Rosales, G. Raffaini, F. Ganazzoli, A. Brenna, M. Pedeferri and M. Ormellese, Corros. Sci., 2015, 100, 231–241 CrossRef CAS.
- L. Valek, S. Martinez, D. Mikulić and I. Brnardić, Corros. Sci., 2008, 50, 2705–2709 CrossRef CAS.
- X. Zhou, H. Yang and F. Wang, Corros. Sci., 2012, 54, 193–200 CrossRef CAS.
- M. Yamaguchi, H. Nishihara and K. Aramaki, Corros. Sci., 1995, 37, 571–585 CrossRef CAS.
- Y. Su, W. Zong, X. Zhao, S. Ma and X. Han, RSC Adv., 2015, 5, 82247–82251 RSC.
- M. Criado, C. Monticelli, S. Fajardo, D. Gelli, V. Grassi and J. M. Bastidas, Constr. Build. Mater., 2012, 35, 30–37 CrossRef.
- L. Zheng and H. Yang, Acta Phys.–Chim. Sin., 2010, 26, 2354–2360 CAS.
- X. Zhou, H. Yang and F. Wang, Electrochim. Acta, 2011, 56, 4268–4275 CrossRef CAS.
- L. Feng, H. Yang and F. Wang, Electrochim. Acta, 2011, 58, 427–436 CrossRef CAS.
- H. Y. Lijuan Feng and F. Wang, Int. J. Electrochem. Sci., 2012, 7, 4064–4077 Search PubMed.
- L. Feng, K. Zhao, H. Yang, N. Tang, F. Wang and T. Shangguan, J. Chin. Soc. Corros. Prot., 2015, 35, 297–304 CAS.
- L. Feng, K. Zhao, N. Tang, H. Yang, F. Wang and T. Shangguan, J. Chin. Soc. Corros. Prot., 2013, 33, 441–448 CAS.
- L. Feng, H. Yang and F. Wang, Acta Chim. Sin., 2011, 69, 2359–2367 CAS.
- W. Durnie, R. De Marco, B. Kinsella, A. Jefferson and B. Pejcic, J. Electrochem. Soc., 2005, 152, B1–B11 CrossRef CAS.
- G. Meng, Y. Li and F. Wang, Electrochim. Acta, 2006, 51, 4277–4284 CrossRef CAS.
- X. Wang, H. Yang and F. Wang, Corros. Sci., 2011, 53, 113–121 CrossRef CAS.
- I. Milošev, N. Kovačević, J. Kovač and A. Kokalj, Corros. Sci., 2015, 98, 107–118 CrossRef.
- I. Ahamad, R. Prasad and M. A. Quraishi, Corros. Sci., 2010, 52, 933–942 CrossRef CAS.
- R. Hasanov, S. Bilge, S. Bilgiç, G. Gece and Z. Kılıç, Corros. Sci., 2010, 52, 984–990 CrossRef CAS.
- D. K. Yadav, D. S. Chauhan, I. Ahamad and M. A. Quraishi, RSC Adv., 2013, 3, 632–646 RSC.
- C. Verma, M. A. Quraishi, L. O. Olasunkanmi and E. E. Ebenso, RSC Adv., 2015, 5, 85417–85430 RSC.
- A. Ehsani, M. G. Mahjani, R. Moshrefi, H. Mostaanzadeh and J. S. Shayeh, RSC Adv., 2014, 4, 20031–20037 RSC.
- R. K. Gupta, M. Malviya, C. Verma, N. K. Gupta and M. A. Quraishi, RSC Adv., 2017, 7, 39063–39074 RSC.
- S. Kaya, P. Banerjee, S. K. Saha, B. Tüzün and C. Kaya, RSC Adv., 2016, 6, 74550–74559 RSC.
- M. Finšgar, A. Lesar, A. Kokalj and I. Milošev, Electrochim. Acta, 2008, 53, 8287–8297 CrossRef.
- N. Kovačević, I. Milošev and A. Kokalj, Corros. Sci., 2015, 98, 457–470 CrossRef.
- A. Kokalj, Electrochim. Acta, 2010, 56, 745–755 CrossRef CAS.
- J. P. Perdew and Y. Wang, Phys. Rev. B, 1992, 45, 13244–13249 CrossRef.
- J. P. Perdew, J. A. Chevary, S. H. Vosko, K. A. Jackson, M. R. Pederson, D. J. Singh and C. Fiolhais, Phys. Rev. B, 1992, 46, 6671–6687 CrossRef CAS.
- B. Delley, J. Chem. Phys., 1990, 92, 508–517 CrossRef CAS.
- B. Delley, J. Phys.: Condens. Matter, 2010, 22, 384208 CrossRef CAS PubMed.
- M. A. Migahed, E. G. Zaki and M. M. Shaban, RSC Adv., 2016, 6, 71384–71396 RSC.
- Y. Zhou, L. Guo, S. Zhang, S. Kaya, X. Luo and B. Xiang, RSC Adv., 2017, 7, 23961–23969 RSC.
- M. Bello, N. Ochoa, V. Balsamo, F. López-Carrasquero, S. Coll, A. Monsalve and G. González, Carbohydr. Polym., 2010, 82, 561–568 CrossRef CAS.
- A. S. Fouda, M. A. Ismail, A. S. Abousalem and G. Y. Elewady, RSC Adv., 2017, 7, 46414–46430 RSC.
- M. Mobin, S. Zehra and R. Aslam, RSC Adv., 2016, 6, 5890–5902 RSC.
- A. Espinoza-Vázquez and F. J. Rodríguez-Gómez, RSC Adv., 2016, 6, 70226–70236 RSC.
- M. Sánchez, J. Gregori, M. C. Alonso, J. J. García-Jareño and F. Vicente, Electrochim. Acta, 2006, 52, 47–53 CrossRef.
- N. Etteyeb, L. Dhouibi, H. Takenouti, M. C. Alonso and E. Triki, Electrochim. Acta, 2007, 52, 7506–7512 CrossRef CAS.
- A. Sun, J. Franc and D. D. Macdonald, J. Electrochem. Soc., 2006, 153, B260–B277 CrossRef CAS.
- W. Chen, R. Du, C. Ye, Y. Zhu and C. Lin, Electrochim. Acta, 2010, 55, 5677–5682 CrossRef CAS.
- Y. Zhou, J. Xiong and F. Yan, Surf. Coat. Technol., 2017, 328, 335–343 CrossRef CAS.
- K. Wan, P. Feng, B. Hou and Y. Li, RSC Adv., 2016, 6, 77515–77524 RSC.
- M. Sánchez, J. Gregori, C. Alonso, J. J. García-Jareño, H. Takenouti and F. Vicente, Electrochim. Acta, 2007, 52, 7634–7641 CrossRef.
- J. Zhang, Y. Liang, Q. Zhou, Y. Peng and H. Yang, J. Power Sources, 2015, 290, 71–79 CrossRef CAS.
- X. Zhou, R. Chen, G. Wu and F. Wang, Corros. Sci. Prot. Technol., 2017, 29, 173–177 Search PubMed.
- F. Cao, J. Wei, J. Dong and W. Ke, Corros. Sci., 2015, 100, 365–376 CrossRef CAS.
- H. Zarrok, A. Zarrouk, B. Hammouti, R. Salghi, C. Jama and F. Bentiss, Corros. Sci., 2012, 64, 243–252 CrossRef CAS.
- S. Dong, B. Zhao, C. Lin, R. Du, R. Hu and G. X. Zhang, Constr. Build. Mater., 2012, 28, 72–78 CrossRef.
- L. O. Olasunkanmi, I. B. Obot and E. E. Ebenso, RSC Adv., 2016, 6, 86782–86797 RSC.
- D. Dwivedi, K. Lepková and T. Becker, RSC Adv., 2017, 7, 4580–4610 RSC.
- Y. Gao, J. Chen, L. Lei, H. Yang and Y. Zhu, Corros. Sci. Prot. Technol., 2000, 12, 319–322 CAS.
- Y. Gao, J. Chen, L. lei, H. Yang, D. Cao and W. Wu, J. Chin. Soc. Corros. Prot., 2000, 20, 142–148 CAS.
- E. Sikora and D. D. Macdonald, J. Electrochem. Soc., 2000, 147, 4087–4092 CrossRef CAS.
- V. Horvat-Radosevic and K. Kvastek, Electrochim. Acta, 1997, 42, 1403–1419 CrossRef CAS.
- P. Marcus, V. Maurice and H. H. Strehblow, Corros. Sci., 2008, 50, 2698–2704 CrossRef CAS.
- S. Ahn, H. Kwon and D. D. Macdonald, J. Electrochem. Soc., 2005, 152, B482–B490 CrossRef.
- B. Díaz, S. Joiret, M. Keddam, X. R. Nóvoa, M. C. Pérez and H. Takenouti, Electrochim. Acta, 2004, 49, 3039–3048 CrossRef.
- S. Martinez, L. Valek and I. S. Oslaković, J. Electrochem. Soc., 2007, 154, C671–C677 CrossRef CAS.
- B. Ramaganthan, M. Gopiraman, L. O. Olasunkanmi, M. M. Kabanda, S. Yesudass, I. Bahadur, A. S. Adekunle, I. B. Obot and E. E. Ebenso, RSC Adv., 2015, 5, 76675–76688 RSC.
- L. Guo, C. Qi, X. Zheng, R. Zhang, X. Shen and S. Kaya, RSC Adv., 2017, 7, 29042–29050 RSC.
- L. C. Murulana, M. M. Kabanda and E. E. Ebenso, RSC Adv., 2015, 5, 28743–28761 RSC.
- M. A. Migahed, M. M. Shaban, A. A. Fadda, T. A. Ali and N. A. Negm, RSC Adv., 2015, 5, 104480–104492 RSC.
- N. Kovačević and A. Kokalj, J. Phys. Chem. C, 2011, 115, 24189–24197 Search PubMed.
- A. Kokalj, Chem. Phys., 2012, 393, 1–12 CrossRef CAS.
- H. M. Abd El-Lateef and A. H. Tantawy, RSC Adv., 2016, 6, 8681–8700 RSC.
- M. Parveen, M. Mobin and S. Zehra, RSC Adv., 2016, 6, 61235–61248 RSC.
- C. Verma, L. O. Olasunkanmi, I. B. Obot, E. E. Ebenso and M. A. Quraishi, RSC Adv., 2016, 6, 53933–53948 RSC.
- D. M. Bastidas, M. Criado, V. M. La Iglesia, S. Fajardo, A. La Iglesia and J. M. Bastidas, Cem. Concr. Compos., 2013, 43, 31–38 CrossRef CAS.
- J. Liu and D. D. Macdonald, J. Electrochem. Soc., 2001, 148, B425–B430 CrossRef CAS.
- S. M. Abd El Haleem, S. Abd El Wanees, E. E. Abd El Aal and A. Diab, Corros. Sci., 2010, 52, 292–302 CrossRef CAS.
Footnote |
| † These authors are joint first authors |
| This journal is © The Royal Society of Chemistry 2018 |

