 Open Access Article
Creative Commons Attribution 3.0 Unported Licence
Structure, luminescence and temperature sensing in rare earth doped glass ceramics containing NaY(WO4)2 nanocrystals
Zeshang Zou,
Ting Wu,
Hao Lu,
Yuyuan Tu,
Shilong Zhao *,
Shichao Xie,
Fang Han and
Shiqing Xu
College of Materials Science and Engineering, China Jiliang University, Hangzhou 310018, P. R. China. E-mail: Shilong_zhao@hotmail.com; sxucjlu@hotmail.com
First published on 19th February 2018
Abstract
Novel rare earth doped glass ceramics containing NaY(WO4)2 nanocrystals were fabricated for the first time. The appearance of sharp diffraction peaks and well-resolved lattice fringes certifies the precipitation of NaY(WO4)2 nanocrystals with high crystallinity. After the crystallization process, significant changes in the photoluminescence emission spectra and fluorescence lifetime of Sm3+ ions are observed, which are ascribable to the enrichment of Sm3+ ions in the highly disordered NaY(WO4)2 nanocrystals. Under 980 nm excitation, characteristic green and red upconversion emission signals were detected and the enhanced upconversion luminescence of Er3+ ions in the glass ceramics was attributable to the incorporation into the low energy phonon NaY(WO4)2 nanocrystals. Based on the dependence of upconversion intensity on the excitation power, the upconversion mechanism of Er3+–Yb3+ ions was proposed. The temperature-dependent fluorescence intensity ratio (FIR) of the thermally-coupled 2H11/2 and 4S3/2 energy levels was determined at a low power density of 0.4125 W cm−2. The maximum temperature sensitivity is 146 × 10−4 K−1 at 523 K, which is mainly attributed to the highly disordered structure of NaY(WO4)2 nanocrystals and exhibits promising potential for optical temperature sensors.
Introduction
In recent years, upconversion luminescence of active ions has attracted wide interest owing to its promising applications in bioimaging, solar cells, white LEDs and temperature sensing.1–4 Especially, temperature sensors based on the FIR technique have garnered great attention due to their negligible electromagnetic interference, simple data processing and high sensitivity.4–7 Currently, the research of high-performance temperature sensors mainly focuses on the optimization of active ions and host matrix. Er3+ ion is the most extensively investigated because of its intense upconversion luminescence and appropriate bandgap (around 800 cm−1) between 2H11/2 and 4S3/2 energy levels, which exactly fall in the thermally-coupled energy range (200–2000 cm−1).8 In order to obtain stronger upconversion luminescence, Yb3+ is usually utilized as the preferred sensitizer for Er3+ due to its high absorption cross-section at 980 nm and efficient Yb3+ → Er3+ energy transfer efficiency.9 It is well known that the phonon energy and crystal structure of host matrix have an important role on the upconversion luminescence efficiency. A low phonon energy is very beneficial to enhance the upconversion efficiency of activators as a result of the reduction in the multi-phonon relaxation rate.10 Hexagonal NaYF4 is regarded as the most efficient upconversion host matrix due to its low phonon energy and multisite characteristic.11 The temperature sensing performance of Er3+ ions in hexagonal NaYF4 was studied and the maximum temperature sensitivity was 37 × 10−4 K−1 at 508 K.12 By now, various host materials have been investigated for optical thermometry, however, the influence of crystal structure on the temperature sensitivity is rarely investigated.13 Recently, three Judd–Ofelt parameters14,15 of Er3+ ions were calculated and used to analyze the role of host matrix from oxyfluoride glass to cubic NaYF4 glass ceramic on the temperature sensitivity. It was found that the maximum temperature sensitivity of Er3+ ions in the precursor glass (66 × 10−4 K−1 at 570 K) is twice more than the value in the cubic NaYF4 glass ceramic (24 × 10−4 K−1 at 540 K). Based on the structural change during the temperature-induced crystallization process, it is concluded that the more disordered the local environment of active ions, the better FIR and temperature sensing sensitivity. Thus, oxide glass is regarded as an ideal host matrix doped with Er3+ ions for optical thermometry due to its highly disordered local symmetry surroundings.16 Unfortunately, a low upconversion efficiency of active ions can only be obtained in oxide glasses due to their high phonon energy.Rare earth doped double tungstate/molybdate phosphors have been extensively investigated due to their structural versatility, good thermal stability and low phonon energy. Recently, intense green upconversion luminescence was observed in the Er3+/Yb3+ codoped NaY(WO4)2 phosphors and its temperature sensing behaviour was analysed by the FIR technique.17 A maximum temperature sensing sensitivity about 112 × 10−4 K−1 was obtained at 515 K, which was about three times larger than that in the NaYF4 nanocrystals12 and exhibited promising potential for application on optical thermometry. Moreover, in order to assemble a practical optical fiber temperature sensing probe, the phosphor is usually adhered to the end face of optical fiber by organic resin (epoxy resin or silicone). Therefore, the operating temperature range, long-term reliability and lifetime of optical fiber temperature sensor are reduced dramatically. Glass can be easily drawn into glass fiber and conveniently spliced to standard silica fiber. The combination of oxide glass and tungstate/molybdate phosphor is expected to improve the performance of temperature sensors. Therefore, the key problem is to develop an appropriate glass composition, in which tungstate/molybdate nanocrystals could be successfully separated from the precursor glass and intense upconversion emission could be achieved.
Here, transparent glass ceramics containing NaY(WO4)2 nanocrystals have been successfully prepared by the optimization of glass composition and thermal treatment condition. Sm3+ ion usually acts as a spectroscopic probe to distinguish the local site symmetry around active ions in the host matrix. The spectral analysis of Sm3+ ions in the precursor glass and glass ceramics containing NaY(WO4)2 nanocrystals has been carried out and used to estimate their potential performance for optical temperature sensing. Successively, the temperature dependent upconversion emission spectra in Er3+/Yb3+ codoped glass and glass ceramics were systematically investigated. According to FIR technique, the influence of host matrix on the temperature sensitivity was discussed in details.
Experimental
Sample preparation
The glass samples were fabricated with molar composition of 62SiO2–16B2O3–11Na2O–7ZnO–3WO3–0.9Y2O3–0.1Sm2O3 and 62SiO2–16B2O3–11Na2O–7ZnO–3WO3–0.75Y2O3–0.05Er2O3–0.2 Yb2O3. Firstly, high purity raw materials SiO2, H3BO3, Na2CO3, ZnO, WO3, Y2O3, Sm2O3, Er2O3 and Yb2O3 were weighed accurately and mixed thoroughly. Then, the well-mixed raw materials were put into a covered Al2O3 crucible and were transferred to an electric furnace preheated to 1500 °C for about 30 min. Finally, the glass melt was quenched into a cold stainless-steel plate and rapidly transferred to a pre-heated muffle furnace. Transparent precursor glasses (PG) were obtained. PG samples were cut into small pieces and heat-treated at 610 °C, 630 °C and 650 °C for 2 h, respectively. The obtained glass ceramics were named as GC-610, GC-630 and GC-650, respectively. All the samples were polished for further characterization. The final thickness of PG and glass ceramics is 1.5 mm.Characterization
The crystallized phase before and after thermal treatment was identified via X-ray diffraction (XRD) measurement (Bruker D2 PHASER Diffractometer), with Cu-Kα radiation in 2θ range from 10° to 80° with a step length 0.02°. The microstructure of GC-650 was examined on a transmission electron microscope (TEM, Philips-FEI-Tecnai G2 F30). Excitation and emission spectra of Sm3+ ions at room temperature were recorded on a fluorescence spectrophotometer equipped with a Hamamatsu R928 photomultiplier tube (Horiba J-Y Fluorolog-3). 450 W xenon lamp was used as the light source. The luminescence decay curves of 4G5/2 levels of Sm3+ ions were recorded on the above apparatus excited at 370 nm. Upconversion luminescence Er3+/Yb3+ co-doped samples were also performed on the same spectrophotometer and a 980 nm laser diode module (MDL-III-980, China) was used to excite the samples. The output spot size of 980 nm laser was 4 × 6 mm2. In order to study the temperature-dependent upconversion luminescence of Er3+, the temperature controller (TAP-02) was used to heat the sample from 298 to 573 K and its temperature accuracy is 0.1 K.Results and discussion
Microstructure analysis
The XRD profiles of PG and glass ceramics are presented in Fig. 1(a). In the PG, no obvious diffraction peaks are detected in the range of 10–80°, indicative of the amorphous feature of glass matrix. When the samples were thermal-treated at 610, 630 and 650 °C for 2 h, intense diffraction peaks are observed and easily assigned to pure tetragonal NaY(WO4)2 (JCPDS No 48-0886). The full width at half-maximum (FWHM) of diffraction peaks becomes narrower with the increase of thermal treatment temperature, indicating the gradual growth of NaY(WO4)2 phase. The average crystalline size of NaY(WO4)2 nanocrystals could be calculated based on the Scherrer formula,18
 | (1) |
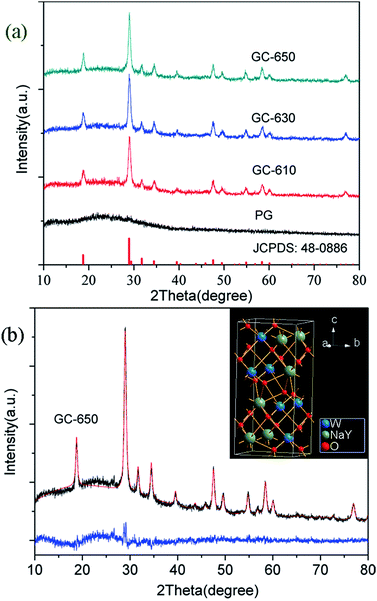 | ||
| Fig. 1 (a) XRD profiles of PG and glass ceramics; (b) Rietveld XRD refinement of GC-650, the inset shows the crystal structure of NaY(WO4)2. | ||
The Rietveld XRD refinement of GC-650 was carried out by using TOPAS software. The initial structural models was NaY0.95Yb0.05(WO4)2.19 Fig. 1(b) show the observed and calculated diffraction peaks as well as the difference of GC-650, which are nearly identical and suggests that GC-650 has a pure tetragonal phase. The fitting reliability parameters of Rexp, Rwp, Rp, and GOF are 3.94, 5.90, 4.82 and 1.5, respectively. The inset of Fig. 1(b) represents the crystal structure of NaY(WO4)2 drawn by Diamond software. The crystal has a high structural disorder. Especially, Na and Y occupy the same sites in the structure randomly and link with eight oxygen atoms, forming NaO8 and YO8 edge-sharing polyhedral with S4 site symmetry, while W6+ ions are coordinated with four oxygen atoms.20
Fig. 2(a) gives the dark field TEM image of NaY(WO4)2 nanocrystals in the GC-650. One can observe plenty of dark and nearly spherical nanoparticles, corresponding to the precipitated NaY(WO4)2 nanocrystals, while the grey background is amorphous glass phase. The HRTEM image of an individual NaY(WO4)2 nanocrystal shows the well-resolved lattice fringes, which suggests that the precipitated NaY(WO4)2 nanocrystal possess high crystallinity. The measured interplanar distance is 0.309 nm, which can be well-indexed as the d-spacing value of (112) crystal plane of NaY(WO4)2 crystal (d(112) = 0.308 nm). The crystalline size of NaY(WO4)2 is around 25 nm with a narrow size distribution, which is slightly larger than the value (20.9 nm) calculated from XRD data. The same phenomenon was reported in the PbF2 glass ceramics, which was due to the broadening of diffraction peaks and suggested the presence of disorder of the precipitated nanocrystals.21
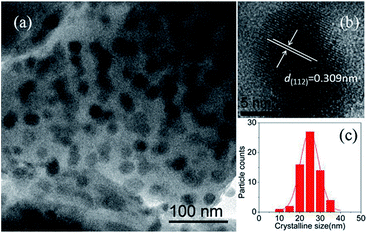 | ||
| Fig. 2 (a) TEM image of NaY(WO4)2 nanocrystals in the GC-650; (b) HRTEM micrograph of an individual NaY(WO4)2 nanocrystal; (c) crystalline size distribution of NaY(WO4)2 nanocrystals in the GC-650. | ||
Photoluminescence and decay lifetimes of Sm3+ ions
Fig. 3 shows the photoluminescence spectra of Sm3+ ions in the glass samples before and after thermal treatment. The excitation wavelength is 404 nm. Some strong emission bands at around 566, 602, 648 and 706 nm are observed, which correspond to the transitions from 4G5/2 energy level to 6H5/2, 6H7/2, 6H9/2 and 6H11/2 energy levels of Sm3+ ions, respectively.22 The whole emission intensity of Sm3+ ions after thermal treatment is greatly enhanced with the increase of thermal treatment temperature and obvious Stark splitting appear at 602 nm, which is attributed to the segregation of Sm3+ ions into the low phonon energy NaY(WO4)2 nanocrystals by occupying the sites of Y3+ ions.23 It is notable that the strongest photoluminescence emission band in the PG originates from 4G5/2 → 6H7/2 transition at 602 nm, while the strongest photoluminescence emission band in the GC-650 becomes 4G5/2 → 6H9/2 transition at 648 nm, which is completely on the contrary to the luminescent behaviour of Sm3+ ions in YF3 glass ceramics.24 Sm3+ ions are very sensitive to the subtle change of external environment and acts as a spectroscopic probe to investigate the local site symmetry around active ions in the host matrix. According to the selection rules of electronic transitions,25 4G5/2 → 6H5/2 transition belongs to magnetic dipole transition due to ΔJ = 0, which is nearly independent of the local environmental change around Sm3+ ions, while 4G5/2 → 6H9/2 transition is electric transition because of ΔJ = 2 and which is highly sensitive to external environmental change. In general, the intensity ratio β between 4G5/2 → 6H9/2 and 4G5/2 → 6H5/2 transitions is used to evaluate the local site symmetry around Sm3+ ions. When Sm3+ ions are situated in the surroundings close to inversion symmetry, 4G5/2 → 6H5/2 will be stronger, while in the surroundings far away from inversion symmetry, the 4G5/2 → 6H9/2 will be predominant. The calculated β values in the PG, GC-610, GC-630 and GC-650 are 1.25, 1.76, 1.98 and 2.18, respectively. The gradual increase of β value demonstrates that Sm3+ ions are far away from inversion symmetry and enter into a more disordered surrounding after thermal treatment process, which favours the strengthening of photoluminescence intensity for the hypersensitive transitions and is very beneficial to enhance the temperature sensing sensitivity.26,27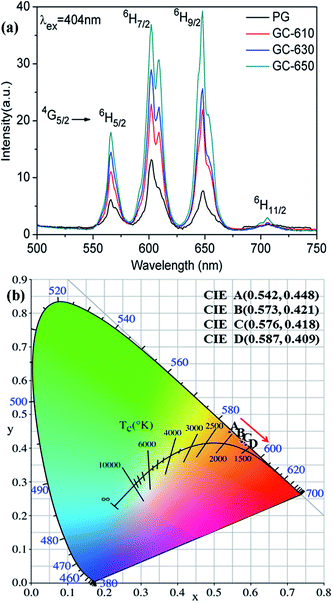 | ||
| Fig. 3 (a) Photoluminescence spectra of Sm3+ ions (excited at 404 nm); (b) CIE coordinates of Sm3+ doped PG, GC-610, 6C-630 and GC-650, which are labelled as A, B, C, and D, respectively. | ||
Due to the relative photoluminescence intensity of Sm3+ ions change greatly after thermal treatment, the Commission Internationale de I'Eclairage (CIE) chromaticity coordinates were calculated in order to evaluate the colorimetric performance calculated from the emission spectra. The calculated chromaticity coordinates were A (0.542, 0.448), B (0.573, 0.421), C (0.576, 0.418) and D (0.587, 0.409) for the PG, GC-610, GC-630 and GC-650, respectively, which were labelled in the Fig. 3(b). It is found that the colour changes from yellow orange to reddish orange after thermal treatment, which indicates that glass ceramic doped Sm3+ ions could be served as alternative red phosphors in the white LED application.
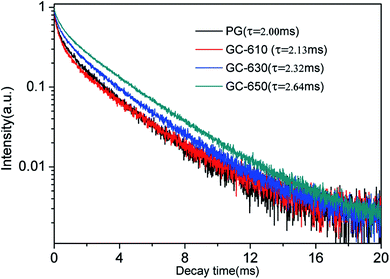
The luminescence decay curves of Sm3+ ions in different samples are investigated and presented in the Fig. 4. The excitation wavelength is 370 m and the emission wavelength is 602 nm. All the decay curves are well described with a two-exponential equation,28
 | (2) |
 | (3) |
The fitting average fluorescence lifetime of Sm3+ ions are 2.00, 2.13, 2.32 and 2.64 ms for PG, GC-610, GC-630 and GC-650, respectively. The gradual increase of fluorescence lifetime of Sm3+ ions in the glass ceramics can be ascribed to that much more Sm3+ ions partition into the low phonon energy NaY(WO4)2 nanocrystals and the non-radiative transition rate of Sm3+ ions reduces.
Upconversion luminescence and mechanism of Er3+ ions
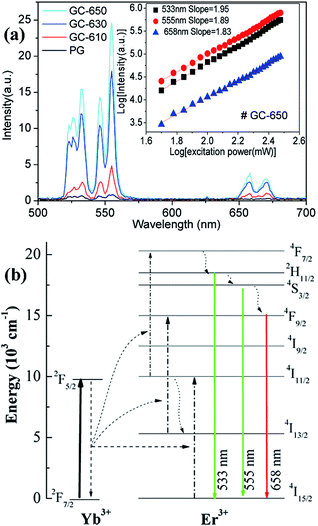
Fig. 5(a) shows the upconversion emission spectra of Er3+/Yb3+ ions in different samples at room temperature. The excitation wavelength is 980 nm and its excitation power is 99 mW. Thus, the power density is 0.4125 W cm−2, which is enough low and the heating effect caused by 980 nm excitation may be ignored.29 Strong green upconversion emission as well as weak red upconversion emission are recorded, which are originated from the 2H11/2 → 4I15/2 (533 nm), 4S3/2 → 4I15/2 (555 nm) and 4F9/2 → 4I15/2 (658 nm) transitions of Er3+ ions, respectively. With the increase of thermal treatment temperature, the upconversion intensity is significantly raised and its intensity in GC-650 is 60 times higher than that of PG. The red-to-green emission ratios are 0.263, 0.242, 0.138 and 0.117 for the PG and GC-610, GC-630 and GC-650, respectively. The decrease of red-to-green emission ratio is mainly attributed to the gradual incorporation of Er3+ and Yb3+ into the low-phonon-energy NaY(WO4)2 nanocrystals, which effectively reduce the populations of 4F9/2 energy level through the non-radiative 4S3/2 → 4F9/2 transition. Furthermore, intense Stark splitting of Er3+ ions due to high crystal field effect also verify the above viewpoint. In order to analyze upconversion mechanism of Er3+ ions, the double logarithmic curves of upconversion intensity as a function of excitation power is determined and shown in the inset of Fig. 5(a). For an unsaturated process, the correlation of upconversion intensity I and excitation power P satisfy the following formula,30 I ∝ Pn, in which n is the number of the pump photon absorbed in the upconversion process for one visible photon emitted. Thus, the n values are equal to the slopes in the inset of Fig. 5(a) and are 1.95, 1.89 and 1.83 for 533 nm, 555 nm, and 658 nm, respectively. These values demonstrate that a double-photon absorption process is responsible for the populations on the 2H11/2, 4S3/2 and 4F9/2 energy levels of Er3+ ions. Based on the above data, the upconversion mechanism of Er3+, Yb3+ ions was proposed and plotted in the Fig. 5(b). Due to its wide absorption cross-section at 980 nm of Yb3+ ions, 980 nm light is mainly absorbed by Yb3+ and the latter efficiently transfers the energy to the adjacent Er3+ ions.21 Subsequently, Er3+ ions are excited to 4F7/2 energy level through absorbing double 980 nm photons from Yb3+ ions. Then, the 2H11/2, 4S3/2 and 4F9/2 energy levels are successively populated by the rapid non-radiative relaxation from 4F7/2 energy level, from which green and red upconversion emissions appear. Moreover, the population of 4F9/2 energy level may be also from the energy transfer process of 4I13/2 energy level.Temperature dependence upconversion luminescence of Er3+ ions and temperature sensing performance
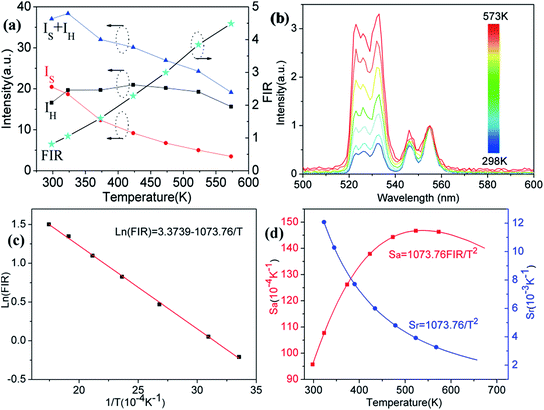
In order to investigate the potential of Er3+/Yb3+ codoped glass ceramics containing NaY(WO4)2 nanocrystals for optical thermometry based on FIR technique, the dependence of green upconversion luminescence in GC-650 on the temperature was measured at the temperature range from 298 to 573 K and the change of the integrated upconversion intensity of 2H11/2 (IH), 4S3/2 (IS) as well as 2H11/2+4S3/2 (IH + IS) of Er3+ ions versus temperature is shown in the Fig. 6(a). It is notable that the integrated upconversion intensity IH of 2H11/2 → 4I15/2 transition first increase and then decrease slowly with the enhancement of environmental temperature. The maximum value of IH occurs at 423 K. On the contrary, the integrated upconversion intensity IS of 4S3/2 → 4I15/2 transition decreases dramatically, which results in the FIR of two energy levels (IH/IS) rise from 0.81 to 4.49. In general, when the temperature increases from 298 to 573 K, the upconversion emission become weak due to thermal quenching effect. In our experiment, the whole green upconversion intensity (IH + IS) reduces by 1/2 and intense green emission can be observed at 573 K. This is very beneficial to improve the accuracy of optical data. In order to better reveal the relative change of FIR, the green upconversion emissions were normalized to the intensity at 555 nm and shown in the Fig. 6(b). Clearly, the upconversion emission wavelength changes little, however, the FIR change significantly. Owing to the small bandgap between 2H11/2 and 4S3/2, they are thermally coupled and 2H11/2 energy level may be easily populated via thermal excitation from 4S3/2 energy level and achieve thermal equilibrium, which follows the Boltzmann distribution law. The FIR of upconversion emission is proportional to the ratio of the populations corresponding energy levels and is expressed as:
 | (4) |
The correlation between ln(FIR) and the inverse absolute temperature 1/T is described in Fig. 6(c). The linear fitting of the experimental values ln(FIR) as a function of the 1/T gives a slope about 1073.76. From this slope, the value of ΔE is calculated to be approximately 746.2 cm−1, which is very close to the energy gap between the 2H11/2 and 4S3/2 levels calculated from the upconversion emission spectra.
The absolute sensitivity (Sa) and relative sensitivity (Sr) are usually used to evaluate the temperature sensing performance and defined as the rate at which the absolute and relative FIR change with the temperature, which could be calculated using the following formula:
 | (5) |
 | (6) |
The corresponding sensitivity curves are demonstrated in Fig. 6(d). Table 1 lists the FIR parameters, relative sensitivity Sr, the maximum sensitivity Sa and the temperatures for the maximum sensitivity in different host matrix. Because Sr depends only on the energy gap ΔE, the Sr decreases gradually with the increase of temperature. Furthermore, due to its moderate energy gap, Sr achieved here is comparable to most of values of Er3+ ions in other host matrix. The absolute temperature sensitivity Sa increases rapidly with the increase of temperature and achieves the maximum value 146 × 10−4 K−1 at 523 K. Clearly, the temperature sensitivity Sa in our work is much larger than the reported data in fluorides, glass and glass ceramics and slightly larger than the value in tungstates and molybdates. According to Judd–Ofelt theory, S. F. León-Luis proposed that the host matrices with highly distorted local symmetry environments for Er3+ ions could obtain large fluorescence intensity ratios and high temperature sensitivities.16 Generally, rare earth ions are situated in a symmetric environment in the fluoride, while rare earth ions are located in the asymmetric surroundings in the double tungstates/molybdates due to its highly disordered structure.41 The above spectral analysis of Sm3+ ions in the NaY(WO4)2 glass ceramic also confirmed this point. Thus, our experiment provides a new evidence for the viewpoint that the disordered local surroundings around active ions are responsible for the enhancement of the optical sensitivity.
| Materials | Temperature range (K) | ΔE (cm−1) | Sr (%K−1) | Sa (× 10−4 K−1) | Temperature (K) | Ref. |
|---|---|---|---|---|---|---|
| Er3+/Yb3+:β-NaYF4 phosphor | 298–653 | 706 | 1015.99/T2 | 37 | 508 | 12 |
| Er3+:oxyfluoride glass | 293–720 | 773 | 1112/T2 | 66 | 570 | 16 |
| Er3+/Yb3+:α-NaYF4 glass ceramic | 293–720 | 741 | 1066/T2 | 24 | 540 | 16 |
| Er3+/Yb3+:NaY(WO4)2 phosphor | 133–773 | 725 | 1043.12/T2 | 112 | 515 | 17 |
| Er3+/Yb3+:NaLa(WO4)2 phosphor | 300–510 | 719 | 1005/T2 | 131 | 510 | 31 |
| Er3+/Yb3+:Na0.5Gd0.5MoO4 phosphor | 298–778 | 830.4 | 1195.11/T2 | 85.6 | 590 | 32 |
| Er3+/Yb3+:NaBiF4 phosphor | 248–498 | 758.1 | 1094.3/T2 | 40 | 498 | 33 |
| Er3+/Yb3+:oxyfluoride glass | 291–450 | 719 | 1035/T2 | 39 | 513 | 34 |
| Er3+/Yb3+:borosilicate glass | 293–873 | 896 | 1289.09/T2 | 31 | 550 | 35 |
| Er3+/Yb3+:K3LuF6 glass ceramic | 300–773 | 870 | 1256/T2 | 37.6 | 625 | 36 |
| Er3+/Yb3+:β-NaGdF4 glass ceramic | 303–563 | 789 | 1135/T2 | 37 | 580 | 37 |
| Er3+/Yb3+:α-NaYF4 glass ceramic | 298–693 | 775 | 1117/T2 | 24 | 560 | 38 |
| Er3+:Sr2YbF7 glass ceramic | 300–500 | 774 | 1129.8/T2 | 62 | 560 | 39 |
| Er3+:KYb2F7 glass ceramic | 300–480 | 844 | 1224/T2 | 45.4 | 590 | 40 |
| Er3+/Yb3+:NaY(WO4)2 glass ceramic | 298–573 | 746.2 | 1073.76/T2 | 146 | 523 | This work |
Conclusions
An optimized glass composition and an appropriate thermal treatment condition leads to the preparation of a novel glass ceramics, composed of NaY(WO4)2 nanocrystals dispersed homogeously in the amorphous glass matrix. The microstructure of these nanocrystals were analysed in details based on the XRD and TEM data. The influence of thermal treatment temperature on the luminescence of Sm3+ and Er3+/Yb3+ ions is studied thoroughly. During the devitrification process, Sm3+ and Er3+/Yb3+ ions are gradually segregated into the precipitated low phonon energy NaY(WO4)2 nanocrystals with a high disorder, which results in the enhancement of photoluminescence emission intensity, well-resolved Stark splitting and long luminescence decay lifetimes. According to the dependence of upconversion intensity on the excitation power, the upconversion mechanism of Er3+–Yb3+ ions was put forward. The temperature sensing performance was investigated based on the FIR technique and a maximum sensitivity 146 × 10−4 K−1 was achieved at 523 K. The established correlation of structure, luminescence and temperature sensing provides a new approach to optimize the best host materials for temperature sensing applications.Conflicts of interest
There are no conflicts to declare.Acknowledgements
This work was supported by Zhejiang Provincial Natural Science Foundation of China (No LR15F050003, LD18F050001 and LY18E020008), National Natural Science Foundation of China (No 51372236).Notes and references
- Y. F. Wang, G. Y. Liu, L. D. Sun, J. W. Xiao, J. C. Zhou and C. H. Yan, ACS Nano, 2013, 7, 7200–7206 CrossRef CAS PubMed.
- J. C. Goldschmidt and S. Fischer, Adv. Opt. Mater., 2015, 3, 510–535 CrossRef CAS.
- V. Mahalingam, F. Mangiarini, F. Vetrone, V. Venkatramu, M. Bettinelli, A. Speghini and J. A. Capobianco, J. Phys. Chem. C, 2008, 112, 1774501149 Search PubMed.
- B. Dong, B. S. Cao, Y. Y. He, Z. Liu, Z. P. Li and Z. Q. Feng, Adv. Mater., 2012, 24, 1987–1993 CrossRef CAS PubMed.
- Y. Y. Tian, Y. Tian, P. Huang, L. Wang, Q. F. Shi and C. Cui, Chem. Eng. J., 2016, 297, 26–34 CrossRef CAS.
- D. Q. Chen, Z. Y. Wan, Y. Zhou, P. Huang, J. S. Zhong, M. Y. Ding, W. D. Xiang, X. J. Liang and Z. G. Ji, J. Alloys Compd., 2015, 638, 21–28 CrossRef CAS.
- D. Q. Chen, Z. Y. Wan, Y. Zhou, X. Z. Zhou, Y. L. Yu, J. S. Zhong, M. Y. Ding and Z. G. Ji, ACS Appl. Mater. Interfaces, 2015, 7, 19484–19493 CAS.
- L. Mukhopadhyay and V. K. Rai, New J. Chem., 2017, 41, 7650–7661 RSC.
- S. F. León-Luis, U. R. Rodríguez-Mendoza, E. Lalla and V. Lavin, Sens. Actuators, B, 2011, 158, 208–213 CrossRef.
- X. S. Qiao, X. P. Fan and M. Q. Wang, Appl. Phys. Lett., 2006, 89, 111919 CrossRef.
- S. L. Zhao, X. Sun, X. L. Wang, L. H. Huang, Y. Fei and S. Q. Xu, J. Eur. Ceram. Soc., 2015, 35, 4225–4231 CrossRef CAS.
- L. L. Tong, X. P. Li, J. S. Zhang, S. Xu, J. S. Sun, L. H. Cheng, H. Zheng, Y. Q. Zhang, X. Q. Zhang, R. N. Hua, H. P. Xia and B. J. Chen, Sens. Actuators, B, 2017, 246, 175–180 CrossRef CAS.
- D. Manzani, J. F. S. Petruci, K. Nigoghossian, A. A. Cardoso and S. J. L. Ribeiro, Sci. Rep., 2017, 7, 41596 CrossRef CAS PubMed.
- B. R. Judd, Phys. Rev., 1962, 127, 750–761 CrossRef CAS.
- G. S. Ofelt, J. Chem. Phys., 1962, 37, 511–520 CrossRef CAS.
- S. F. León-Luis, U. R. Rodríguez-Mendoza, P. Haro-González and I. R. Martín, Sens. Actuators, B, 2012, 174, 176–186 CrossRef.
- P. Du, L. H. Luo and J. S. Yu, Ceram. Int., 2016, 42, 5635–5641 CrossRef CAS.
- X. S. Qiao, X. P. Fan, J. Wang and M. Q. Wang, J. Appl. Phys., 2006, 99, 074302 CrossRef.
- J. D. Fan, H. J. Zhang, W. T. Yu, H. H. Yu, J. Y. Wang and M. H. Jiang, J. Appl. Crystallogr., 2008, 41, 584–591 CAS.
- P. Du, X. Y. Huang and J. S. Yu, Inorg. Chem. Front., 2017, 4, 1987–1995 RSC.
- G. Dantelle, M. Mortier, G. Patriarche and D. Vivien, J. Solid State Chem., 2006, 179, 1995–2003 CrossRef CAS.
- L. L. Wang, B. K. Moon, S. H. Park, J. H. Kim, J. S. Shi, K. H. Kim and J. H. Jeong, RSC Adv., 2015, 5, 89290–89298 RSC.
- D. Q. Chen, Y. L. Yu, P. Huang, F. Y. Weng, H. Lin and Y. S. Wang, Appl. Phys. Lett., 2009, 94, 041909 CrossRef.
- A. C. Yanes, A. Santana-Alonso, J. Mendez-Ramos, J. Castillo and V. D. Rodriguez, Adv. Funct. Mater., 2011, 21, 3136–3142 CrossRef CAS.
- G. Seeta Rama Raju and S. Buddhudu, Spectrochim. Acta, Part A, 2008, 70, 601–605 CrossRef PubMed.
- D. Li, Y. Wang, X. Zhang, H. Dong, L. Liu, G. Shi and Y. Song, J. Appl. Phys., 2012, 112, 094701 CrossRef.
- D. G. Yin, C. C. Wang, J. Ouyang, K. L. Song, B. Liu, X. Z. Cao, L. Zhang, Y. L. Han, X. Long and M. H. Wu, Dalton Trans., 2014, 43, 12037–12043 RSC.
- L. Li, X. H. Tang, Z. Q. Jiang, X. J. Zhou, S. Jiang, X. B. Luo, G. T. Xiang and K. N. Zhou, J. Alloys Compd., 2017, 701, 515–523 CrossRef CAS.
- S. Jiang, P. Zeng, L. Q. Liao, S. F. Tian, H. Guo, Y. H. Chen, C. K. Duan and M. Yin, J. Alloys Compd., 2014, 617, 538–541 CrossRef CAS.
- M. Pollnau, D. R. Gamelin, S. R. Lüthi, H. U. Güdel and M. P. Hehlen, Phys. Rev. B: Condens. Matter Mater. Phys., 2000, 61, 3337–3346 CrossRef CAS.
- D. He, C. F. Guo, S. S. Zhou, L. L. Zhang, Z. Yang, C. K. Duan and M. Yin, CrystEngComm, 2015, 17, 7745–7753 RSC.
- P. Du, L. H. Luo, H. K. Park and J. S. Yu, Chem. Eng. J., 2016, 306, 840–848 CrossRef CAS.
- P. P. Lei, R. An, X. S. Zhai, S. Yao, L. L. Dong, X. Xu, K. M. Du, M. L. Zhang, J. Feng and H. J. Zhang, J. Mater. Chem. C, 2017, 5, 9659–9665 RSC.
- F. Li, B. Y. Lai, J. Wang, G. Q. Du and Q. Su, J. Lumin., 2010, 130, 2418–2423 CrossRef.
- S. Zhou, C. Li, Z. Liu, S. Li and C. Song, Opt. Mater., 2007, 30, 513–516 CrossRef CAS.
- J. K. Cao, F. F. Hu, L. P. Chen, H. Guo, C. K. Duan and M. Yin, J. Am. Ceram. Soc., 2017, 100, 2108–2115 CrossRef CAS.
- D. Q. Chen, Z. Y. Wan, Y. Zhou, P. Huang, J. S. Zhong, M. Y. Ding, W. D. Xiang, X. J. Liang and Z. G. Ji, J. Alloys Compd., 2015, 638, 21–28 CrossRef CAS.
- S. Jiang, P. Zeng, L. Q. Liao, S. F. Tian, H. Guo, Y. H. Chen, C. K. Duan and M. Yin, J. Alloys Compd., 2014, 617, 538–541 CrossRef CAS.
- X. M. Li, J. M. Cao, Y. L. Wei, Z. R. Yang and H. Guo, J. Am. Ceram. Soc., 2015, 98, 3824–3830 CrossRef CAS.
- J. K. Cao, F. F. Hu, L. P. Chen, H. Guo, C. K. Duan and M. Yin, J. Alloys Compd., 2017, 693, 326–331 CrossRef CAS.
- J. M. Cano-Torres, M. Rico, X. Han, M. D. Serrano, C. Cascales and C. Zaldo, Phys. Rev. B: Condens. Matter Mater. Phys., 2011, 84, 174207 CrossRef.
| This journal is © The Royal Society of Chemistry 2018 |

