 Open Access Article
Creative Commons Attribution 3.0 Unported Licence
A new approach to improve the electrochemical performance of ZnMn2O4 through a charge compensation mechanism using the substitution of Al3+ for Zn2+
Xianyu Zhu ,
Jingbin Quan,
Jichun Huang,
Zheng Ma,
Yixin Chen,
Decheng Zhu,
Chongxing Ji and
Decheng Li*
College of Physics, Optoelectronics and Energy, Soochow University, Soochow, People's Republic of China. E-mail: lidecheng@suda.edu.cn
First published on 15th February 2018
Abstract
ZnMn2O4 and Zn1−xAlxMn2O4 were synthesized by a spray drying process followed by an annealing treatment. Their structural and electrochemical characteristics were investigated by SEM, XRD, XPS, charge–discharge tests and EIS. XPS data indicate that the substitution of Al3+ for Zn2+ causes manganese to be in a mixed valence state by a charge compensation mechanism. Moreover, the presence of this charge compensation significantly improves the electrochemical performance of Zn1−xAlxMn2O4, such as increasing the initial coulombic efficiency, stabilizing the cycleability as well as improving the rate capability. The sample with 2% Al doping shows the best performance, with a first cycle coulombic efficiency of 69.6% and a reversible capacity of 597.7 mA h g−1 after 100 cycles. Even at the high current density of 1600 mA g−1, it still retained a capacity of 558 mA h g−1.
Introduction
Recently, rechargeable lithium ion batteries (LIBs), as energy storage devices, have been wildly applied in hybrid electric vehicles (HEVs), pure electric vehicles (EVs) and plug-in hybrid vehicles (PHEVs). However, in these cases, consumers want the vehicles to have a long cruising mileage and good safety, which requires LIBs with enhanced performance in terms of their energy density and safety.1–4 Most commercial LIBs still use graphite as the anode material due to its low cost, stable capacity, and long cycle life.5 However, the structure of graphite means that its theoretical capacity is only 372 mA h g−1 and the practical capacity is near to 360 mA h g−1. Thus, the demand for next-generation LIBs with higher capacity has stimulated efforts to develop new materials6,7 such as graphene, carbon nanotubes, silicon, tin oxide, etc.These new materials can usually be classified into three groups in terms of their electrochemical mechanism.8 The first is the intercalation/de-intercalation type, including many carbonaceous materials like hard carbons,9–11 carbon nanotubes12–15 and graphene,16 and some titanium oxides, such as TiO2 (ref. 17) and LiTi4O5.17 The second type is alloy/de-alloy mechanism. This type materials include such as silicon,18 germanium,19,20 tin,21 antimony,22 tin oxide23 and SiO.24 The third type is usually named as conversion mechanism mainly referring to some transition metal oxides such as manganese oxide,25–27 cobalt oxide28 and iron oxide.29 These materials have the advantages of high capacity, high energy, low cost and environmentally compatibility but also exist disadvantages like low coulombic efficiency, unstable SEI formation, large potential hysteresis and poor cycle life.
ZnMn2O4 belongs to the third type mechanism and not only has the same advantages, but also has an appropriated working potential above lithium, which could restrain the formation of lithium dendrites. However, ZnMn2O4 has two obvious drawbacks. One is poor electrical conductivity. The other is instability during the charge/discharge process. ZnMn2O4 can't be commercialized unless these two issues are solved.
So far, the investigations on the structural and electrochemical performances of the ZnMn2O4 are inadequate and rather few works were reported. Deng et al. synthesized agglomerated pure spinel ZnMn2O4 via calcination of an agglomerated Zn–Mn citrate complex precursor maintained a specific capacity of 650 mA h g−1 over 200 cycles.30 Courtel et al. synthesized nanoparticles ZnMn2O4 showed a capacity of 690 mA h g−1 after 90 cycles by using co-precipitation method.31 Feng et al. successfully synthesized ZnMn2O4 with the particle size about 50 nm retained a capacity of 745 mA h g−1 after 160 cycles through a rheological phase method.32
The groups mentioned above usually focused on the preparation of nano-size ZnMn2O4.33 It is well known that nano-size materials have many merits such as high surface area, short diffusion distance. However, the nano size materials usually need more binder as well as more conductive carbon in the formation of the electrode. The smaller the particle size is, the more binder amount needs.
It is well known that foreign metal ions doping can improve the electrochemical performances of the cathode materials. Generally, there are two kinds of substitution in terms of the charge balance.34 One is the equivalent and the other is the nonequivalent substitution. The equivalent-substitute ZnMn2O4, such as Cd-doped ZnMn2O4,35 has been studied already. However, investigations of the nonequivalent-substituted ZnMn2O4 are rather limited.
In our work, we want to improve the electrochemical performances through the nonequivalent substitution. ZnMn2O4 and Zn1−xAlxMn2O4 were synthesized by spray drying process following with annealing treatment. We also investigated the influence of aluminum doping on the structural and electrochemical performances of ZnMn2O4.
Experimental
ZnMn2O4 and Zn1−xAlxMn2O4 (x = 0.5%, 1%, 2%, 10%, mark as ZAMO0.5, ZAMO1, ZAMO2, ZAMO10, respectively) were prepared by a typical spray drying method using a citrate ligand to complex the metal ions. For this purpose, Zn(Ac)2·H2O (0.05, 0.04975, 0.0495, 0.049, 0.045 mol), Al(Ac)3·9H2O (0, 0.00025, 0.0005, 0.001, 0.005 mol), Mn(Ac)2·4H2O (0.1 mol) and citric acid (0.05 mol) were dissolved in 125 ml of deionized water with vigorous agitation. The mixed solution was spray-dried as the outlet temperature was set to 185 °C. Then the obtained white acetate powder was pre-sintered at 300 °C in air for 3 hours to decompose the organic constituents. After grinding into powder, the precursor was sintered at 600 °C in air for 20 hours to obtain target products.Characterization
The phase composition and structure of the sample were performed using an X-ray diffractometer equipped with Cu Kα radiation (XRD, Rint 1000, Rigaku, Japan) over the 2θ range of 10–90°. The morphologies and sizes of the samples were directly examined by scan electron microscopy (SEM). The electronic states of Mn in the samples were determined X-ray photoelectron spectroscopy (XPS, ESCALAB 250Xi).CR2032 coin-tape cell was used to investigate the electrochemical performances of the synthesized materials. The active material was mixed in slurry containing 10 wt% of Super P as a conductive agent and 10 wt% NaCMC as a binder. The homogeneous slurries were cast onto copper foils to obtain electrode laminate which were dried at 110 °C in the vacuum drying oven all over the night. The working cell was assembled in a glove box filled with dry argon. A lithium disk (Φ 15 × 1 mm) was used as a negative electrode (counter electrode and reference electrode). A Celgard 2400 porous polypropylene film was served as a separator. The electrolyte was 1 M LiPF6 dissolved in a compound of diethyl carbonate/ethylene carbonate (DEC/EC, 1![[thin space (1/6-em)]](https://www.rsc.org/images/entities/char_2009.gif) :
:![[thin space (1/6-em)]](https://www.rsc.org/images/entities/char_2009.gif) 1 by volume). The galvanostatic charge–discharge cycling and cyclic voltammetry were tested at room temperature (RT ∼ 25 °C) by means of a computer-controlled battery evaluation system (LAND CT 2001, Wuhan, China). And the electrochemical impedance spectroscopy (EIS) measurements were performed via PARSTAT 2273 electrochemical workstation system (Princeton Applied Research, AMETEK, America) over frequency range of 100 kHz to 10 mHz with amplitude of 10 mV.
1 by volume). The galvanostatic charge–discharge cycling and cyclic voltammetry were tested at room temperature (RT ∼ 25 °C) by means of a computer-controlled battery evaluation system (LAND CT 2001, Wuhan, China). And the electrochemical impedance spectroscopy (EIS) measurements were performed via PARSTAT 2273 electrochemical workstation system (Princeton Applied Research, AMETEK, America) over frequency range of 100 kHz to 10 mHz with amplitude of 10 mV.
Results and discussion
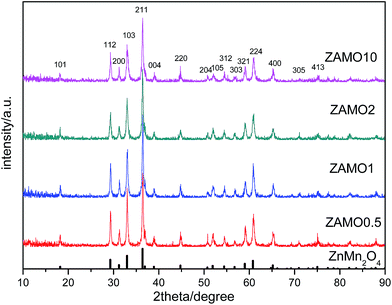
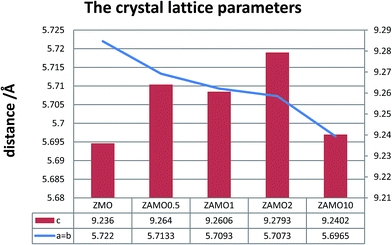
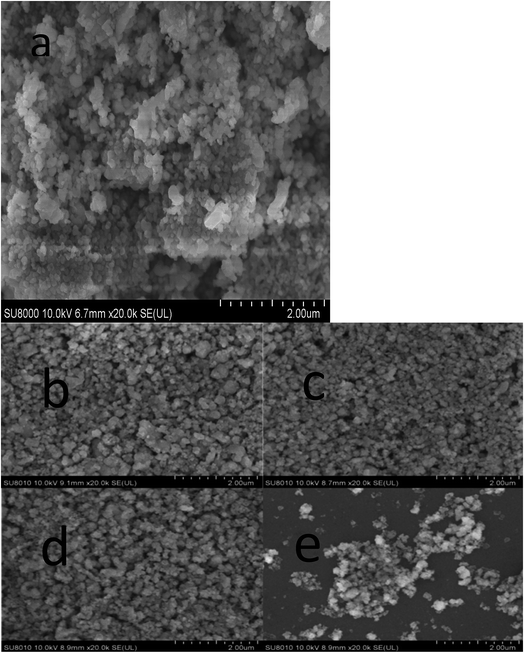
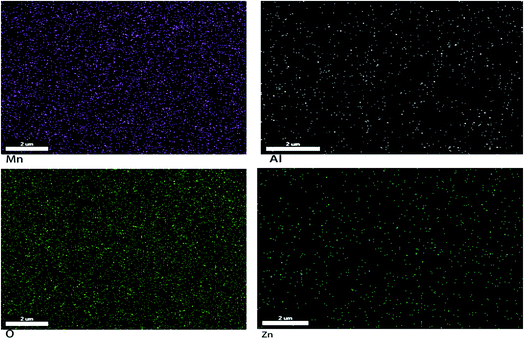
XRD patterns of the Zn1−xAlxMn2O4 materials are shown in Fig. 1. All diffraction peaks can be indexed well to tetragonal ZnMn2O4 (JCPDS card no. 24-1133; space group: I41/amd). No additional peaks are observed, indicating that the samples are pure. The lattice parameters calculated by JADE are shown in Fig. 2. The lattice parameters of the Zn1−xAlxMn2O4 a/b are gradually decreased from 5.722 Å to 5.6965 Å when x is increased from 0 to 10%. In the case of lattice parameter c, it is initially increased from 9.236 Å to 9.2793 Å when x is increased from 0 to 2%, then decreased to 5.6965 Å when x is increased 10%. This variation of lattice parameters should be ascribed to the substitution of Al3+ to Zn2+ since the radius of the Al3+ is smaller than that of the Zn2+ (Al3+: 0.535 Å, Zn2+: 0.74 Å). These results also indicate that Al3+ has been successfully introduced into the ZnMn2O4 lattice.Fig. 3 shows the SEM photographs of ZnMn2O4 and Zn1−xAlxMn2O4 samples. All samples have an aggregated morphology of some irregular primary particles whose size is around 150 nm. There is no change in terms of the particle size and shape after the substitution of Al3+ for Zn2+. The EDX images of the ZAMO2 are shown in Fig. 4. It can be seen that the sample is composed of zinc, manganese, oxygen and aluminum and those elements are in uniform distribution. It further proves that the aluminum ions were successfully introduced into the ZnMn2O4 lattice.
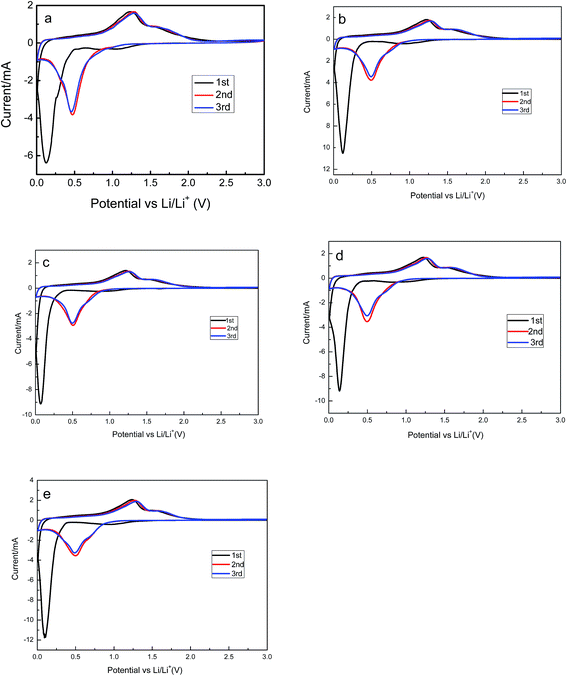
The cyclic voltammograms of Zn1−xAlxMn2O4 electrode are provided in Fig. 5. All cells were operated at a scan of 0.1 mV s−1 in the voltage range of 0.01–3.0 V versus Li/Li+. In the case of the ZnMn2O4, there are three cathodic peaks and two anodic peaks in the first cycle. According to the discussion in literatures, the first peak located at 1.2 V is attributed to the reduction of Mn3+ to Mn2+.36 The second one located at 0.8 V is ascribed to the electrolyte decomposition along with the formation of solid-electrolyte interface (SEI) on the surface of the electrode. Both of those two peaks disappear in the following cycles. The sharp and intense peak at 0.13 V is attributed to reduction of Mn2+ and Zn2+ to metallic Mn and Zn nanoparticles, respectively.37 Simultaneously, the Li–Zn alloy is also formed at this low potential. There are two peaks in the first charge process, one is at 1.3 V, and the other is at 1.5 V, corresponding to the oxidation of metallic Mn and Zn nanoparticles to MnO and ZnO.38 In the second and the third cycles, there is only one peak located at 0.5 V in the discharge process. They are resulted from the reduction of MnO and ZnO to Mn and Zn. The similarity of the subsequent CV curves indicates the high electrochemical reversibility of the sample. The cyclic voltammograms of Zn1−xAlxMn2O4 electrodes are shown in Fig. 5b–e. They are almost the same as the cyclic voltammograms of ZnMn2O4, implying that the Al3+ doping has no effect on the charge–discharge mechanism of ZnMn2O4.
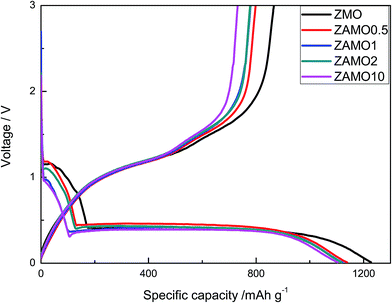
The first discharge–charge curves of ZnMn2O4 and Zn1−xAlxMn2O4 are shown in Fig. 6. The discharge plateaus of ZnMn2O4 and Zn1−xAlxMn2O4 are all at about 0.4 V. The specific capacities of the Zn1−xAlxMn2O4 between 0.4 V and 1.2 V slightly decrease after the Al3+ doping. It is probably related to the decrease in Mn3+ concentration in Zn1−xAlxMn2O4. Thus the total discharge capacities are decreased. The initial discharge capacities of five samples are much higher than the theoretical capacity of 1024 mA h g−1 corresponding to the reaction of ZnMn2O4 + 9Li+ + 9e− → ZnLi + 2Mn + 4Li2O. The extra capacity could result from the SEI layer on the surface of the electrode.39–42 The coulombic efficiency (CE) is an important parameter of LIBs. It reflects the degree of the Li+ going back to the lattice. The charge retention capacity increases along with CE increasing. The CEs of ZnMn2O4 and Zn1−xAlxMn2O4 are about 70% (1227/866, 1138/797, 1121/779, 1117/777, 1104/731 mA h g−1). This value is higher than CEs of other ZnMn2O4-based anodes reported in literature.43–46
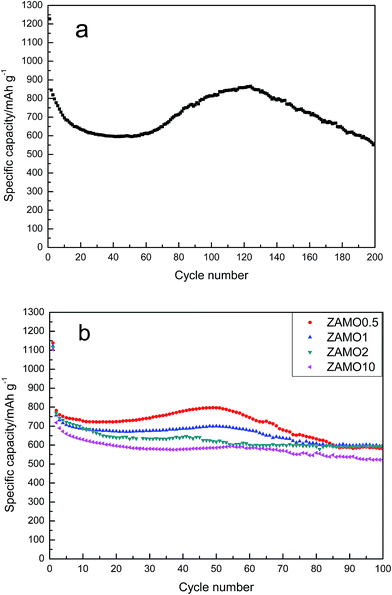
The cyclic performances of ZnMn2O4 and Zn1−xAlxMn2O4 are depicted in Fig. 7. All half-cells were operated at a current density of 100 mA h g−1 in the voltage range of 0.01–3.0 V in room temperature, using Li metal as an anode. The specific discharge capacity of ZnMn2O4 is gradually decreased till the 40th cycle and then increases till the 120th cycle. This abnormal increase in the discharge capacity between the 40th and 120th cycle have been ascribed to two factors. One is the formation of a polymer organic layer on the electrode during the cycling which can reserve Li reversibly.47,48 The other is the particles cracked during the cycling so that the contact area between the electrode and electrolyte solution increases.49 This phenomenon is not always good. When the nanostructure completely crumbled, the active materials will be separated from the conductive agent. This is bad for charge and ion transmission. As expected, following the rise, there is a quick decline in the capacity.
The discharge/charge curves of Zn1−xAlxMn2O4 electrodes are shown in Fig. 7b. It is obvious that the fluctuation of capacity disappears gradually after the doping with Al and the cycleability tends to be steady. ZAMO2 has a reversible capacity of 597.7 mA h g−1.
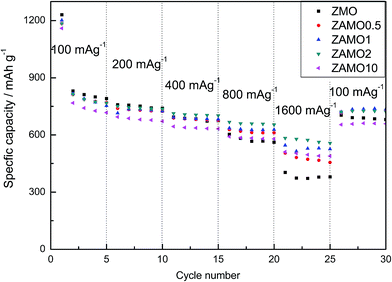
The rate capabilities of five samples are shown in Fig. 8, in the picture, Zn1−xAlxMn2O4 exhibits a much higher capacity at a current density of 1600 mA g−1. The capacities of ZAMO2 and ZMO are 557.8 mA h g−1 and 379.8 mA h g−1. When the current density goes back to 100 mA g−1, the capacity of ZAMO2 is also higher than ZMO. It indicates that ZAMO2 is more appropriate for charge/discharge at high current density.
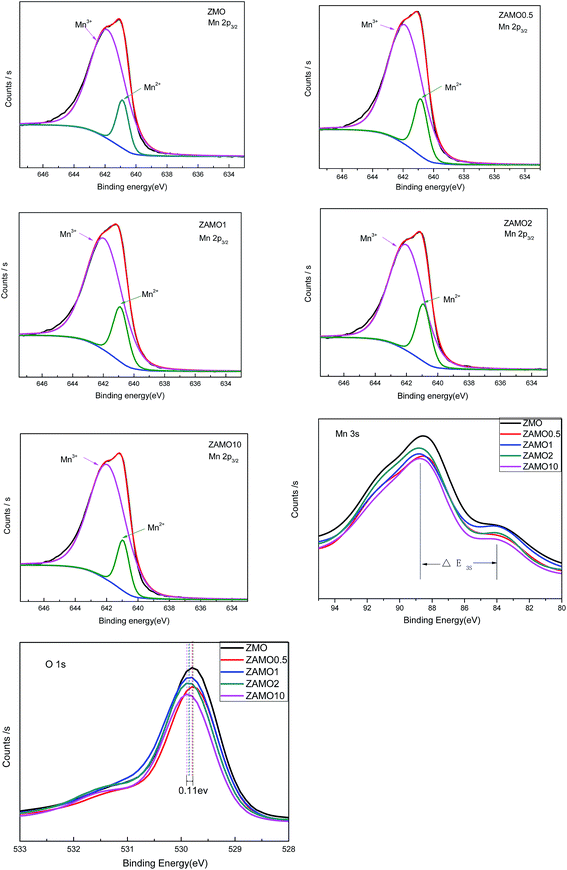
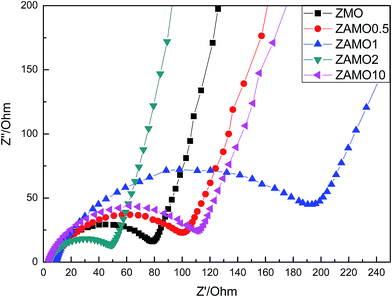
In order to clarify the mechanism of this improved performances after the introduction of Al, the X-ray Photoelectron Spectroscopy (XPS) and Electrochemical Impedance Spectroscopy (EIS) were measured and the results were provided in Fig. 9 and 10.
Fig. 9 shows the characteristic peaks of Mn2p, Mn3s and O1s. The binding energy of Mn2p3/2, multiplet splitting of the Mn3s level, the binding energy of O1s and the atomic ratio of Mn3+/Mn2+ are list in Table 1. The binding energy of Mn2p3/2 for the samples of Zn1−xAlxMn2O4 slightly shifts from 641.1 eV to 641.2 eV, while the binding energy of O1s shifts from 529.8 eV to 529.9 eV, when x increases from 0 to 0.1. These results implied that the substitution of Al for Zn increases the interaction between Mn and O. As to the ΔE3s of Mn, it increases from 4.5 eV to 5.1 eV when x is from 0 to 2%. According to previous research,50 the higher ΔE3s value indicated a lower valence of Mn. It is well known that Zn in ZnMn2O4 exhibits +2 and Mn is +3, after the substitution of Al3+ for Zn2+, the valence of Mn should be lower so that the sample displays electric neutrality. Furthermore, the atomic ratio of Mn3+/Mn2+ calculated through XPS analysis decreases from 6.5 to 4.5 when x is from 0 to 2%. Those results prove that some Mn3+ in Zn1−xAlxMn2O4 is partly transformed to Mn2+ in order to balance the Al3+ doping.
| Binding energy, Mn2p3/2 | ΔE3s | Binding energy, O1s | The atomic ratio of Mn3+/Mn2+ | |
|---|---|---|---|---|
| ZMO | 641.1 | 4.5 | 529.8 | 6.5 |
| ZAMO0.5 | 641.1 | 4.7 | 529.8 | 5.3 |
| ZAMO1 | 641.2 | 4.9 | 529.8 | 4.9 |
| ZAMO2 | 641.2 | 5.1 | 529.9 | 4.5 |
| ZAMO10 | 641.2 | 4.5 | 529.9 | 6.6 |
Fig. 10 shows the Nyquist plots of Zn1−xAlxMn2O4 before cycling. The depressed semicircles in the high frequency region are related to the ohmic resistance (Re) and the charge transfer resistance (Rct) through the electrode/electrolyte interface.51–53 Low resistance is good for the charge and ion diffusion. From the figure, we can easily find that ZAMO2 has the least diameter of the semicircles.
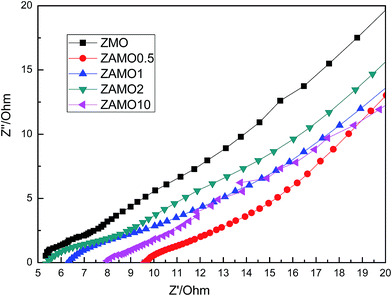
Fig. 11 shows the Nyquist plots of Zn1−xAlxMn2O4 after 10 cycles. The curves are almost lines with a slope of 45 degrees. This indicates that the batteries are controlled by the diffusion step of Li+ in solid phase.
According to the result of XPS and EIS, we believed that the introduction of Al makes Mn into a mixed valence state which can shorten the band gap width of manganese oxide and result in materials with higher conductivity. SEM shows that the particle size and morphology have no change after the doping, so that this improvement is all result from the charge compensation after the nonequivalent substitution.
Conclusion
In summary, the nonequivalent substitution of ZnMn2O4 was successfully realized by spray drying process following with annealing treatment. Results of XRD, EDX and XPS indicate that the materials are pure and the aluminum ions are successfully introduced into the ZnMn2O4 lattice. Meanwhile, the valance of Mn in Zn1−xAlxMn2O4 is in a mixed state because of charge compensation. ZAMO2 exhibits excellent stability, which maintains a high reversible of 597.7 mA h g−1 at the current density of 100 mA g−1 after 100 cycles. Even at high current density of 1600 mA g−1, the reversible capacity is still kept at 557.8 mA h g−1, which is higher than the capacity of theoretical commercial graphite. The electrochemical results demonstrated that the nonequivalent-substitution is a successful try for development of advanced anode material for high-performance LIBs.Conflicts of interest
There are no conflicts to declare.References
- T. Ohzuku and A. Ueda, J. Electrochem. Soc., 1994, 141, 2972 CrossRef CAS.
- W. Liu, G. C. Farrington, F. Chaput and B. Dunn, J. Electrochem. Soc., 1996, 143, 879 CrossRef CAS.
- A. Yamada, S. C. Chung and K. Hinokuma, J. Electrochem. Soc., 2001, 148, A224 CrossRef CAS.
- Y. S. Hu, P. Adelhelm, B. M. Smarsly, S. Hore, M. Antonietti and J. Maier, Adv. Funct. Mater., 2007, 17, 1873 CrossRef CAS.
- G.-A. Nazri and G. Pistoia, Lithium Batteries: Science and Technology, Kluwer Academic Publisher, Boston, Dordrecht, New York, London, 2004 Search PubMed.
- Y. L. Ding, J. A. Xie, G. S. Cao, T. J. Zhu, H. M. Yu and X. B. Zhao, Adv. Funct. Mater., 2011, 21, 348 CrossRef CAS.
- A. L. M. Reddy, M. M. Shaijumon, S. R. Gowda and P. M. Ajayan, Nano Lett., 2009, 9, 1002 CrossRef CAS PubMed.
- S. Goriparti, E. Miele, F. D. Angelis, E. D. Fabrizio, R. P. Zaccaria and C. Capiglia, J. Power Sources, 2014, 257, 421–443 CrossRef CAS.
- H. Fujimoto, K. Tokumitsu, A. Mabuchi, N. Chinnasamy and T. Kasuh, J. Power Sources, 2010, 195, 7452–7456 CrossRef CAS.
- J. Yang, X.-y. Zhou, J. Li, Y.-l. Zou and J.-j. Tang, Mater. Chem. Phys., 2012, 135, 445–450 CrossRef CAS.
- C. A. Bridges, X.-G. Sun, J. Zhao, M. P. Paranthaman and S. Dai, J. Phys. Chem. C, 2012, 116, 7701–7711 CAS.
- V. Meunier, J. Kephart, C. Roland and J. Bernholc, Phys. Rev. Lett., 2002, 88, 075506 CrossRef PubMed.
- C. M. Schauerman, M. J. Ganter, G. Gaustad, C. W. Babbitt, R. P. Raffaelle and B. J. Landi, J. Mater. Chem., 2012, 22, 12008–12015 RSC.
- K. Nishidate and M. Hasegawa, Phys. Rev. B: Condens. Matter Mater. Phys., 2005, 71, 245418 CrossRef.
- J. Zhao, A. Buldum, J. Han and J. Ping Lu, Phys. Rev. Lett., 2000, 85, 1706–1709 CrossRef CAS PubMed.
- J. Hou, Y. Shao, M. W. Ellis, R. B. Moore and B. Yi, Phys. Chem. Chem. Phys., 2011, 13, 15384–15402 RSC.
- Z. Chen, I. Belharouak, Y. K. Sun and K. Amine, Adv. Funct. Mater., 2013, 23, 959–969 CrossRef CAS.
- J. R. Szczech and S. Jin, Energy Environ. Sci., 2011, 4, 56–72 CAS.
- N. G. Rudawski, B. R. Yates, M. R. Holzworth, K. S. Jones, R. G. Elliman and A. A. Volinsky, J. Power Sources, 2013, 223, 336–340 CrossRef CAS.
- A. M. Chockla, K. C. Klavetter, C. B. Mullins and B. A. Korgel, ACS Appl. Mater. Interfaces, 2012, 4, 4658–4664 CAS.
- P. G. Bruce, B. Scrosati and J.-M. Tarascon, Angew. Chem., Int. Ed., 2008, 47, 2930–2946 CrossRef CAS PubMed.
- C.-M. Park, J.-H. Kim, H. Kim and H.-J. Sohn, Chem. Soc. Rev., 2010, 39, 3115–3141 RSC.
- Z. Wang, L. Zhou and X. W. Lou, Adv. Mater., 2012, 24, 1903–1911 CrossRef CAS PubMed.
- J. Yang, Y. Takeda, N. Imanishi, C. Capiglia, J. Y. Xie and O. Yamamoto, Solid State Ionics, 2002, 152–153, 125–129 CrossRef CAS.
- H. L. Wang, L. F. Cui, Y. Yang, H. S. Casalongue, J. T. Robinson, Y. Y. Liang, Y. Cui and H. J. Dai, J. Am. Chem. Soc., 2010, 132, 13978 CrossRef CAS PubMed.
- Y. F. Deng, L. N. Wan, Y. Xie, X. S. Qin and G. H. Chen, RSC Adv., 2014, 4, 23914–23935 RSC.
- J. B. Quan, L. Mei, Z. Ma, J. C. Huang and D. C. Li, RSC Adv., 2016, 6, 55786–55791 RSC.
- Y. S. N. Sharma, G. V. S. Tao and B. V. R. Chowdari, Adv. Funct. Mater., 2007, 17, 2855 CrossRef CAS.
- G. M. Zhou, D. W. Wang, F. Li, L. L. Zhang, N. Li, Z. S. Wu, L. Wen, G. Q. Lu and H. M. Cheng, Chem. Mater., 2010, 22, 5306 CrossRef CAS.
- Y. F. Deng, S. D. Tang, Q. M. Zhang, Z. C. Shi, L. T. Zhang, S. Z. Zhan and G. H. Chen, J. Mater. Chem., 2011, 21, 11987 RSC.
- F. M. Courtel, H. Duncan, Y. Abu-Lebdeh and I. J. Davidson, J. Mater. Chem., 2011, 21, 10206 RSC.
- C. Q. Feng, W. Wang, X. Chen, S. Q. Wang and Z. P. Guo, Electrochim. Acta, 2015, 178, 847–855 CrossRef CAS.
- M. Y. Nassar, E. A. El-Moety and M. F. El-Shahat, RSC Adv., 2017, 7, 43798–43811 RSC.
- D. C. Li, Y. Sasaki and K. Kobayakawa, J. Power Sources, 2006, 157, 488–493 CrossRef CAS.
- Y. L. Wang, X. Q. Wei and N. Guo, J. Mater. Sci.: Mater. Electron., 2017, 28(2), 1223–1228 CrossRef CAS.
- K. Leung, Predicting the voltage dependence of interfacial electrochemical processes at lithium-intercalated graphite edge planes, Phys. Chem. Chem. Phys., 2015, 17, 1637–1643 RSC.
- X. W. D. Lou, L. A. Archer and Z. Yang, Hollow micro-/nanostructures: synthesis and applications, Adv. Mater., 2008, 20, 3987–4019 CrossRef CAS.
- Z. Bai, N. Fan, C. Sun, Z. Ju, C. Guo, J. Yang and Y. Qian, Nanoscale, 2013, 5, 2442–2447 RSC.
- L. Huang, G. H. Waller, Y. Ding, D. Chen, D. Ding, P. Xi, Z. L. Wang and M. Liu, Nano Energy, 2015, 11, 64–70 CrossRef CAS.
- S.-Z. Huang, Y. Cai, J. Jin, J. Liu, Y. Li, Y. Yu, H.-E. Wang, L.-H. Chen and B.-L. Su, Nano Energy, 2015, 12, 833–844 CrossRef CAS.
- G. Huang, S. Xu, Z. Xu, H. Sun and L. Li, ACS Appl. Mater. Interfaces, 2014, 6, 21325–21334 CAS.
- G. Huang, F. Zhang, X. Du, J. Wang, D. Yin and L. Wang, Chem.–Eur. J., 2014, 20, 11214–11219 CrossRef CAS PubMed.
- L. Luo, H. Qiao, K. Chen, Y. Q. Fei and Q. F. Wei, Electrochim. Acta, 2015, 177, 283–289 CrossRef CAS.
- S. Q. Zhu, Y. Y. Shi, Q. L. Chen, Z. Y. Chen, R. Q. Bao, C. Yang, L. R. Hou, G. Pang and C. Z. Yuan, RSC Adv., 2016, 6, 2024 RSC.
- C. Q. Feng, W. Wang, X. Chen, S. Q. Wang and Z. P. Guo, Electrochim. Acta, 2015, 178, 847–855 CrossRef CAS.
- F. M. Courtel, Y. Abu-Lebdeh and I. J. Davidson, Electrochim. Acta, 2012, 71, 123–127 CrossRef CAS.
- L. Tuan Anh, A. Kumar Rai, T. Vu Thi, J. Gim, S. Kim, V. Mathew and J. Kim, J. Mater. Chem. A, 2014, 2, 6966–6975 Search PubMed.
- M. V. Reddy, G. V. Subba Rao and B. V. R. Chowdari, Chem. Rev., 2013, 113(7), 5364–5457 CrossRef CAS PubMed.
- L. Wang, Y. Yu, P. C. Chen, D. W. Zhang and C. H. Chen, J. Power Sources, 2008, 183, 717–723 CrossRef CAS.
- J. S. Foord, R. B. Jackman and G. C. Allen, Philos. Mag. A, 1984, 49(5), 657–663 CrossRef CAS.
- X. Yan, Y. Li, F. Du, K. Zhu, Y. Zhang, A. Su, G. Chen and Y. Wei, Nanoscale, 2014, 6, 4108 RSC.
- J. H. Yao, Y. W. Li, X. B. Song, Y. F. Zhang and J. Yan, J. Nanosci. Nanotechnol., 2018, 18, 3599–3605 CrossRef CAS.
- G. Li, Y. Wang, L. Yang, W. Ma and M. Wang, Eur. J. Inorg. Chem., 2014, 2014, 845–851 CrossRef CAS.
| This journal is © The Royal Society of Chemistry 2018 |

