 Open Access Article
Effect of grafted graphene nanosheets on morphology evolution and conductive behavior of poly(methyl methacrylate)/poly(styrene-co-acrylonitrile) blends during isothermal annealing
Jifei Zhang,
Min Zuo *,
Xiong Lv,
Haimo Zhang and
Qiang Zheng
MOE Key Laboratory of Macromolecule Synthesis and Functionalization, Ministry of Education, Department of Polymer Science and Engineering, Zhejiang University, Hangzhou 310027, China. E-mail: kezuomin@zju.edu.cn
First published on 18th April 2018
Abstract
A facile method was developed for directly grafting poly(methyl methacrylate) (PMMA) to graphene oxide (GO) without surface modification, with the resultant insulating PMMA-g-GO nanosheets further reduced in situ to give conductive grafted reduced graphene oxide (RGO) nanosheets. The effect of PMMA-g-RGO nanosheets on the morphological evolution and conductive behavior of partially miscible blends of poly(methyl methacrylate)/poly (styrene-co-acrylonitrile) (PMMA/SAN) upon annealing above their phase-separation temperature was investigated using phase-contrast microscopy (PCM) with a real-time online digital picoammeter. With phase separation of the blend matrix, the well-dispersed PMMA-g-RGO nanosheets in the homogeneous matrix preferentially migrated to the SAN-rich phase and showed remarkably little aggregation. Surface grafting of PMMA-g-RGO might inhibit the aggregation of nanosheets in the blend matrix and weaken the retardation effect of nanosheets on the morphology evolution of the blend matrix. Furthermore, the percolation behavior of dynamic resistivity for ternary nanocomposites was attributed to the formation of a PMMA-g-RGO conductive network in the SAN-rich phase. The activation energy of conductive pathway formation was closer to the activation energy of flow for PMMA than that of SAN.
1. Introduction
Graphene, a two-dimensional sheet of atomic thickness composed of sp2 carbon atoms arranged in honeycomb structure, has received much attention owing to its outstanding properties, which have led to recent breakthroughs in electronics, mechanics, photonics, and spintronics.1 Many oxygen-containing groups are known to be spread over the graphene surface and edges, such as carboxyl, hydroxyl, and epoxide groups.2 Reduced graphene oxide (RGO) should be modified to enhance the processing solubility in solvents and control its selective distribution and uniform dispersion in polymer blend matrix. The standard approach to modifying graphene usually involves its surface functional groups or grafting with other more active functional groups. The modified graphene oxide (GO) can then be converted into RGO using various reducing treatments to improve the conductive properties.3 Various methods for grafting polymers onto particle surfaces have been reported previously,4–7 which are mainly as categorized into “grafting from” and “grafting to” methods.8 The “grafting from” method relies on the surface functionalization of a substrate by an initiator moiety, with the polymer chains starting at surface-attached initiators.9 In the “grafting to” technique, the end-group-transformed polymer chains react with the substrate functional groups.10In these methods, functional groups on the substrate surface are used to graft the polymer chains, while intrinsic π-conjugated carbon double bonds in the graphene plane are often ignored. Many studies have reported that grafting polymer chains onto the GO surface should occur through surface functionalization of GO.10–12 Yang et al.13 reported the existence of a large number of π-conjugated carbon radicals in the π-network plane of GO, which could directly initiate the long-lasting visible chemiluminescence of luminol. Therefore, double bonds in the plane of GO can be directly initiated to graft polymer chains onto the GO surface.14
Surface grafting modification of GO and RGO could improve their dispersion in a polymer matrix. However, the selective distribution of modified nanosheets in polymer blends containing PMMA should be further explored, and its effect on the morphological evolution and phase behavior of such blends determined. Many studies have reported that the introduction of nanoparticles can change the compatibility of immiscible polymer blends and stabilize their morphology, especially when the nanoparticles are located at the interface of different phases.15 Furthermore, extensive research into the effect of nanoparticles on the miscibility and phase separation behavior of blend matrixes have been conducted for various partially miscible polymer blends. These studies found that the kinetics and thermodynamics of phase separation could be altered by the nanoparticles,16 because both the enthalpy and entropy of the polymer blend would be affected by the nanoparticles depending on their interaction within the nanoparticle/polymer or topological structure of the nanoparticles.17 Surface grafting modification of GO and RGO might also change the interaction within nanoparticle/blend matrixes and their agglomeration states in the blend matrix during annealing to further alter the conductivity of RGO-filled nanocomposites. Therefore, the distribution/dispersion of grafting modified nanoparticles, and their effect on the phase separation of a blend matrix, should be further explored to obtain a better understanding of the relationship between nanocomposite morphology and conductivity.
In this work, we attempt to utilize the double bonds of carbon in the GO plane to achieve surface grafting of poly(methyl methacrylate) (PMMA) onto GO, with the resultant PMMA-g-GO then chemically reduced to PMMA-g-RGO. A partially miscible PMMA/poly(styrene-co-acrylonitrile) (PMMA/SAN) blend is then chosen as the blend matrix. The evolution of morphology and conductivity of PMMA-g-RGO-filled PMMA/SAN ternary nanocomposites subjected to annealing above the phase separation temperature and the migration/aggregation of PMMA-g-RGO in the phase-separated blend matrix will be investigated. Furthermore, we also attempt to clarify the effect of PMMA-g-RGO on the phase separation behavior of the PMMA/SAN blend matrix.
2. Experimental
2.1. Materials
Poly(methyl methacrylate) (PMMA) (IF850, Mw = 7.5 × 10⁴, Mw/Mn = 1.5) was purchased from LG Chemical, Ltd., Korea. Poly(styrene-co-acrylonitrile) (SAN) (PN-127H, AN = 32 wt%, Mw = 1.5 × 10⁵, Mw/Mn = 1.7) was obtained from Chi Mei Corporation, Taiwan. Methyl methacrylate (MMA) was purchased from Sinopharm Chemical Reagent Co. Ltd and purified by vacuum distillation before use. GO was synthesized from natural graphite powder using a modified Hummers' method17 and freeze-dried before use. Benzoyl peroxide (BPO), analytical grade tetrahydrofuran (THF), hydrazine hydrate (85%), methyl ethyl ketone (MEK), and N,N-dimethyl formamide (DMF) were purchased from Sinopharm Chemical Reagent Co. Ltd and used as received.2.2. Sample preparation
![[double bond, length as m-dash]](https://www.rsc.org/images/entities/char_e001.gif) C double bonds in the graphene oxide planes, leading to the formation of π-conjugated carbon radicals as initiators for MMA polymerization. The mixture was centrifuged at 14
C double bonds in the graphene oxide planes, leading to the formation of π-conjugated carbon radicals as initiators for MMA polymerization. The mixture was centrifuged at 14![[thin space (1/6-em)]](https://www.rsc.org/images/entities/char_2009.gif) 000 rpm for 30 min and the supernatant containing free PMMA was removed. The product was subjected to ten cycles of THF-washing and separation via centrifugation to remove all free PMMA from PMMA-g-GO. The product and hydrazine hydrate (85%) in a 1 mg
000 rpm for 30 min and the supernatant containing free PMMA was removed. The product was subjected to ten cycles of THF-washing and separation via centrifugation to remove all free PMMA from PMMA-g-GO. The product and hydrazine hydrate (85%) in a 1 mg![[thin space (1/6-em)]](https://www.rsc.org/images/entities/char_2009.gif) :
:![[thin space (1/6-em)]](https://www.rsc.org/images/entities/char_2009.gif) 2 μL ratio were dispersed into DMF. The mixture was heated to 95 °C under stirring and refluxed for 4 h. The product was filtered, washed with distilled water and MEK three times, and then dispersed into MEK (50 mL) to afford a suspension of PMMA-g-RGO for subsequent use.
2 μL ratio were dispersed into DMF. The mixture was heated to 95 °C under stirring and refluxed for 4 h. The product was filtered, washed with distilled water and MEK three times, and then dispersed into MEK (50 mL) to afford a suspension of PMMA-g-RGO for subsequent use.
2.3. Characterization
Fourier transform infrared (FTIR) spectroscopy was used to evaluate GO and RGO grafted with PMMA. Infrared spectra were recorded in the range of 400–4000 cm−1 on a FTIR spectrometer (Vector 22, Bruker, Germany). Thermogravimetric analysis (TGA) (Q50, TA Instruments, USA) was used to analyze the amount of PMMA grafted on RGO. The samples were heated from 100 °C to 800 °C at a rate of 10 °C min−1 under a nitrogen atmosphere. X-ray diffraction (XRD) patterns of the samples were measured using a diffractometer (D/max 2550, Rigaku, Japan) with Cu Kα radiation (λ = 0.1542 nm) at a voltage of 40 kV and current of 30 mA. The molecular weight of grafted PMMA was estimated from the molecular weight of free PMMA in the supernatant, as obtained by gel permeation chromatography (GPC, Waters 1515, Waters, USA) with DMF as the eluent. The dispersion of PMMA-g-RGO and the morphological evolution of the nanocomposites were observed by transmission electron microscopy (TEM; JEM 1200EX, JEOL, Japan). Latex samples were prepared by casting one drop of dilute suspension onto a copper grid, with the resultant composite samples microtomed into sections 100 nm thick using a diamond knife at room temperature. None of the samples exhibited any yellowing throughout the measurement procedures, indicating that no obvious degradation occurred. The online morphological evolution of the PMMA/SAN blends and PMMA/SAN/PMMA-g-RGO nanocomposites was detected by PCM (BX51, Olympus, Japan) with a temperature-control hot stage (THMS600, Linkam, UK) in combination with a digital camera. All morphological images were recorded in real-time online.The setup for electrical behavior measurement was the same as reported elsewhere.18–20 Volume resistance was measured using a digital picoammeter (Keithley 6487, Keithley Instruments Inc., USA) with an applied direct voltage of less than 10 V (DC). The isothermal annealing temperatures ranged from 180 to 200 °C with a step of 10 °C. Dynamic rheological tests were performed on an advanced rheometric expansion system (ARES-G2, TA Instruments Corporation, USA) with a 25 mm diameter parallel plate geometry. Isothermal frequency sweeps ranging from 100 rad s−1 to 0.01 rad s−1 for PMMA and SAN were performed at various temperatures. The strain in the tests was set to 1%, ensuring that all measurements were in the linear viscoelastic region.
3. Results and discussion
3.1. Characterization of PMMA-g-GO and PMMA-g-RGO
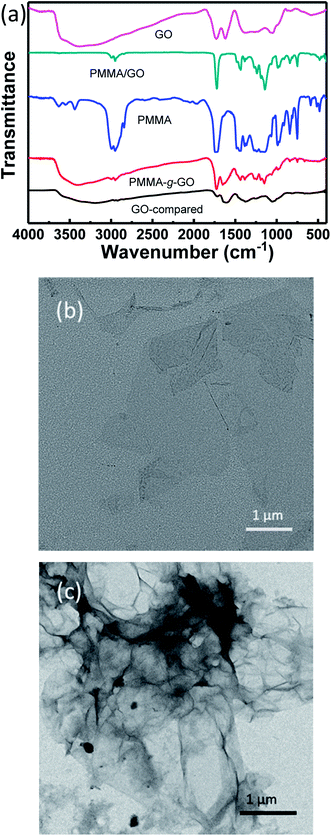
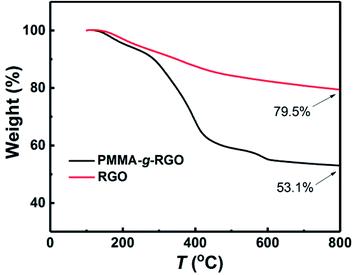
FTIR spectra of GO, PMMA-g-GO, PMMA, and PMMA-g-RGO are shown in Fig. 2(a). The characteristic peaks at 1728 and 1619 cm−1 were assigned to the C![[double bond, length as m-dash]](https://www.rsc.org/images/entities/char_e001.gif) O stretching vibration of carboxyl groups at GO edges and the C
O stretching vibration of carboxyl groups at GO edges and the C![[double bond, length as m-dash]](https://www.rsc.org/images/entities/char_e001.gif) C stretching mode of GO basal plane sp2 network, respectively.21,22 Compared with GO, the spectrum of PMMA-g-GO exhibited additional doublets at 2949 and 2992 cm−1 (asymmetric C–H stretching of methyl group), enhanced absorbance at 1726 cm−1 (C
C stretching mode of GO basal plane sp2 network, respectively.21,22 Compared with GO, the spectrum of PMMA-g-GO exhibited additional doublets at 2949 and 2992 cm−1 (asymmetric C–H stretching of methyl group), enhanced absorbance at 1726 cm−1 (C![[double bond, length as m-dash]](https://www.rsc.org/images/entities/char_e001.gif) O stretching vibration) and additional doublets at obvious C–H stretching vibrations of 1385 cm−1 and 1364 cm−1 (–CH3 stretching) attributed to PMMA,23 which strongly indicated the presence of PMMA on the GO nanosheets. Furthermore, the polymerization products were subjected to ten cycles of washing with THF and separation via centrifugation to remove free and physically adsorbed PMMA. The supernatant showing no GPC signal indicated that no free or physically adsorbed PMMA molecules remained in the products, with all remaining PMMA chains were chemically bonded to the GO nanosheets. For comparison, a GO-compared sample was prepared by solution mixing and subjecting to ten cycles of washing with THF and separation via centrifugation (the same post-processing procedure as PMMA-g-GO), is also shown in Fig. 2(a). The resultant FTIR spectrum exhibited almost no characteristic PMMA peaks, indicating that the physically adsorbed PMMA molecules had been washed out. In contrast, the spectrum of the PMMA/GO sample without post-treatment mainly showed characteristic peaks of PMMA, with GO perhaps embedded in the PMMA matrix. Fig. 2(b) and (c) show TEM images of GO and PMMA-g-RGO, respectively. GO nanosheets exhibited smooth surfaces with neat edges, while PMMA-g-RGO nanosheets were wrinkled with misty edges and surrounded by low contrast fragments, indicating encapsulation of the grafted PMMA chains. To quantitatively determine the grafting ratio of PMMA-g-RGO, TGA measurements of PMMA-g-RGO were performed, as shown in Fig. 3. Compared with RGO, the TGA curve of PMMA-g-RGO showed a large mass loss at about 280–430 °C, corresponding to the pyrolysis of grafted PMMA on the surface of modified RGO. Accounting for the residues of RGO and PMMA-g-RGO at 800 °C, the grafting ratio of PMMA-g-RGO was estimated to be 33.2%. Grafting using the carbon double bonds on GO to afford PMMA-g-GO in one-step process was efficient and the grafting ratio was comparable to those grafted through surface functional groups of GO.24 Furthermore, the weight-averaged molecular weight (Mw) and polydispersity index (Mw/Mn) of grafted PMMA were estimated from free PMMA in the supernatant as 5.1 × 10⁴ and 1.56, respectively. The specific surface area of GO chemically reduced by hydrazine hydrate was 716.3 m2 g−1,25 with the grafting density of PMMA-g-RGO calculated as about 0.008 chains/nm2 based on the TGA results. Yang13 also calculated that the density of carbon radicals on GO is 2.18 mmol g−1, while the grafting ratio was 1.83 chains pernm2. Therefore, approximately 0.44% of carbon radicals on the GO surface were used to initiate polymerization.
O stretching vibration) and additional doublets at obvious C–H stretching vibrations of 1385 cm−1 and 1364 cm−1 (–CH3 stretching) attributed to PMMA,23 which strongly indicated the presence of PMMA on the GO nanosheets. Furthermore, the polymerization products were subjected to ten cycles of washing with THF and separation via centrifugation to remove free and physically adsorbed PMMA. The supernatant showing no GPC signal indicated that no free or physically adsorbed PMMA molecules remained in the products, with all remaining PMMA chains were chemically bonded to the GO nanosheets. For comparison, a GO-compared sample was prepared by solution mixing and subjecting to ten cycles of washing with THF and separation via centrifugation (the same post-processing procedure as PMMA-g-GO), is also shown in Fig. 2(a). The resultant FTIR spectrum exhibited almost no characteristic PMMA peaks, indicating that the physically adsorbed PMMA molecules had been washed out. In contrast, the spectrum of the PMMA/GO sample without post-treatment mainly showed characteristic peaks of PMMA, with GO perhaps embedded in the PMMA matrix. Fig. 2(b) and (c) show TEM images of GO and PMMA-g-RGO, respectively. GO nanosheets exhibited smooth surfaces with neat edges, while PMMA-g-RGO nanosheets were wrinkled with misty edges and surrounded by low contrast fragments, indicating encapsulation of the grafted PMMA chains. To quantitatively determine the grafting ratio of PMMA-g-RGO, TGA measurements of PMMA-g-RGO were performed, as shown in Fig. 3. Compared with RGO, the TGA curve of PMMA-g-RGO showed a large mass loss at about 280–430 °C, corresponding to the pyrolysis of grafted PMMA on the surface of modified RGO. Accounting for the residues of RGO and PMMA-g-RGO at 800 °C, the grafting ratio of PMMA-g-RGO was estimated to be 33.2%. Grafting using the carbon double bonds on GO to afford PMMA-g-GO in one-step process was efficient and the grafting ratio was comparable to those grafted through surface functional groups of GO.24 Furthermore, the weight-averaged molecular weight (Mw) and polydispersity index (Mw/Mn) of grafted PMMA were estimated from free PMMA in the supernatant as 5.1 × 10⁴ and 1.56, respectively. The specific surface area of GO chemically reduced by hydrazine hydrate was 716.3 m2 g−1,25 with the grafting density of PMMA-g-RGO calculated as about 0.008 chains/nm2 based on the TGA results. Yang13 also calculated that the density of carbon radicals on GO is 2.18 mmol g−1, while the grafting ratio was 1.83 chains pernm2. Therefore, approximately 0.44% of carbon radicals on the GO surface were used to initiate polymerization.
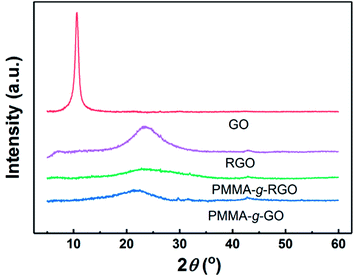
XRD has been used extensively to characterize graphene nanosheet dispersion in polymer matrixes. Fig. 4 shows the XRD patterns of GO, RGO, neat PMMA, PMMA-g-GO, and PMMA-g-RGO. Bragg's equation was used to evaluate the distance between sample layers, denoted as d.11 RGO and GO showed diffraction peaks at 2θ = 23.6° and 10.6°, corresponding to d-spacings of 0.37 nm and 0.83 nm, respectively. The d-spacing of GO was typical of monolayer GO nanosheets, indicating good exfoliation of GO,26,27 while the d-spacing of RGO was nearly equal to that of graphite,28 because the consumption of hydroxyl groups on GO nanosheets can weaken the repulsion between GO nanosheets generated by oxygen-containing groups. Compared with RGO, PMMA-g-GO and PMMA-g-RGO showed much broader and weaker peaks at 2θ = 22° and 23.4°, respectively, indicating that the grafting of PMMA on GO also consumed hydroxyl groups and that the nanosheets were scarcely covered with a low grafting density of PMMA chains. No characteristic low-angle peaks corresponding to the interlayer spacing of GO were present, which can be ascribed to exfoliation into a monolayer or a few layers accompanied by a high grafting ratio of PMMA onto GO or RGO nanosheets. In other words, GO and RGO planes of PMMA-g-GO and PMMA-g-RGO nanosheets might be surrounded by PMMA chains, preventing the nanosheets from contacting each other.
3.2. Influence of PMMA-g-RGO on the morphology evolution and conductive behavior of ternary nanocomposites
TEM micrographs of 0.3 and 0.7 wt% PMMA-g-RGO-filled PMMA/SAN (60/40) and PMMA/SAN/RGO (60/40/0.9) nanocomposites without annealing are shown in Fig. 5. PMMA-g-RGO nanosheets were dispersed uniformly in a homogeneous PMMA/SAN blend matrix. PMMA-g-RGO nanosheets stretched more extensively than unmodified RGO nanosheets, indicating their greater affinity with the polymer matrix.18,29 The distribution of PMMA-g-RGO and unmodified RGO in the PMMA/SAN (60/40) blend matrix, and the morphological evolution of the blend matrix subjected to annealing for different times at 180 °C are shown in Fig. 6. In the bright-field TEM micrographs, the bright region represents the PMMA-rich phase, while the dark region represents the SAN-rich phase. For PMMA/SAN/PMMA-g-RGO (60/40/0.3) nanocomposites, a co-continuous morphology can be observed in the PMMA/SAN blend matrix after annealing for 500 s, 30 min, 60 min, 2 h, and 3 h, indicating the emergence of phase separation according to the spinodal decomposition (SD) mechanism. Furthermore, PMMA-g-RGO nanosheets were mainly dispersed in the SAN-rich domain (dark region) at the early stage of SD for the PMMA/SAN blend matrix and spanned a number of domains due to their large lateral size (Fig. 6(a) and (b)). With the evolution of phase separation of the blend matrix, PMMA-g-RGO nanosheets remained located in the gradually coarsening SAN-rich domains. The final distribution of PMMA-g-RGO nanosheets in the phase-separated PMMA/SAN blend matrix was similar to that of unmodified RGO nanosheets, as shown in Fig. 6(f), induced by π–π conjugation between the CRGO honeycomb and SAN benzene ring. The surface grafting of PMMA-g-RGO barely resulted in different selective distributions of PMMA-g-RGO in the blend matrix. However, no obvious aggregates in the sample subjected to annealing for 3 h (as shown in Fig. 6(e)) indicated that the surface modification of PMMA-g-RGO nanosheets retarded their aggregation in the blend matrix.30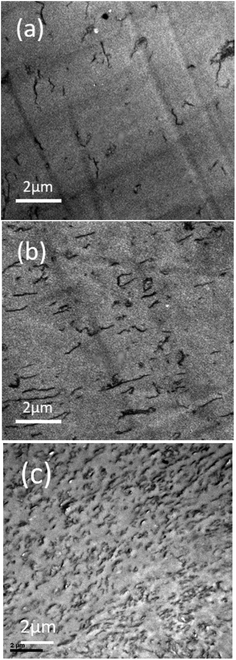 | ||
| Fig. 5 TEM images of (a) PMMA/SAN/PMMA-g-RGO (60/40/0.3), (b) PMMA/SAN/PMMA-g-RGO (60/40/0.7), and (c) PMMA/SAN/RGO (60/40/0.9)18 nanocomposites without annealing. | ||
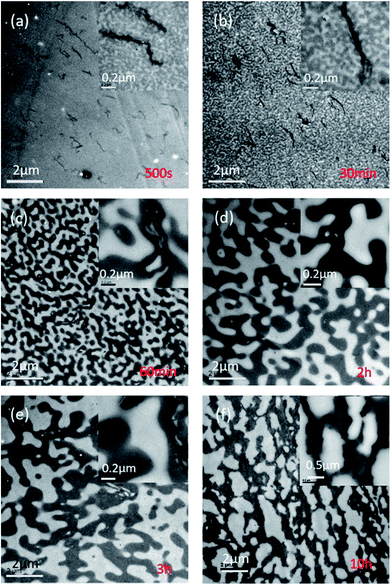 | ||
| Fig. 6 (a–e) TEM images of PMMA/SAN/PMMA-g-RGO (60/40/0.3) nanocomposites subjected to annealing at 180 °C for different times, and (f) TEM image of PMMA/SAN/RGO (60/40/0.9) nanocomposite subjected to annealing at 180 °C for 10 h.18 | ||
A promising strategy for controlling the dispersion of nanoparticles involves modification by grafting with the same chains as those found the matrix.31 Here, the selective distribution of PMMA-g-RGO in the phase-separated PMMA/SAN blend is in the SAN-rich phase, rather than the PMMA-rich phase. This distribution is not only induced by the aforementioned π–π conjugation between the CRGO honeycomb and SAN benzene ring, but also the variation in miscibility that mediated competing interactions between the cores, grafted chains, and host chains to engender different isotropic and anisotropic morphological phases.32 Increasing the grafting density (σ) or grafted chain length (N) can both lead to better dispersion owing to the larger excluded volume. However, increasing the length of matrix chains (P) leads to nanoparticle aggregation, attributed to the entropy-driven progressive loss of the brush–matrix interface and overlap between brushes of different cores.33 In our work, the grafting density was 0.008 chains per nm2 and the molecular weight of grafted chains was lower than that of the PMMA matrix chains, indicating that PMMA matrix chains caused little wetting of the grafted chains on the PMMA-g-RGO nanosheets. Therefore, the poor interfacial interaction between PMMA-g-RGO and the PMMA matrix might also result in the selective distribution of PMMA-g-RGO in the SAN-rich phase.
Fig. 7 shows the morphology evolution of PMMA/SAN (60/40) blends and PMMA/SAN/PMMA-g-RGO nanocomposites with weight ratios of 60/40/0.3 and 60/40/0.7 subjected to annealing at 190 °C for different times, as observed using PCM. The unfilled and filled systems all exhibited typical co-continuous morphologies at the early stage of phase separation when subjected to annealing for 30 and 60 min. As shown in Fig. 7(a3) and (a4), further extending the annealing time led to the morphological pattern of unfilled systems changing from co-continuous to a droplet structure due to the effect of interfacial tension between the two polymer components,34 which indicated that the co-continuous morphology was not a stable steady-state structure.35 For PMMA/SAN/PMMA-g-RGO (60/40/0.3) nanocomposites, the morphological pattern after annealing for 150 min exhibited the coexistence of percolation and droplet structures. However, only the co-continuous structure existed in PMMA/SAN/PMMA-g-RGO (60/40/0.7) nanocomposites after annealing for 150 min. Therefore, the introduction of PMMA-g-RGO stabilized the co-continuous morphology and inhibited the transformation from percolation to droplet structures. The stabilizing effect of PMMA-g-RGO on the morphological pattern of the blend matrix increased with increasing PMMA-g-RGO content, which was similar to the results of other filled systems.36,37 However, it should be noted that the effect of PMMA-g-RGO on the domain size of the blend matrix throughout phase separation was not obvious. Here, the surface grafting of PMMA-g-RGO can block the contact and interaction between PMMA-g-RGO and blend matrix components. Therefore, the small effect of PMMA-g-RGO on the molecular dynamics of SAN chains might result in the weakened retardation of phase separation, in a similar fashion to the effect of weak retardation of hydrophobic silica R974 on the phase separation behavior of polystyrene/poly(vinyl ethyl ether) (PS/PVME) blends.38,39
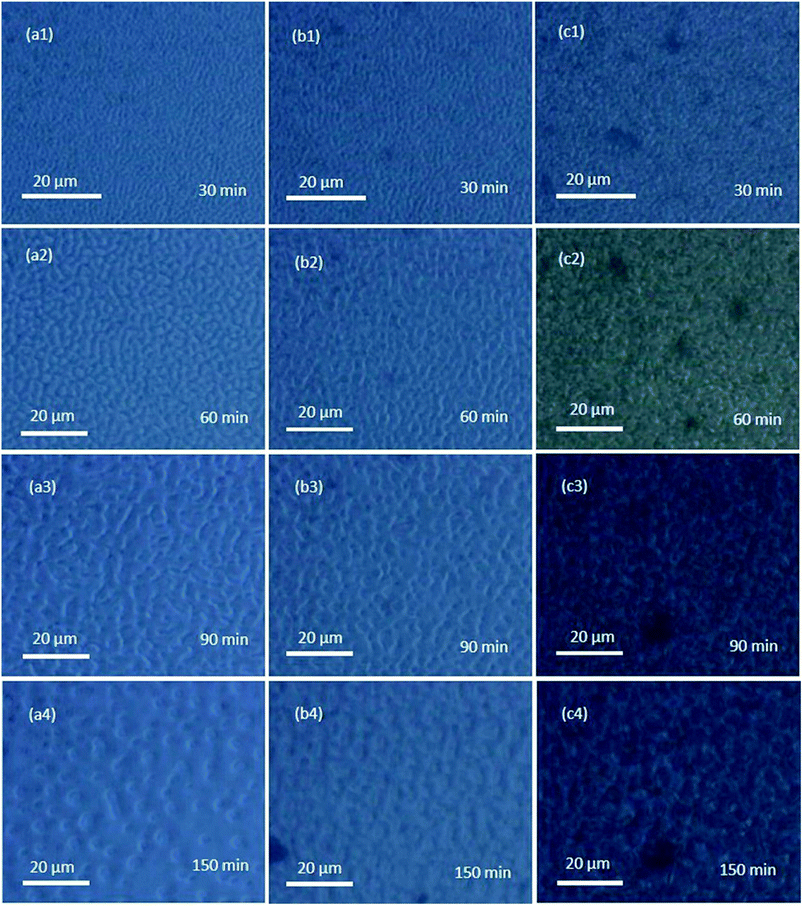 | ||
| Fig. 7 Morphology evolution for PMMA/SAN/PMMA-g-RGO nanocomposites with weight ratios of (a) 60/40, (b) 60/40/0.3, and (c) 60/40/0.7 subjected to annealing at 190 °C for different times. | ||
Generally, the dispersion of nanoparticles in the molten polymer matrix is low in the thermodynamic equilibrium state, owing to a tendency to aggregate together to reduce excess interfacial energy. The driving force for the aggregation of fillers might be the strong dispersive interaction between the filler and polymer matrix, and the depletion interaction between the adjacent nanoparticles.40 Herein, the conductive properties were measured to track the time evolution of volume resistivity ρ for the filled systems during isothermal annealing. Fig. 8(a) and (b) show the time evolution of ρ for PMMA-g-RGO-filled nanocomposites annealed at different temperatures. For comparison, the plots of ρ vs. t for unmodified RGO-filled PMMA/SAN nanocomposites from our previous work are also shown in Fig. 8(c). The initial ρ values of PMMA/SAN/PMMA-g-RGO nanocomposites with different filler loadings changed slightly at the same magnitude before a critical time and then their ρ values drop rapidly. The remarkable decay of ρ is related to dynamic conduction (DC) percolation, with the critical time at which the first conductive pathway generates known as the dynamic percolation time (tpR). With increasing annealing temperature or PMMA-g-RGO content, tpR decreased sharply, indicating that higher annealing temperatures or filler contents could accelerate DC percolation. The weight ratios of PMMA-g-RGO were 0.3 and 0.7, with corresponding volume ratios of about 0.15 and 0.35, respectively. Compared with the unmodified RGO-filled nanocomposites in our previous work,18 the PMMA-g-RGO-filled nanocomposites showed a relatively weak DC percolation with delayed tpR and decreased ρ drop, indicating that the conductive pathways of unmodified RGO nanosheets generated in the blend matrix were greater than those of PMMA-g-RGO. Namely, the surface grafting of RGO may retard its aggregation in the blend matrix during isothermal annealing. Furthermore, the aggregation of PMMA-g-RGO in the neat SAN matrix for SAN/PMMA-g-RGO (100/1.75) was consistent with that of the phase-separated blend matrix in the PMMA/SAN/PMMA-g-RGO (60/40/0.7) nanocomposite during isothermal annealing, as shown in Fig. 8(d). The retardation of modified nanosheet aggregation in SAN matrix is also observed due to the surface grafting of RGO.
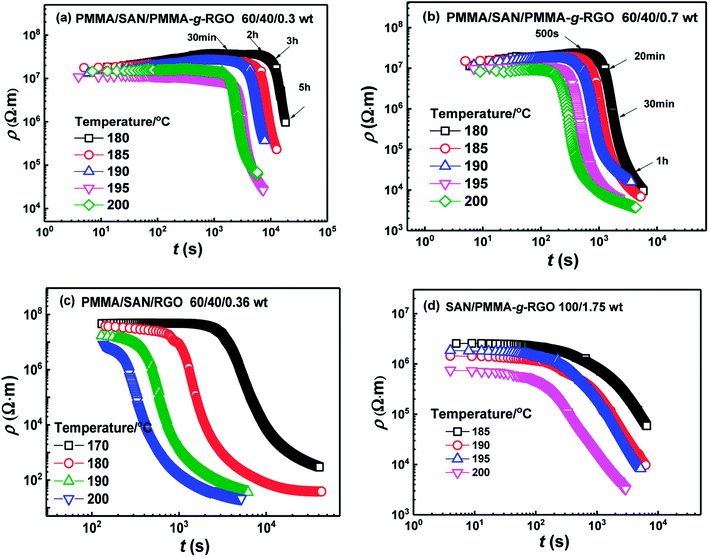 | ||
| Fig. 8 Time evolution of volume resistivity ρ for (a) PMMA/SAN/PMMA-g-RGO (60/40/0.3), (b) PMMA/SAN/PMMA-g-RGO (60/40/0.7), (c) PMMA/SAN/RGO (60/40/0.36),18 and (d) SAN/PMMA-g-RGO (100/1.75) nanocomposites at different annealing temperatures. | ||
The effect of PMMA-g-RGO on the onset of phase separation for the PMMA/SAN blend matrix was weaker than that of RGO, while the first conductive pathway in PMMA-g-RGO-filled nanocomposites was generated later than that in RGO-filled nanocomposites. However, the order of phase separation of the blend matrix and aggregation of PMMA-g-RGO into a conductive network should be further explored by TEM of samples annealed prior to tpR. Fig. 9 shows the TEM micrographs for PMMA/SAN/PMMA-g-RGO nanocomposites subjected to annealing at 180 °C for different times. For two nanocomposites, the blend matrices both clearly showed co-continuous morphology, with macromolecular chains of SAN enriched around PMMA-g-RGO nanosheets before the tpR, indicating that phase separation of the matrix occurred prior to DC percolation. Such a result was similar to that found for multiwalled carbon nanotube (MWNT)-filled PMMA/SAN systems41 and consistent with the opinion proposed by Krasovitski that particles with high aspect ratios easily penetrate completely into the better wetting liquid.42 When the volume resistivities of the two nanocomposites approached the same values, the time required for the PMMA/SAN/PMMA-g-RGO (60/40/0.3) system was much longer than that required for the PMMA/SAN/PMMA-g-RGO (60/40/0.7) system. Therefore, the domain size of the former was much larger than that of the latter. With phase separation of the blend matrix, PMMA-g-RGO nanosheets rapidly migrated into the SAN-rich phase, with PMMA-g-RGO nanosheet aggregation in the SAN-rich phase playing a predominant role in conductivity evolution.
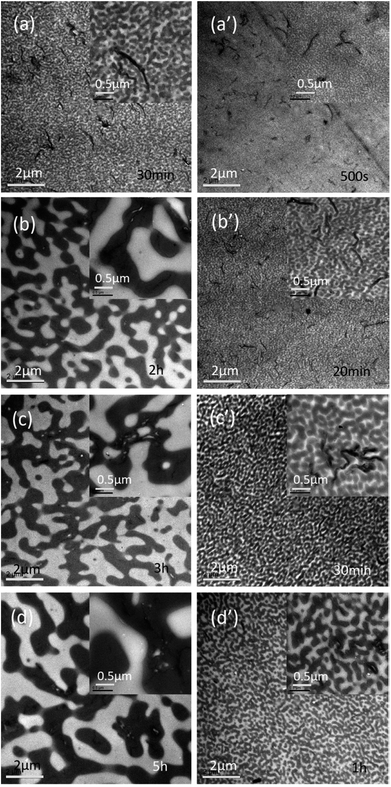 | ||
| Fig. 9 TEM images of PMMA/SAN/PMMA-g-RGO nanocomposites with weight ratios of (a–d) 60/40/0.3 and (a′–d′) 60/40/0.7 subjected to annealing at 180 °C for different times. | ||
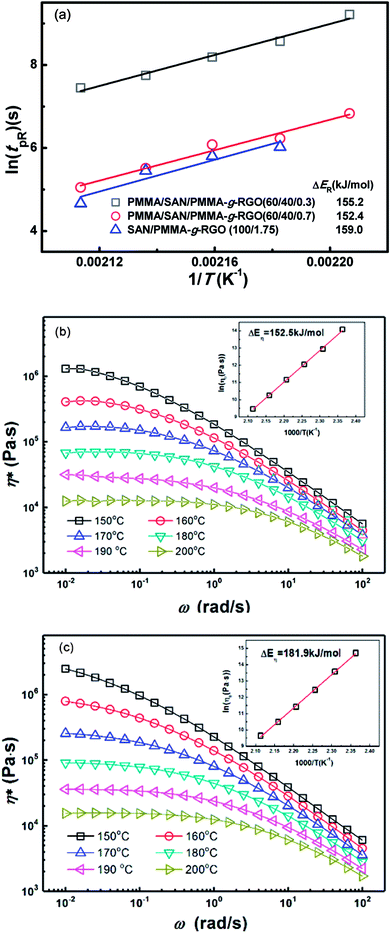
The tpR values for PMMA/SAN/PMMA-g-RGO (60/40/0.3), PMMA/SAN/PMMA-g-RGO (60/40/0.7), and SAN/PMMA-g-RGO (100/1.75) nanocomposites at different annealing temperatures were obtained from Fig. 8(a), (b), and (d). Fig. 10(a) shows tpR as a function of reciprocal temperature (1/T) for PMMA/SAN/PMMA-g-RGO and SAN/PMMA-g-RGO nanocomposites. Their ln(tpR) values were both clearly linearly dependent on 1/T. The activation energy of DC percolation (ΔER) was determined from the slope of tpR against 1/T. The ΔER values for PMMA/SAN/PMMA-g-RGO (60/40/0.3), PMMA/SAN/PMMA-g-RGO (60/40/0.7), and SAN/PMMA-g-RGO (100/1.75) nanocomposites were 155.2, 152.4, and 159.0 kJ mol−1, respectively. The ΔER values for neat SAN matrix and PMMA/SAN blend matrix were similar, indicating that phase separation of the blend matrix hardly affected PMMA-g-RGO aggregation. In contrast, although different PMMA-g-RGO loadings had different effects on the morphology and phase separation of the blend matrix, the ΔER values were almost independent of the filler content. This phenomenon was consistent with previous results reported by other researchers for composites with unitary polymer matrix.43,44 The aggregation of CB in unitary polymer melts is reported to be related with polymer dynamics.43,44 In our previous work, we also found that the ΔER of a PMMA/SAN/MWNTs system for DC percolation was close to the activation energy of flow for SAN. Herein, phase separation of the PMMA/SAN blend matrix occurred prior to DC percolation followed by PMMA-g-RGO nanosheets migrating rapidly and aggregating in the SAN-rich phase. To compare the activation energies of DC percolation and viscoelasticity of PMMA or SAN, we measured the complex viscosity (η*) for PMMA and SAN as a function of frequency (ω) in the temperature range 150–200 °C, as shown in Fig. 10(b) and (c). The inset plots show that the temperature dependence of zero shear viscosity (η0) for PMMA and SAN fitted the Arrhenius function with activation energies of flow (ΔEη) of 152.5 and 181.9 kJ mol−1, respectively. Although PMMA-g-RGO nanosheets aggregated in the SAN-rich phase, RGO nanosheets were surrounded by the grafted PMMA chains. The ΔER values for DC percolation are close to ΔEη for the viscous flow of PMMA, indicating that DC percolation might mainly be related to the mobility of the grafted PMMA chains. This result is consistent with the aforementioned weakened retardation of PMMA-g-RGO upon phase separation of the blend matrix due to the weak interaction between PMMA-g-RGO and SAN. Therefore, the surface grafting of PMMA-g-RGO can affect the mobility of nanosheets in the phase-separated blend matrix, which is not only related to the mobility of SAN-rich phase.
4. Conclusions
We have utilized a convenient and efficient method to directly graft PMMA on the surface of GO nanosheets through their double carbon bonds with a grafting ratio of 33.2%. After in situ reduction, insulating PMMA-g-GO nanosheets were converted into conductive PMMA-g-RGO nanosheets, which were then introduced into a partially miscible PMMA/SAN blend matrix to prepare ternary nanocomposites. The morphology evolution and conductive behaviors of PMMA/SAN/PMMA-g-RGO nanocomposites during annealing were monitored using a picoammeter, PCM, and TEM. With the occurrence of phase separation of the PMMA/SAN blend matrix upon annealing, most PMMA-g-RGO nanosheets well-dispersed in the homogeneous blend matrix were selectively located in the SAN-rich domains owing to the affinity of PMMA-g-RGO for SAN, with no large nanosheet aggregates observed in the SAN-rich phase subjected to annealing for a longer time. This indicated that the surface grafting of PMMA-g-RGO inhibited nanosheet aggregation in the blend matrix. Furthermore, surface grafting of PMMA-g-RGO might weaken interactions between the nanosheets and SAN, resulting in a small effect of PMMA-g-RGO on morphology evolution of the blend matrix. DC percolation also occurred in PMMA/SAN/PMMA-g-RGO nanocomposites during isothermal annealing, reflecting formation of a PMMA-g-RGO conductive network in the SAN-rich phase. The temperature dependence of tpR for ternary nanocomposites fitted the Arrhenius equation, with ΔER values close to the ΔEη of viscous flow for PMMA, indicating that DC percolation might be mainly related to the mobility of the grafted PMMA chains.Conflicts of interest
There are no conflicts of interest to declare.Acknowledgements
This work was financially supported by the National Natural Science Foundation of China (Nos. 51273173 and 51003093), the Fundamental Research Funds for the Central Universities (No. 2017QNA4038), and the National Natural Science Foundation of Zhejiang Province (No. LY16E030001).References
- D. Ferrah, J. Penuelas, C. Bottela, G. Grenet and A. Ouerghi, Surf. Sci., 2013, 615, 47–56 CrossRef CAS.
- S. Eigler and A. Hirsch, Angew. Chem., Int. Ed., 2014, 53, 7720–7738 CrossRef CAS PubMed.
- I. Kaminska, M. R. Das, Y. Coffinier, J. Niedziolka-Jonsson, J. Sobczak, P. Woisel, J. Lyskawa, M. Opallo, R. Boukherroub and S. Szunerits, ACS Appl. Mater. Interfaces, 2012, 4, 1016–1020 CAS.
- Y. S. Ye, Y. N. Chen, J. S. Wang, J. Rick, Y. J. Huang, F. C. Chang and B. J. Hwang, Chem. Mater., 2012, 24, 2987–2997 CrossRef CAS.
- Y. Q. Tan, L. J. Fang, J. L. Xiao, Y. H. Song and Q. Zheng, Polym. Chem., 2013, 4, 2939–2944 RSC.
- H. R. Thomas, D. J. Phillips, N. R. Wilson, M. I. Gibson and J. P. Rourke, Polym. Chem., 2015, 6, 8270–8274 RSC.
- L. Cui, J. Q. Liu, R. Wang, Z. Liu and W. R. Yang, J. Polym. Sci., Part A: Polym. Chem., 2012, 50, 4423–4432 CrossRef CAS.
- H. Roghani-Mamaqani, V. Haddadi-Asl and M. Salami-Kalajahi, Polym. Rev., 2012, 52, 142–188 CrossRef CAS.
- S. H. Lee, D. R. Dreyer, J. H. An, A. Velamakanni, R. D. Piner, S. Park, Y. W. Zhu, S. O. Kim, C. W. Bielawski and R. S. Ruoff, Macromol. Rapid Commun., 2010, 31, 281–288 CrossRef CAS PubMed.
- Y. Deng, Y. J. Li, J. Dai, M. D. Lang and X. Y. Huang, J. Polym. Sci., Part A: Polym. Chem., 2011, 49, 1582–1590 CrossRef CAS.
- P. Ding, J. Zhang, N. Song, S. F. Tang, Y. M. Liu and L. Y. Shi, Composites, Part A, 2015, 69, 186–194 CrossRef CAS.
- K. Jiang, C. N. Ye, P. P. Zhang, X. S. Wang and Y. L. Zhao, Macromolecules, 2012, 45, 1346–1355 CrossRef CAS.
- L. Yang, R. L. Zhang, B. H. Liu, J. P. Wang, S. H. Wang, M. Y. Han and Z. P. Zhang, Angew. Chem., Int. Ed., 2014, 53, 10109–10113 CrossRef CAS PubMed.
- L. Feng, G. H. Guan, C. C. Li, D. Zhang, Y. N. Xiao, L. C. Zheng and W. X. Zhu, J. Macromol. Sci., Part A: Pure Appl.Chem., 2013, 50, 720–727 CrossRef CAS.
- A. Taguet, P. Cassagnau and J. M. Lopez-Cuesta, Prog. Polym. Sci., 2014, 39, 1526–1563 CrossRef CAS.
- J. K. Yeganeh, F. Goharpey, E. Moghimi, G. Petekidis and R. Foudazi, Phys. Chem. Chem. Phys., 2015, 17, 27446–27461 RSC.
- P. Xavier, P. Rao and S. Bose, Phys. Chem. Chem. Phys., 2016, 18, 47–64 RSC.
- C. Y. Lin, M. Zuo, H. H. Li, T. Liu and Q. Zheng, Chin. J. Polym. Sci., 2015, 33, 1162–1175 CrossRef CAS.
- Q. Cao, Y. H. Song, Y. Q. Tan and Q. Zheng, Polymer, 2009, 50, 6350–6356 CrossRef CAS.
- Y. H. Song, Q. Cao and Q. Zheng, Colloid Polym. Sci., 2012, 290, 1837–1842 CAS.
- Z. J. Guo, S. F. Wang, G. Wang, Z. L. Niu, J. W. Yang and W. S. Wu, Carbon, 2014, 76, 203–211 CrossRef CAS.
- J. P. Rourke, P. A. Pandey, J. J. Moore, M. Bates, I. A. Kinloch, R. J. Young and N. R. Wilson, Angew. Chem., Int. Ed., 2011, 50, 3173–3177 CrossRef CAS PubMed.
- Y. W. Cao, J. C. Feng and P. Y. Wu, J. Mater. Chem., 2012, 22, 14997–15005 RSC.
- J. C. Yuan, G. H. Chen, W. G. Weng and Y. Z. Xu, J. Mater. Chem., 2012, 22, 7929–7936 RSC.
- Q. Q. Kong, C. M. Chen, Q. Zhang, X. H. Zhang, M. Z. Wang and R. Cai, J. Phys. Chem. C, 2013, 117, 15496–15504 CAS.
- Y. Wang, Z. X. Shi and J. Yin, ACS Appl. Mater. Interfaces, 2011, 3, 1127–1133 CAS.
- J. L. Xiao, J. F. Zhang, W. Y. Lv, Y. H. Song and Q. Zheng, Carbon, 2017, 123, 354–363 CrossRef CAS.
- Y. M. Li, L. H. Tang and J. H. Li, Electrochem. Commun., 2009, 11, 846–849 CrossRef CAS.
- C. Y. Lin, T. Liu, M. Zuo, H. H. Li, Q. Chen and Q. Zheng, RSC Adv., 2015, 5, 82259–82270 RSC.
- H. Pang, L. Xu, D. X. Yan and Z. M. Li, Prog. Polym. Sci., 2014, 39, 1908–1933 CrossRef CAS.
- P. F. Green, Soft Matter, 2011, 7, 7914–7926 RSC.
- G. G. Vogiatzis and D. N. Theodorou, Macromolecules, 2013, 46, 4670–4683 CrossRef CAS.
- J. X. Shen, J. Liu, Y. Y. Gao, D. P. Cao and L. Q. Zhang, Langmuir, 2011, 27, 15213–15222 CrossRef CAS PubMed.
- H. S. Jeon, A. I. Nakatani, C. C. Han and R. H. Colby, Macromolecules, 2000, 33, 9732–9739 CrossRef CAS.
- D. F. Wu, Y. S. Zhang, M. Zhang and W. D. Zhou, Eur. Polym. J., 2008, 44, 2171–2183 CrossRef CAS.
- P. Xavier and S. Bose, J. Phys. Chem. B, 2013, 117, 8633–8646 CrossRef CAS PubMed.
- J. K. Yeganeh, F. Goharpey, E. Moghimi, G. Petekidis and R. Foudazi, Soft Matter, 2014, 10, 9270–9280 RSC.
- Q. Chen, M. Zuo, R. Q. Yang, J. F. Zhang, X. Lv, W. J. Zhang, Y. H. Song and Q. Zheng, J. Polym. Sci., Part B: Polym. Phys., 2017, 55, 1337–1349 CrossRef CAS.
- Q. Chen, M. Zuo, Y. H. Song and Q. Zheng, Chin. J. Polym. Sci., 2017, 35, 1524–1539 CrossRef CAS.
- H. Deng, L. Lin, M. Ji, S. Zhang, M. Yang and Q. Fu, Prog. Polym. Sci., 2014, 39, 627–655 CrossRef CAS.
- H. H. Li, M. Zuo, T. Liu, Q. Chen, J. Zhang and Q. Zheng, RSC Adv., 2016, 6, 10099–10113 RSC.
- B. Krasovitski and A. Marmur, J. Adhes., 2005, 81, 869–880 CrossRef CAS.
- G. Z. Wu, S. Asai and M. Sumita, Macromolecules, 2002, 35, 1708–1713 CrossRef CAS.
- C. Zhang, L. Wang, J. Wang and C. A. Ma, Carbon, 2008, 46, 2053–2058 CrossRef CAS.
| This journal is © The Royal Society of Chemistry 2018 |


