 Open Access Article
Creative Commons Attribution 3.0 Unported Licence
Photoluminescence properties of a Ce3+ doped Sr3MgSi2O8 phosphor with good thermal stability
Baochen Wang ,
Yangai Liu
 *,
Zhaohui Huang
 and
Minghao Fang
Beijing Key Laboratory of Materials Utilization of Nonmetallic Minerals and Solid Wastes, National Laboratory of Mineral Materials, School of Materials Science and Technology, China University of Geosciences, Beijing 100083, China. E-mail: liuyang@cugb.edu.cn; Fax: +86-10-82322186; Tel: +86-10-82322186
First published on 25th April 2018
Abstract
This study mainly reports an investigation about the crystal structure and photoluminescence properties of a Ce3+ doped alkaline earth metal silicate Sr3MgSi2O8. X-ray powder diffraction (XRD) and structure refinement methods are adopted to characterize the phase composition and crystal structure. The excitation/emission spectra and diffuse reflection spectra (DRS) of the title phosphor are measured and the mechanism of concentration quenching as well as thermal quenching are discussed in detail. Results show that the concentration quenching in Sr3MgSi2O8 is due to dipole–dipole interaction energy transfer between Ce3+ ions. The title phosphor has an excellent thermal stability with 90% emission intensity reserve when the temperature rises to 150 °C. The related mechanism is considered to be the thermal ionization effect and an energy level diagram was proposed to show the thermal ionization process.
1. Introduction
In recent decades, white light emitting diodes (w-LEDs) have been replacing conventional incandescent and fluorescent lamps for general illumination due to their overwhelming merits such as long life, being energy saving, and their environmental friendliness as well as high efficiency.1–3 Although LEDs have been applied in many fields, the luminescence properties of w-LEDs for general illumination still need to be improved in terms of their color rendering index (CRI) and correlated color temperature (CCT).4,5 The first and most common w-LED, which is fabricated with a blue LED chip and yellow-emitting YAG:Ce3+ phosphor, suffers from many drawbacks such as poor CRI (Ra = 70 to 80) and high CCT (approximately 7750 K).3,6 To achieve “warmer” white light with high CRI, a strategy combining a blue-LED and yellow-emitting phosphors with a broader spectra covering the red/green region, or UV-LED (380 to 420 nm) and red, green, and blue (RGB) multi-compositional phosphors are proposed.2,7,8 Considering these approaches, developing highly efficient phosphors with high thermal quenching temperatures and tunable color points in the entire visible region under blue or UV light excitation is urgently needed.The alkali-earth silicate is a significant host for rare earth doped phosphors due to its inherent advantages such as excellent chemical and thermal stability as well as the low price of high-purity silicate.9 Moreover, silicate can be produced at lower temperatures than nitrides and aluminates.10,11 M3MgSi2O8 (M = Ba, Sr, Ca) compounds have attracted much attention as promising host materials for Eu2+-doped blue phosphors. The emission properties have been investigated for improving the intensity and chromaticity.12–14 The X-ray powder diffraction (XRD) data of Sr3MgSi2O8 were first provided by Klasens et al. in 1957.11 After that, G. Blasse et al.15 systematically investigated the photoluminescent performance of Eu2+ doped Me3MgSi2O8 (Me = Ca, Sr, Ba) ternary system and revealed a systematic emission-color shift from blue to green depending on Me2+ ion size. These results are indicative of its great potential as a blue phosphor replacing commercial BaMgA11O17:Eu2+ (BAM). In 2009, Yoshinori Yonesaki et al.16 firstly report the precise crystal structure of Sr3MgSi2O8. It shows that Sr3MgSi2O8 crystallizes in a monoclinic system, with the cell parameters a = 13.877 Å, b = 5.458 Å, c = 9.452 Å. Although several reports on the photoluminescence properties of Ce3+/Tb3+ or Ce3+/Dy3+ co-doped Sr3MgSi2O8 phosphors have been published,17–19 systematic investigation on Ce3+ single doped Sr3MgSi2O8 is still very necessary. Our study is distinguished from the previous study because of systematic investigation on the phase, crystal structure and luminescent properties of title phosphor, with some new preparation conditions and new luminescent performance accordingly.
In this paper, we report the synthesis, crystal structure and photoluminescence properties of Ce3+ doped Sr3MgSi2O8 phosphor. The phase composition was characterized by XRD and the crystal structure is refined by structure refinement. The DRS, excitation and emission spectrum of title phosphor were measured and the mechanisms of concentration quenching and thermal quenching were discussed.
2. Experimental details
2.1 Raw materials and synthesis
The Sr3MgSi2O8:xCe3+ phosphors were synthesized by traditional high-temperature solid-state reaction method. The starting materials are MgO (AR, Westlong Share Ltd., Guangdong, China), SrCO3 (99.9%, Aladdin Share Ltd., Shanghai, China), SiO2 (AR, Sinopharm Group Chemical Reagent Ltd., Shanghai, China) and CeO2 (4 N, Minmetals Rare Earth Ltd., Beijing, China). A 5 wt% extra amount of H3BO3 (99.9%, Aladdin Share Ltd., Shanghai, China) was added as a flux to promote the crystallization of title phosphors. First, certain amounts of the starting materials were thoroughly grounded in an agate mortar. Then, the mixtures were placed in alumina crucibles and sintered at 1450 °C for 4 h in a flowing reducing (10 vol% H2/90 vol% N2) atmosphere. Finally, the samples were furnace-cooled to room temperature and grounded into powders for further measurements.2.2 Measurement and characterization
The phase of the title phosphor was identified by X-ray powder diffraction (XRD; D8 FOCUS diffractometer, Germany) with graphite-monochromatized Cu Kα radiation (λ = 1.5406 Å). The photoluminescence emission (PL) and photoluminescence excitation (PLE) spectra were measured by F-4600 fluorescence spectrophotometer (Hitachi, Japan) with a photomultiplier tube functioning at 500 V and a 150 W Xe lamp as the excitation source. The spectral resolution for photoluminescence measurement was 0.2 nm. The temperature dependent luminescence properties were determined on the same spectrophotometer equipped with an automatic temperature-regulating device. Diffuse reflection spectra were obtained via a UV-3600 UV-Vis-NIR spectrophotometer (Shimadzu) connected with an integrating sphere.3. Result and discussion
3.1 Phase and crystal structure
The phase composition of all the samples was characterized by XRD and the XRD patterns are shown in Fig. 1. The standard ICDD cards of Sr3MgSi2O8 (PDF no. 10-0075) is also illustrated in Fig. 1 as a comparison. The diffraction peaks of the as-prepared samples were consistent with those in the standard ICDD card, suggesting that all samples were obtained as pure-phase Sr3MgSi2O8 phase. The doping by small amounts of Ce3+ ions did not destroy the host crystal structure or produce foreign impurities.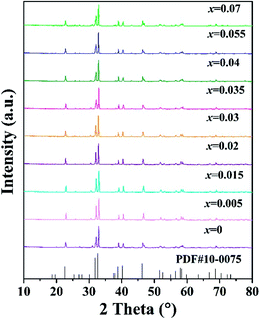 | ||
| Fig. 1 XRD patterns of the as-prepared Sr3MgSi2O8:xCe3+ (x = 0.005, 0.015, 0.02, 0.03, 0.035, 0.04, 0.055 and 0.07) phosphors, together with the standard ICDD cards of Sr3MgSi2O8. | ||
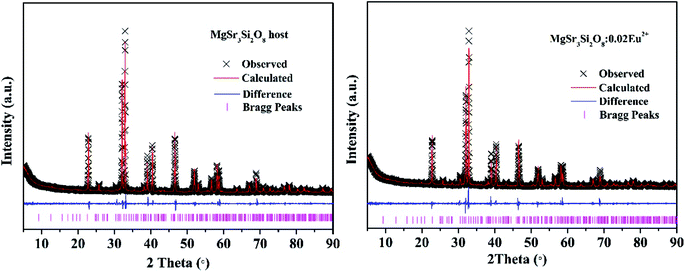
To further determine the phase purity and crystal structure, the XRD patterns of Sr3MgSi2O8 host and Sr3MgSi2O8:0.02Ce3+ phosphor were refined by the Rietveld refinement method using the Topas program. The standard structure of Sr3MgSi2O8 is referenced as an initial structural model.16 The refinement patterns are illustrated in Fig. 2 and the main refinement parameters and detailed crystallographic data are given in Table 1. All structure refinements are convergent and end with acceptable and publishable R factors. The results of the refinement further demonstrate that these phosphors match well with the starting model (Sr3MgSi2O8) and doping of Ce3+ ions don't bring any impurities or foreign phases.
| Compound | Sr3MgSi2O8 | Sr3MgSi2O8:0.02Ce3+ |
| Crystal system | Monoclinic | Monoclinic |
| Space group | P21/a (no. 14) | P21/a (no. 14) |
| a (Å) | 13.8724 (9) | 13.8779 (69) |
| b (Å) | 5.4565 (8) | 5.4569 (27) |
| c (Å) | 9.4516 (14) | 9.4520 (49) |
| β (°) | 90 | 90 |
| 2θ-interval (°) | 5–90 | 5–90 |
| Rwp (%) | 8.821 | 8.896 |
| Rexp (%) | 6.871 | 6.761 |
| RB | 2.154 | 1.540 |
| GOF | 1.284 | 1.316 |
Based on the refinement results, the crystal structure of Sr3MgSi2O8 host as well as the coordination environment diagram of cation in the host are presented in Fig. 3. The end-to-end [MgO6] octahedral and [SiO4] tetrahedron make up the main frame of Sr3MgSi2O8 host, while Sr2+ ions are embedded between these polyhedron. Because of radius similarity between substitution Ce3+ and Mg2+/Sr2+, Ce3+ ions are considered to occupy all the Mg2+ and Sr2+ sites. To show the local crystal field environment of Ce3+ ions, the coordination environment diagram of Mg2+ and Sr2+ is given in Fig. 3(b–e). It's seen that Mg2+ ions occupy six-coordinated site while Sr2+ ions occupy three different sites with eight and seven-coordinated environment.
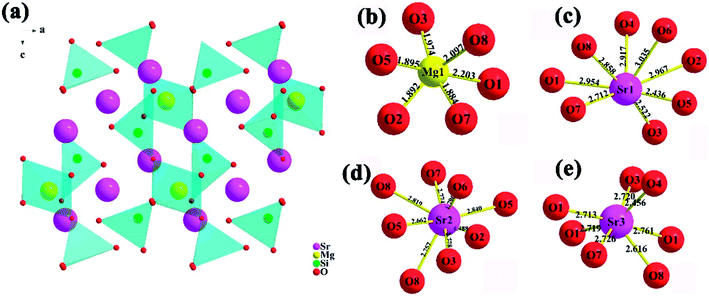 | ||
| Fig. 3 (a) Schematic crystal structure of Sr3MgSi2O8 host; (b–e) coordination environment of Mg2+ and Sr2+ sites in Sr3MgSi2O8 host. | ||
The PLE and PL spectra of the Sr3MgSi2O8:0.02Ce3+ phosphors are shown in Fig. 4. The PLE spectra of Sr3MgSi2O8:0.02Ce3+ monitored at 425 nm exhibited two distinct excitation peaks at 276 and 333 nm, which are assigned to the 4f → 5d transitions of the Ce3+ ions. Upon excitation by near UV (n-UV) light (λex = 365 nm), the PL spectra exhibited an asymmetric blue emission band ranging from 380 to 550 nm with peak center at 425 nm. As shown in Fig. 4, the emission band of Ce3+ could be decomposed into four well-separated Gaussian components peaking at 406, 421, 442 and 468 nm, corresponding to the energy 24![[thin space (1/6-em)]](https://www.rsc.org/images/entities/char_2009.gif) 649, 23
649, 23![[thin space (1/6-em)]](https://www.rsc.org/images/entities/char_2009.gif) 730, 22
730, 22![[thin space (1/6-em)]](https://www.rsc.org/images/entities/char_2009.gif) 619, 21
619, 21![[thin space (1/6-em)]](https://www.rsc.org/images/entities/char_2009.gif) 336 cm−1, respectively. The four Gaussian components may be assigned to the emission from two different Ce3+ occupation sites. The energy differences between two peaks are calculated to be 2030 and 2394 cm−1, respectively. The energy differences between two components are consistent with the theoretical energy difference between the separate 2F5/2 and 2F7/2 levels of the 4f ground state of Ce3+ due to shielding by the outer 5s and 5p electrons, which usually present the value as approximately 2000 cm−1.8
336 cm−1, respectively. The four Gaussian components may be assigned to the emission from two different Ce3+ occupation sites. The energy differences between two peaks are calculated to be 2030 and 2394 cm−1, respectively. The energy differences between two components are consistent with the theoretical energy difference between the separate 2F5/2 and 2F7/2 levels of the 4f ground state of Ce3+ due to shielding by the outer 5s and 5p electrons, which usually present the value as approximately 2000 cm−1.8
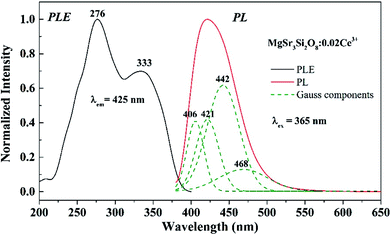 | ||
| Fig. 4 PLE (left) and PL (right) spectra of the Sr3MgSi2O8:0.02Ce3+ phosphor; fitting of the emission spectra of the Sr3MgSi2O8:0.02Ce3+ phosphor is also outlined by the green dotted line. | ||
The diffuse reflectance spectra (DRS) of the Sr3MgSi2O8 host as well as the Sr3MgSi2O8:0.02Ce3+ phosphor are presented in Fig. 5. The Sr3MgSi2O8:0.02Ce3+ phosphor presents several different absorption bands. The absorption band at approximately 220 nm is assigned to the host absorption. The several bands lying at approximately 240, 260, 310 and 350 nm are attributed to the transition from the ground state to different field-splitting 5d levels of Ce3+ ions. The peaks at 310 and 350 nm are in agreement with two absorption peaks at 276 and 333 nm in PLE spectra. The absorption peaks corresponding 240 and 260 nm in PLE are not as obvious as those in DRS probably because the two peaks are so weak that they are covered by the strong peak at 276 nm. The band gap of Sr3MgSi2O8 matrix was calculated according to the following equation:4
| [F(R∞hv)]2 = C(hv − Eg), | (1) |
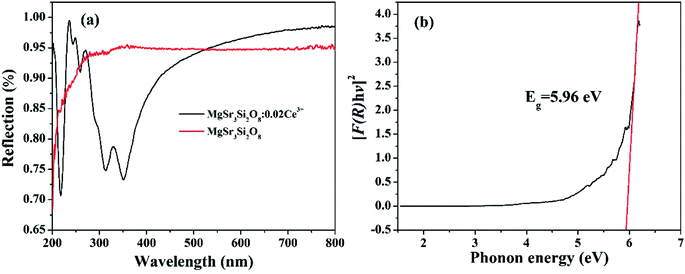 | ||
| Fig. 5 (a) Diffuse reflectance spectra (DRS) of Sr3MgSi2O8 host and Sr3MgSi2O8:0.02Ce3+ phosphor; (b) plot of transforming Kubelka–Munk function versus the energy of the light adsorbed. | ||
The PL spectra of Sr3MgSi2O8:xCe3+ phosphors (x = 0.005, 0.015, 0.02, 0.03, 0.035, 0.04, 0.055 and 0.07) under 365 nm excitation are presented in Fig. 6. The emission spectra exhibit a single broad band peaks at around 425 nm based on the allowed 4f65d → 4f7 transition of Ce3+ ions. As shown in the inset in Fig. 6, the emission intensity firstly rises to a maximum then falls with the increase of Ce3+ concentration, which is caused by the concentration quenching effect. When the doping concentration of Ce3+ increases, the interatomic distance between two Ce3+ ions becomes shorter and the energy transfer possibility is enhanced. As a result, the non-radiative transition happens between sensitizers or between sensitizer and activator, which decreases the efficiency and luminous intensity, referred to as the concentration quenching.20 The optimum Ce3+ concentration is 2 mol%, which indicates that the Sr3MgSi2O8:xCe3+ phosphors with optimal efficiency can be obtained at a relatively low quenching concentration.
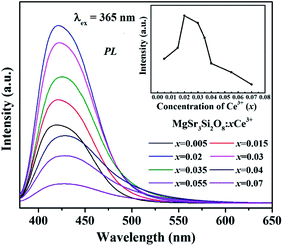 | ||
| Fig. 6 PL spectra of Sr3MgSi2O8:xCe3+ phosphors (x = 0.005, 0.015, 0.02, 0.03, 0.035, 0.04, 0.055 and 0.07). | ||
In terms of the energy transfer between two luminous centers, the transfer mechanism may take place through three modes, including radiation reabsorption, exchange interaction and electric multipolar interaction.21 The mechanism of radiation reabsorption is only effective when the fluorescence and absorption spectra are broadly overlapping. Therefore, radiation reabsorption does not occur in this case. It is necessary to obtain the critical distance (Rc) for energy transfer among Ce3+ ions to verify the process of energy transfer in this case. According to Dexter,22 the value of the critical distance (Rc) can be reckoned via the following equation:
 | (2) |
| I/I0 = [1 + β(C/C*)θ/3]−1 | (3) |
From Fig. 6, we can see that emission bands widen with increasing Ce3+ concentration, which indicates that more sites luminescence may be involved when Ce3+ concentration reach a certain level. Due to different luminescence efficiency at different site, the emission intensity can be also changed. Thus, it can be erroneous to explain the mechanism of the interaction by the eqn (3) easily. The full width at half maximum (FWHMs) of emission spectra are calculated and given in Table 2. It's clear that the FWHMs of emission spectra increase with x values, indicating that more sites luminescence may be involved with increasing Ce3+ concentration.
| x | 0.005 | 0.015 | 0.02 | 0.03 | 0.035 | 0.04 | 0.055 | 0.07 |
| FWHM (nm) | 66.6 | 67.2 | 66.4 | 67.4 | 69.6 | 78.2 | 79.8 | 78.4 |
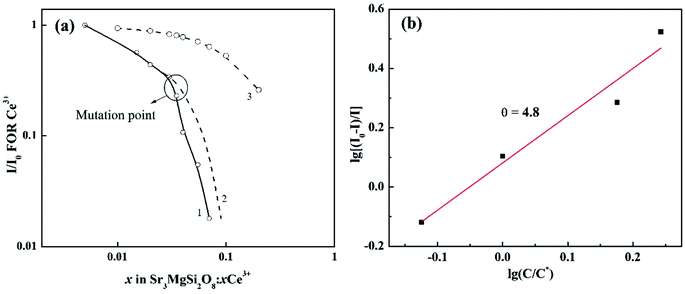
To have a better understand on the effects of more involved sites on the expression of concentration quenching by eqn (3), the normalized emission intensity I/I0 for per Ce3+ vs. Ce3+ concentration is shown in Fig. 7(a). The exchange interaction may not play an important role in the energy transfer because curve 1 doesn't follow the relation (1 − x)6 (curve 3).23 The I/I0 usually shows a continuous smooth reducing trend with quenching ion concentration.23 However, the curve 1 suddenly decays with an unexpected rate when x reaches 0.035. The mutation point is consistent with that in Table 2, where the FWHMs show an obvious increase after x reach 0.035. Hence, it's reasonable to conclude that when x reach a certain high level (about 0.035), Ce3+ ions may occupy some new sites, in which the Ce3+ ions may have lower luminescent efficiency. Hence, the curve 1 decays with a faster rate compared to the one it should be (as shown in curve 2). Due to the interference of this effect, only data at lower x values are adopted to calculate the multipolar interactions with eqn (3). The dependence of log[(I0 − I)/I] on log(C/C*) is plotted in Fig. 7(b). The value of θ is finally determined to be 4.8, indicating that the mechanism of energy transfer in Sr3MgSi2O8:xCe3+ phosphors is mainly predominated by dipole–dipole interaction.
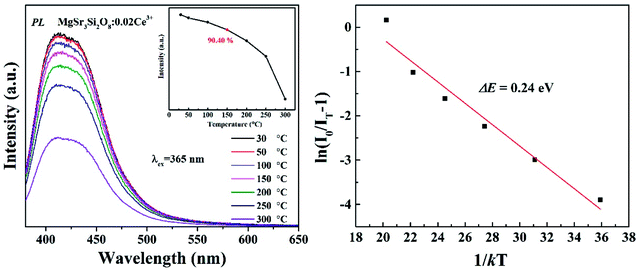
When functioning, the stability and reliability of a w-LED is finally determined by thermal stability of a phosphor. Good thermal stability of phosphors is always attributed to the rigid three-dimensional structure formed by polyhedron in related literatures. The temperature-dependent luminescent properties of Sr3MgSi2O8:0.02Ce3+ phosphors were measured. The activation energy, which refers to the energy barrier for non-radiative transition is an important value to estimate the thermal stability of a phosphor. Hence, the activation energy was calculated using the Arrhenius equation:
 | (5) |
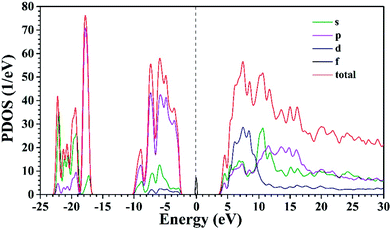
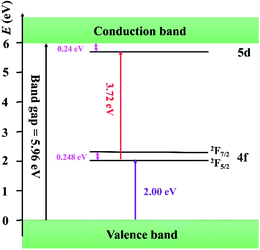
So far, several thermal quenching processes have been proposed including thermal relaxation through the crossing point based on the configurational coordinate model, thermal ionization from the emitting 5d1 levels to the conduction band and direct electron transfer from (higher) 5d levels to the conduction band with no activation energy (photoionization of the Ce3+ ion) prior to relaxation to the lowest 5d1 state.8,24 Although the configuration diagram is one of the most adopted model, some papers make an argument that the photoionization in the real mechanism for thermal quenching.25,26 Considering this matter, the energy level position of Ce3+ ion in Sr3MgSi2O8 host is calculated by first principle method. Fig. 9 illustrates the projected density of states (PDOSs) of Sr3MgSi2O8:0.02Ce3+ phosphor. The Eg is 5.72 eV. This agrees with 5.96 eV which is got from DRS. The energy gap between the 4f level of Ce3+ and the top of valence band was calculated to be 2 eV.
The diagram of the energy level position of Ce3+ ion in Sr3MgSi2O8 host is given in Fig. 10. The energy gap between 4f of Ce3+ and the top of the valence band (2.00 eV) is obtained from PDOSs. The excitation energy (3.72 eV) is obtained from PLE spectra. The typically energy difference of 2F5/2 and 2F7/2 is around 2000 cm−1 (0.248 eV), which is also considered in the scheme. Considering these energy levels, it's reasonable to suppose that thermal ionization from the emitting lowest 5d levels to the conduction band is the real mechanism of concentration quenching in the Sr3MgSi2O8 because the small energy gap between un-relaxed lowest 5d levels and the conduction band (0.24 eV) may not result in such a high quenching temperature.
To show the real color of the as-prepared phosphors, the color rendering index (CIE) chromaticity coordinates of the Sr3MgSi2O8:0.02Ce3+ phosphor was calculated and shown in Fig. 11. It can be seen that the CIE coordinate of Sr3MgSi2O8:0.02Ce3+ phosphor lie in the blue region (0.1561, 0.0389) which demonstrates that the Sr3MgSi2O8:0.02Ce3+ can serve as a blue phosphor for w-LEDs. The PL spectra of Sr3MgSi2O8:0.02Ce3+ phosphor with wavelength-dependent colors is also presented in the inset.
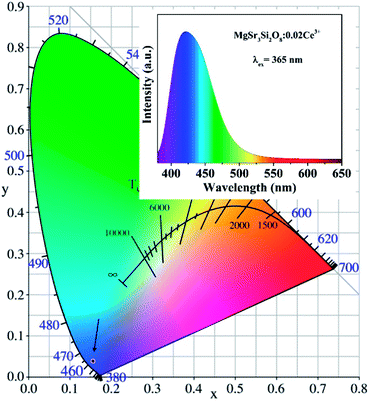 | ||
| Fig. 11 CIE chromaticity diagrams of Sr3MgSi2O8:0.02Ce3+ phosphor; the inset shows the PL spectra of Sr3MgSi2O8:0.02Ce3+ phosphor with wavelength-dependent colors. | ||
To evaluate the practicability of title phosphor, the quantum efficiency (QE) of the optimal sample Sr3MgSi2O8:0.02Ce3+ is measured to be 85%, which can be made even higher by improving synthesis conditions.27 As Fig. 5(a) shows, Ce3+ doped Sr3MgSi2O8 phosphor has strong absorption in the UV region, which matches UV chip very well. In general, with excellent thermal stability, high QE and strong absorption in UV region, the title phosphor is deserved to be a potential blue phosphor for UV chip based w-LED.28,29
4. Conclusion
The Ce3+ doped phosphor can be obtained by traditional high-temperature solid-state reaction method. The title phosphor crystallize in a monoclinic crystal system. The mechanism of concentration quenching was discussed and the energy transfer between Ce3+ ions was determined to be quadrupole–quadrupole interactions. The Sr3MgSi2O8:0.02Ce3+ title phosphor presents an excellent thermal stability. When temperature rises to 150 °C, the emission intensity can still remain 90% of that in room temperature. The thermal quenching mechanism was considered to be thermal ionization and a schematic energy levels position of Ce3+ ion in Sr3MgSi2O8 host is drowned to illuminate the thermal ionization process in title phosphor.Conflicts of interest
There are no conflicts to declare.Acknowledgements
We thank the financial support from the National Natural Science Foundation of China (Grant No. 51472223), the National Natural Science Foundation of China (Grant No. 51772278) and the Fundamental Research Funds for the Central Universities (Grant No. 2652015020).References
- G. Li, Y. Tian, Y. Zhao and J. Lin, Recent progress in luminescence tuning of Ce3+ and Eu2+-activated phosphors for pc-WLEDs, Chem. Soc. Rev., 2015, 44(23), 8688–8713 RSC.
- C. C. Lin and R. S. Liu, Advances in Phosphors for Light-emitting Diodes, J. Phys. Chem. Lett., 2011, 2(11), 1268–1277 CrossRef CAS PubMed.
- G. Li, C. C. Lin, W.-T. Chen, M. S. Molokeev, V. V. Atuchin and C.-Y. Chiang, et al., Photoluminescence Tuning via Cation Substitution in Oxonitridosilicate Phosphors: DFT Calculations, Different Site Occupations, and Luminescence Mechanisms, Chem. Mater., 2014, 26(9), 2991–3001 CrossRef CAS.
- B. Wang, Y.-g. Liu, Z. Huang and M. Fang, Energy transfer and thermal stability of Ce3+, Tb3+ co-doped Ca3Si2O4N2 phosphors for white light-emitting diodes, Chem. Phys. Lett., 2017, 690, 31–37 CrossRef CAS.
- B. Wang, Y. Liu, J. Chen, R. Mi, Y. Xia and Z. Huang, et al., Photoluminescence properties and application of yellow Ca0.65Si10Al2O0.7N15.3:xEu2+ phosphors for white LEDs, Solid State Sci., 2017, 64, 84–90 CrossRef CAS.
- Z. Xia, Z. Xu, M. Chen and Q. Liu, Recent developments in the new inorganic solid-state LED phosphors, Dalton Trans., 2016, 45(28), 11214–11232 RSC.
- C.-H. Huang and T.-M. Chen, Novel yellow-emitting Sr8MgLn(PO4)7:Eu2+ (Ln = Y, La) phosphors for applications in white LEDs with excellent color rendering index, Inorg. Chem., 2011, 50(12), 5725–5730 CrossRef CAS PubMed.
- Z. Xia and A. Meijerink, Ce3+-Doped garnet phosphors: composition modification, luminescence properties and applications, Chem. Soc. Rev., 2017, 46(1), 275–299 RSC.
- X. Luo, W. Cao and F. Sun, The development of silicate matrix phosphors with broad excitation band for phosphor-converted white LED, Sci. Bull., 2008, 53(19), 2923–2930 CrossRef CAS.
- Y. Liu, B. Lei and C. Shi, Luminescent properties of a white afterglow phosphor CdSiO3:Dy3+, Chem. Mater., 2005, 17(8), 2108–2113 CrossRef CAS.
- H. A. Klasens, A. H. Hoekstra and A. P. M. Cox, Ultraviolet fluorescence of some ternary silicates activated with lead, J. Electrochem. Soc., 1957, 104(2), 93–100 CrossRef CAS.
- J. S. Kim, P. Jeon, J. Choi, H. Park, S. Mho and G. Kim, Warm-white-light emitting diode utilizing a single-phase full-color Ba3MgSi2O8:Eu2+, Mn2+ phosphor, Appl. Phys. Lett., 2004, 84(15), 2931–2933 CrossRef CAS.
- T. L. Barry, Equilibria and Eu2+ Luminescence of Subsolidus Phases Bounded by Ba3MgSi2O8, Sr3MgSi2O8, and Ca3MgSi2O8, J. Electrochem. Soc., 1968, 115(7), 733–738 CrossRef CAS.
- H.-K. Jung and K. S. Seo, Luminescent properties of Eu2+-activated (Ba, Sr)3MgSi2O8 phosphor under VUV irradiation, Opt. Mater., 2006, 28(6), 602–605 CrossRef CAS.
- G. Blasse, W. L. Wanamaker, J. W. ter Vrugt and A. Bril, Fluorescence of Eu2+ activated silicates, Philips Res. Rep., 1968, 23, 189–200 CAS.
- Y. Yonesaki, T. Takei, N. Kumada and N. Kinomura, Crystal structure of Eu2+-doped M3MgSi2O8 (M: Ba, Sr, Ca) compounds and their emission properties, J. Solid State Chem., 2009, 182(3), 547–554 CrossRef CAS.
- H. Yu, W. Zi, S. Lan, S. Gan, H. Zou and X. Xu, et al., Green light emission by Ce3+ and Tb3+ co-doped Sr3MgSi2O8 phosphors for potential application in ultraviolet white light-emitting diodes, Opt. Laser Technol., 2012, 44(7), 2306–2311 CrossRef CAS.
- H. Yu, W. Zi, S. Lan, S. Gan, H. Zou and X. Xu, et al., Photoluminescence properties and energy transfer in Ce3+/Dy3+ co-doped Sr3MgSi2O8 phosphors for potential application in ultraviolet white light-emitting diodes, Luminescence, 2013, 28(5), 679–684 CrossRef CAS PubMed.
- Y. Chen, B. Zhou, Q. Sun, Y. Wang and B. Yan, Synthesis and luminescence properties of Sr3MgSi2O8:Ce3+,Tb3+ for application in near ultraviolet excitable white light-emitting-diodes, Superlattices Microstruct., 2016, 100, 158–167 CrossRef CAS.
- D. L. Dexter and J. H. Schulman, Theory of Concentration Quenching in Inorganic Phosphors, J. Chem. Phys., 1954, 22(6), 1063–1070 CrossRef CAS.
- Y.-C. Chiu, C.-H. Huang, T.-J. Lee, W.-R. Liu, Y.-T. Yeh, S.-M. Jang and R.-S. Liu, Eu2+-activated silicon-oxynitride Ca3Si2O4N2: a green-emitting phosphor for white LEDs, Opt. Express, 2011, 19(103), A331–A339 CrossRef PubMed.
- D. L. Dexter, A Theory of Sensitized Luminescence in Solids, J. Chem. Phys., 1953, 21(5), 836–850 CrossRef CAS.
- I. G. V. Uitert, Characterization of Energy Transfer Interactions between Rare Earth Ions, J. Electrochem. Soc., 1967, 114, 1048–1053 CrossRef.
- R.-J. Xie, H. T. Bert Hintzen and D. Johnson, Optical Properties of (Oxy)Nitride Materials: A Review, J. Am. Ceram. Soc., 2013, 96(3), 665–687 CrossRef CAS.
- P. Dorenbos, Thermal quenching of Eu2+ 5d–4f luminescence in inorganic compounds, J. Phys.: Condens. Matter, 2005, 17(50), 8103–8111 CrossRef CAS.
- R. B. Jabbarov, C. Chartier, B. G. Tagiev, O. B. Tagiev, N. N. Musayeva and C. Barthou, et al., Radiative properties of Eu2+ in BaGa2S4, J. Phys. Chem. Solids, 2005, 66(6), 1049–1056 CrossRef CAS.
- B. Wang, Y. G. Liu, Z. Huang, M. Fang and X. Wu, Discovery of novel solid solution Ca3Si3−xO3+xN4−2x:Eu2+ phosphors: structural evolution and photoluminescence tuning, Sci. Rep., 2017, 7(1), 18103 CrossRef PubMed.
- F. Kang, M. Peng, D. Y. Lei and Q. Zhang, Recoverable and Unrecoverable Bi3+-Related Photoemissions Induced by Thermal Expansion and Contraction in LuVO4:Bi3+ and ScVO4:Bi3+ Compounds, Chem. Mater., 2016, 28(21), 7807–7815 CrossRef CAS.
- J. Han, L. Li, M. Peng, B. Huang, F. Pan and F. Kang, et al., Toward Bi3+ Red Luminescence with No Visible Reabsorption through Manageable Energy Interaction and Crystal Defect Modulation in Single Bi3+-Doped ZnWO4 Crystal, Chem. Mater., 2017, 29(19), 8412–8424 CrossRef CAS.
| This journal is © The Royal Society of Chemistry 2018 |

