 Open Access Article
Creative Commons Attribution 3.0 Unported Licence
Luminescent properties of Eu3+-activated Gd2ZnTiO6 double perovskite red-emitting phosphors for white light-emitting diodes and field emission displays†
Soo Hyun Lee ,
Youngjin Cha,
Hyosung Kim,
Seungmoo Lee and
Jae Su Yu
 *
*
Department of Electronic Engineering, Kyung Hee University, Yongin-si, Gyeonggi-do 17104, Republic of Korea. E-mail: jsyu@khu.ac.kr; Fax: +82 31 204 8115; Tel: +82 31 201 3820
First published on 21st March 2018
Abstract
We synthesized a series of double perovskite Eu3+-activated Gd2ZnTiO6 red-emitting phosphors by a solid-state reaction route and analyzed their morphology, crystallinity, luminescent properties, and thermal stability. Under 270 nm of excitation, the prominent emission peak of the phosphors was found to be located in the red region with the central wavelength of 613 nm corresponding to the intra-4f transition of Eu3+ ions from the 5D0 to 7F2 level. The optimum concentration of the activator was determined to be 7 mol%. The studied phosphors also exhibited good thermal stability with the activation energy of 0.233 eV. The white color emitted from the ultraviolet (UV) light-emitting diode device which was coated by commercial blue-/green-emitting phosphors and Gd1.86ZnTiO6:0.14Eu3+ phosphors exhibited a high color rendering index of 82.9. Furthermore, the cathodoluminescence performance of the resultant phosphors was also investigated in detail. These characteristics of Gd2−2xZnTiO6:2xEu3+ phosphors make them potential candidates for UV-based white light-emitting diodes and field emission displays.
1. Introduction
Currently, phosphor-converted white light-emitting diodes (WLEDs) have been extensively adopted in various solid-state lighting applications due to their superior characteristics such as high efficiency, energy saving, long lifetime, and environmental friendliness compared to the conventional incandescent and fluorescent light bulbs.1–14 Commonly, the strategy to design commercial WLEDs is the combination of InGaN blue LEDs and Y3Al5O12:Ce3+ yellow-emitting phosphors. However, the white light obtained from this configuration possesses a low color rendering index (CRI < 80) due to the lack of red component, leading to the restriction of their use in practical applications.3–5 To overcome this issue, new designs for white colors emitted from blends of tricolor (red, green, and blue) phosphors excited by ultraviolet (UV) chips have been developed.6–14 Since these tricolor-phosphors-based WLEDs exhibit excellent CRI (>80) and high conversion efficiency, the exploration of luminescent materials is a big challenge. In particular, although several highly efficient red-emitting phosphors have been investigated, there are still some technical limitations such as complexity in synthetic processes, harsh environment, and high cost. Therefore, the development of novel and high-performance red-emitting phosphors pumped by UV light is significantly demanded.Up to date, lots of inorganic materials, such as molybdates, tungstates, titanates, oxides, and silicates, have been successfully developed for luminescent host materials.15–20 Especially, doubly ordered perovskites, with the general formula of AA′BB′O6, A2BB′O6, and AB1/3B′2/3O3, have attracted great attention due to their stable crystalline structure and high thermal stability which make them suitable for luminescent host materials.21–25 Among them, Gd2ZnTiO6 has been recently reminded due to the discovery of its monoclinic structure.26–28 Previously, the announced crystal structure of Gd2ZnTiO6 was only orthorhombic. Das et al. synthesized the monoclinically distorted perovskites (i.e., A2ZnTiO6 (A = Pr, Gd)) via the solid-state reaction method.26 They refined the lattice parameters and found the completed order of B site cations (Zn and Ti) in Gd2ZnTiO6. Chen et al. reported that the Mn4+ ions were expected to occupy the sites of Ti4+ ions in the Gd2ZnTiO6 host lattice and the resultant compounds can emit bright red emission.27 Furthermore, it was also demonstrated that the Gd2ZnTiO6:Mn4+/Er3+ phosphors were promising luminescent materials for simultaneous upconversion and downconversion emissions.28 Although many admirable results have been achieved in the rare-earth doped Gd2ZnTiO6, more efforts are still needed to further investigate the luminescent properties of Gd2ZnTiO6.
As is known, the Eu3+ ions, as a part of the rare-earth ions, have been widely used to obtain red emission. Generally, Eu3+ ions show two typical emissions, namely, yellow emission at around 591 nm (5D0 → 7F1) and red emission at about 613 nm (5D0 → 7F2).29–31 On the basis of previous literatures, it is evident that the dominant emission of Eu3+ ions in the double perovskite structure materials was decided by doping sites and lattice structure of host material.25,32 When Eu3+ ions substitute B sites (center of octahedron) and A sites with centrosymmetry (e.g., pseudo-cubic), the 5D0 → 7F1 transition becomes dominant, while the 5D0 → 7F2 transition is dominant when the Eu3+ ions occupy the A sites with non-centrosymmetry (e.g., monoclinic). Thus, it could be expected that vivid red emission is generated from Eu3+-activated monoclinic Gd2ZnTiO6 (Gd2ZnTiO6:Eu3+) phosphors. Furthermore, the Eu3+ ions can be selected as a proper activator in Gd2ZnTiO6 lattice because the ionic radius of Eu3+ (1.29 Å, coordinate number (CN) = 12) is almost similar to that of Gd3+ (1.27 Å, CN = 12), leading to no significant crystalline and phase distortions after doping. In this work, thus, the Gd2ZnTiO6:Eu3+ red-emitting phosphors were prepared via a high-temperature solid-state reaction method. The morphological properties were observed by using a field-emission scanning electron microscope (FE-SEM). The phase and crystalline properties were examined by using an X-ray diffractometer and a transmission electron microscope (TEM). Their luminescent properties and temperature dependency were also investigated. The optimum products were applied in WLED applications. For multifunctional purpose, their cathodoluminescence (CL) properties were investigated under different operating conditions for field emission display (FED) systems.
2. Experimental details
The Gd2−2xZnTiO6:2xEu3+ red-emitting phosphors with various Eu3+ concentrations (x = 0.01, 0.03, 0.05, 0.07, 0.09, and 0.11) were synthesized via a high-temperature solid-state reaction technique. The gadolinium(III) oxide (Gd2O3, 99.9%), zinc oxide (ZnO, ≥99.0%), titanium(IV) oxide (TiO2, ≥99%), and europium(III) oxide (Eu2O3, 99.5%) were purchased from Sigma Aldrich Co. and used as precursors with no further purification. The raw materials with stoichiometric amounts were mixed and grinded together in an agate mortar for 10 min to obtain a homogeneous composition and then they were successively placed into alumina crucibles in a muffle furnace. Under an atmospheric environment, all the as-prepared samples were calcined with a two-step temperature profile. In the first step, the temperature was linearly increased up to 900 °C with a ratio of 5 °C min−1 and kept for 8 h. Next, it reached to 1200 °C with a ratio of 5 °C min−1 and maintained for 6 h. After the process, the final products of Gd2−2xZnTiO6:2xEu3+ phosphors were naturally cooled down to room temperature.The morphological characteristics and elemental mapping of Gd2−2xZnTiO6:2xEu3+ phosphors were observed by employing a FE-SEM (LEO SUPRA 55, Carl Zeiss) equipped with the energy dispersive X-ray (EDX) spectroscopy system. The crystalline properties of Gd2−2xZnTiO6:2xEu3+ phosphors were investigated by using a X-ray diffractometer (M18XHF-SRA, Mac Science) with Cu Kα (λ = 1.5406 Å) radiation and a TEM (JEM-2100F, JEOL). The room-temperature photoluminescence (PL) excitation (PLE) and PL emission spectra of Gd2−2xZnTiO6:2xEu3+ phosphors were examined by utilizing a spectrofluorometer (Scinco FluroMateFS-2) and the temperature-dependent PL emission spectra were measured in the temperature range of 303–483 K with an interval of 20 K using a temperature controlled stage (NOVAST540). The fluorescence spectrophotometer (Photon Technology International fluorimeter) attached with a Xe flash lamp of 25 W power was used to measure the decay curve. The absorption spectrum of the optimum phosphor was recorded by using a V-670 (JASCO) UV-vis spectrophotometer. Their CL properties were also taken by using a Gatan (UK) MonoCL3 system attached with the SEM (Hitachi S-4300 SE).
3. Results and discussion
Fig. 1 shows the X-ray diffraction (XRD) patterns of the Gd2−2xZnTiO6:2xEu3+ (x = 0.01, 0.03, 0.05, 0.07, 0.09, and 0.11) phosphors in the 2θ range of 15–75°. Since the monoclinic Gd2ZnTiO6 has been recently reported, there is no standard information yet. The refinement parameters of monoclinic Gd2ZnTiO6 were calculated by Das et al. and Chen et al. using a FullProf program, which were used as the ref. 26 and 27. For all the Gd2−2xZnTiO6:2xEu3+ phosphors, as shown in Fig. 1, the diffraction peaks were consistent to its monoclinic phase with a space group of P21/n (no. 14). No other peaks were observed, indicating a pure phase of Gd2ZnTiO6. With the introduction of Eu3+ ions, no peaks were significantly shifted, implying the successful doping of Eu3+ ions into the Gd2ZnTiO6 host lattice, which was also able to be confirmed from a tolerance factor (τ). The τ of double perovskite group (A2BB′O6) can be calculated by using the equation:33
 | (1) |
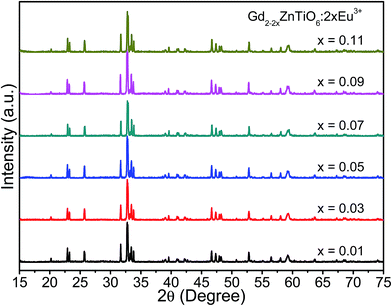 | ||
| Fig. 1 XRD patterns of the Gd2−2xZnTiO6:2xEu3+ (x = 0.01, 0.03, 0.05, 0.07, 0.09, and 0.11) phosphors in the 2θ range of 15–75°. | ||
Fig. 2 shows the surface morphologies of the Gd2−2xZnTiO6:2xEu3+ (x = 0.01, 0.03, 0.05, 0.07, 0.09, and 0.11) phosphors. It is found that the morphologies were independent of doping concentration. The particles exhibited the non-uniform shapes with an average size of 2 μm and large aggregations. This was attributed to the high-temperature treatment in solid-state reaction technique.
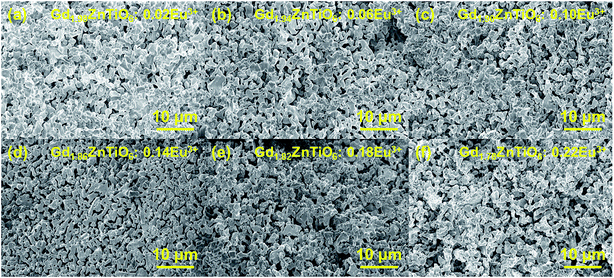 | ||
| Fig. 2 Surface morphologies of the Gd2−2xZnTiO6:2xEu3+ (x = (a) 0.01, (b) 0.03, (c) 0.05, (d) 0.07, (e) 0.09, and (f) 0.11) phosphors. | ||
Fig. 3 shows the (a) TEM image, (b) selected area electron diffraction (SAED) pattern, (c) SEM image, (d–h) elemental mapping images, and (i) EDX spectrum of the Gd1.86ZnTiO6:0.14Eu3+ phosphor. The aligned dot patterns were confirmed in the SAED pattern, which obviously indicates the high-quality single crystalline nature of particle. From the elemental mapping results, the uniform contribution of constituent elements (Gd, Zn, Ti, O, and Eu) was also observed. The qualitative information of phosphor was represented in its EDX spectrum. Apart from Gd, Zn, Ti, O, and Eu, no other peaks were detected, further confirming the completion of Eu3+-activated Gd2ZnTiO6 phosphors.
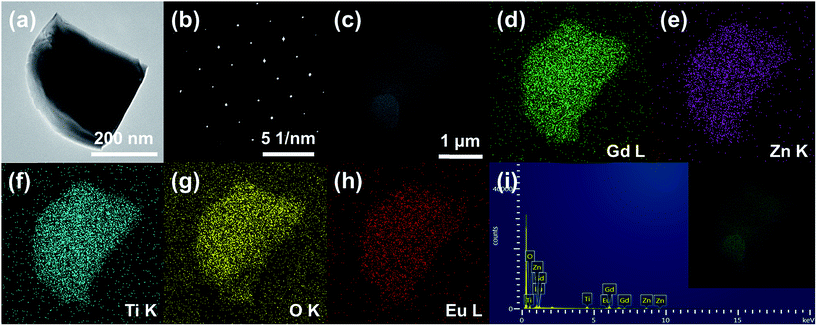 | ||
| Fig. 3 (a) TEM image, (b) SAED pattern, (c) SEM image, (d–h) elemental mapping images, and (i) EDX spectrum of the Gd1.86ZnTiO6:0.14Eu3+ phosphor. | ||
Fig. 4(a) shows the typical PLE and PL emission spectra of the Gd1.86ZnTiO6:0.14Eu3+ phosphor. The PLE spectrum was recorded in the wavelength range of 200–500 nm while the PL emission spectrum was measured at the wavelengths of 500–750 nm. As for the PLE spectrum (λem = 613 nm), one broadband and several narrow peaks were observed. The broadband with a center wavelength of 270 nm was attributed to the electron transfer from the 2p orbit of O2− ions to the 4f orbit of Gd3+ and Eu3+ ions, i.e., as-called the charge transfer (CT) band. The other peaks at 362, 377, 384, 396, 416, and 464 nm belonged to the transitions of 7F0 → 5D4, 7F0 → 5G2, 7F0 → 5G3, 7F0 → 5L6, 7F0 → 5D3, and 7F0 → 5D2 of Eu3+ ions, respectively.22,23 From the result, the absorption in CT band was much higher than that of Eu3+ ions, suggesting that the UV light can act as the light source for the studied samples. The PL emission spectrum was measured under the illumination at 270 nm. The typical peaks of Eu3+ ions were detected at 535 nm (5D1 → 7F1), 591 nm (5D0 → 7F1), 613 nm (5D0 → 7F2), 656 nm (5D0 → 7F3), and 703 nm (5D0 → 7F4).35–38 The PL emission spectrum at 396 nm also exhibited the same characteristics, leading to that the Gd2−2xZnTiO6:2xEu3+ phosphors are a promising candidate for practical applications with near-UV (NUV) LEDs (Fig. S1†). In general, the 5D0 → 7F1 transition is allowed by the magnetic dipole, while the 5D0 → 7F2 transition is allowed by the forced electrical dipole. The magnetic dipole is not sensitive to the local environment as well as the crystal field, while the forced electrical dipole is.25,35,39 Clearly, in present work, the emission intensity at 613 nm was obviously larger than that at 591 nm. Thus, this phenomenon implies that the Eu3+ ions were located onto the sites without inversion symmetry in host material.
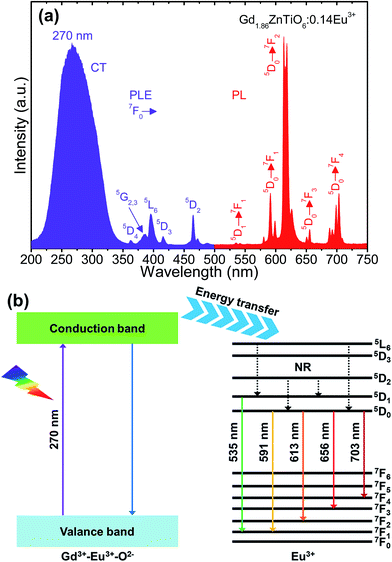 | ||
| Fig. 4 (a) PLE and PL emission spectra of the Gd1.86ZnTiO6:0.14Eu3+ phosphor and (b) energy level diagram of the Gd2ZnTiO6 host material and Eu3+ ions. | ||
For better comprehension of luminescent mechanism of Gd2−2xZnTiO6:2xEu3+ phosphors, the energy level diagram of the Gd2ZnTiO6 host material and Eu3+ ions was simply demonstrated in Fig. 4(b). When the powders are exposed to UV light of which range corresponds to the CT band, especially at 270 nm, electron–hole pairs are generated in the Gd2ZnTiO6 host material. The excited electrons move from the valance to conduction band. Next, the energy is transferred to the 5L6 level of Eu3+ ions and then non-radiatively transited downward to the 5D1 and 5D0 levels. At last, the radiative transitions to the ground states (7FJ, J = 1, 2, 3, and 4) were performed, leading to the formation of characteristic emissions of Eu3+ ions.
Fig. 5 shows the PL emission spectra of the Gd2−2xZnTiO6:2xEu3+ (x = 0.01, 0.03, 0.05, 0.07, 0.09, and 0.11) phosphors. Under different doping concentrations, the spectral shapes and peak positions were almost consistent. The PL emission intensity at 613 nm was dramatically increased along the doping concentration and its highest value was achieved at x = 0.07. Beyond the optimum concentration (x > 0.07), the emission intensity was gradually decreased. Obviously, the distance between Eu3+ ions becomes smaller at higher doping concentration. When the Eu3+ ions are much closer one another, the cross relaxation with NR energy transfer occurs, leading to the lower efficiency.40,41 This concentration quenching can be related to either the exchange interaction or multipole interaction.42,43 Herein, the critical distance (Rc) could be roughly used to state the dominant mechanism for concentration quenching effect. For Rc < 5 Å, it is considered that the exchange interaction is dominant in the concentration quenching mechanism, otherwise the multipole interaction takes the domination. The Rc is evaluated by the equation proposed by Blasse and Bril:44,45
 | (2) |
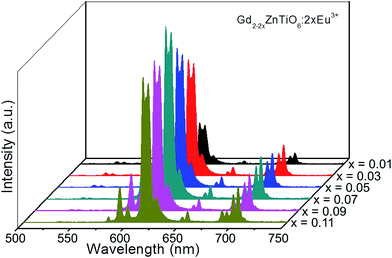 | ||
| Fig. 5 PL emission spectra of the Gd2−2xZnTiO6:2xEu3+ (x = 0.01, 0.03, 0.05, 0.07, 0.09, and 0.11) phosphors. | ||
To explore the potential application of the as-fabricated phosphors for WLEDs, the thermal stability was evaluated. Fig. 6 shows the (a) temperature-dependent PL emission spectra in the temperature range of 303–483 K with an interval of 20 K and (b) plot of ln(I0/I − 1) versus 1/T of the Gd1.86ZnTiO6:0.14Eu3+ phosphor. The PL emission intensity was decreased as the temperature was elevated, as presented in Fig. 6(a). The thermal stability of phosphors can be evaluated by the quenching temperature at which the half of initial PL intensity is observed. For the Gd1.86ZnTiO6:0.14Eu3+ phosphor, the PL emission intensity at 423 K with respect to that at 303 K was decreased by 51.7% due to the thermal quenching effect. For further understanding the involved thermal quenching phenomenon, the activation energy (ΔE) was calculated utilizing the Arrhenius equation:46
 | (3) |
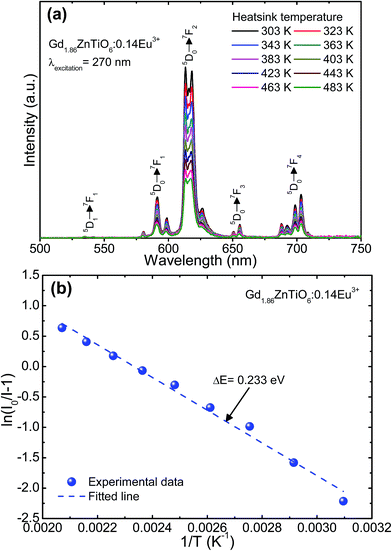 | ||
| Fig. 6 (a) Temperature-dependent PL emission spectra in the temperature range of 303–483 K with an interval of 20 K and (b) plot of ln(I0/I − 1) versus 1/T of the Gd1.86ZnTiO6:0.14Eu3+ phosphor. | ||
Fig. 7 shows the (a) absorption spectrum and (b) plot of (αhν)2 versus photon energy of the Gd1.86ZnTiO6:0.14Eu3+ phosphor. As shown in Fig. 7(a), the strong and wide absorption region was found in the wavelength range below 300 nm, which was assigned to the CT band, while these narrow peaks at 396 and 464 nm belonged to the Eu3+ ions. This behavior is in good agreement with the PLE spectrum as shown in Fig. 4(a). Furthermore, the optical band gap, Eg, can be roughly evaluated by following the Wood and Tauc relation:51
| (ahν)2 ≈ A(hν − Eg), | (4) |
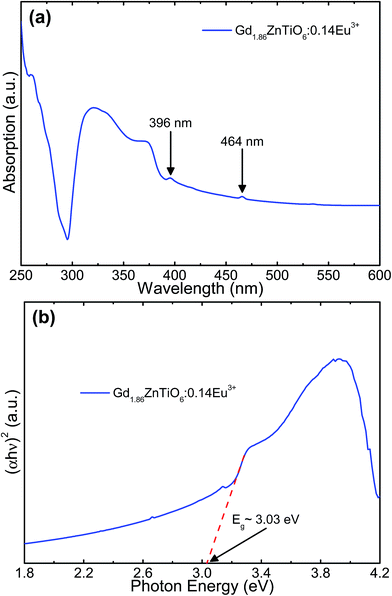 | ||
| Fig. 7 (a) Absorption spectrum and (b) plot of (αhν)2 versus photon energy of the Gd1.86ZnTiO6:0.14Eu3+ phosphor. | ||
Fig. 8(a) shows the luminescence decay curve of the Gd1.86ZnTiO6:0.14Eu3+ phosphor. The decay curve for the 5D0 → 7F2 transition (613 nm) of Eu3+ ions was fitted using a single exponential function which is expressed as:
I = I0![[thin space (1/6-em)]](https://www.rsc.org/images/entities/char_2009.gif) exp(−t/τ) + A, exp(−t/τ) + A,
| (5) |
 | (6) |
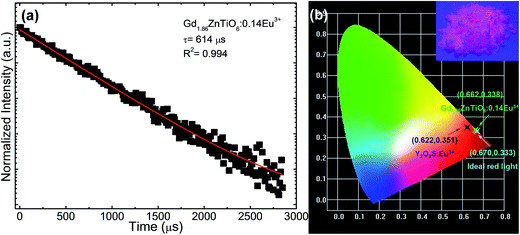
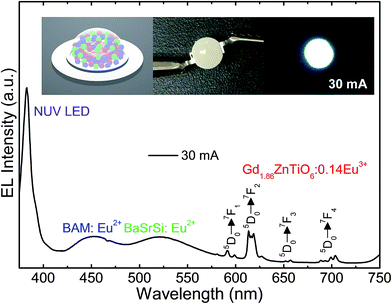
For the purpose of exploring the potential application of the studied samples for indoor illumination, an NUV chip-based WLED device, which consisted of combination of UV LED (λ ∼ 385 nm), commercial blue-emitting (BAM:Eu2+, i.e., BaMgAl10O17:Eu2+) and green-emitting (BaSrSi:Eu2+, i.e., (Ba, Sr)2SiO4:Eu2+) phosphors, and Gd1.86ZnTiO6:0.14Eu3+ red-emitting phosphor, was prepared. Fig. 9 shows the EL spectrum of the WLED device at the injection current of 30 mA under continuous-wave mode. The schematic illustration of the as-fabricated WLED was demonstrated in the inset of Fig. 9. Under the 30 mA of forward bias current, the clearly distinguishable tricolor bands and peaks were observed. In particular, all the characteristic peaks of Eu3+ ions were found without any distortion compared to the PL spectra of Gd1.86ZnTiO6:0.14Eu3+ phosphor (see Fig. 4). Under the forward bias current of 30 mA, the fabricated LED device emitted bright white light with high CRI value of 82.9. The photographs of WLED before/after the current injection are also shown in the inset of Fig. 9. This result strongly implies that the Eu3+-activated Gd2ZnTiO6 red-emitting phosphors were a promising candidate for practical WLED industry.
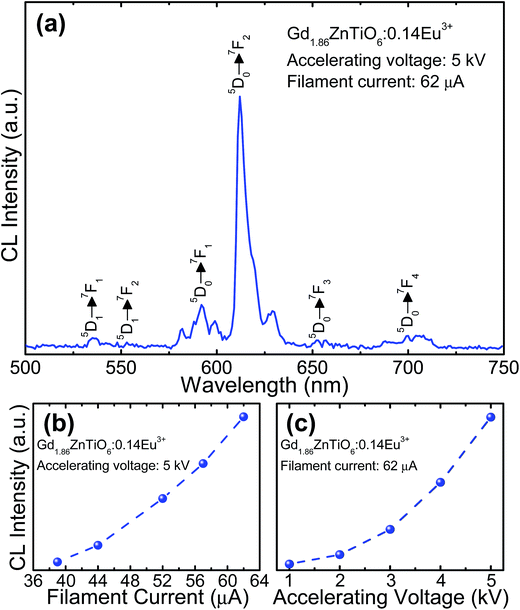
For the development of novel and efficient red phosphors in FED application, the CL properties of the prepared phosphors were systematically explored. Fig. 10 shows the (a) CL spectrum of the powder under the filament current of 62 μA at the accelerating voltage of 5 kV, and CL intensities (b) under different filament currents when the accelerating voltage was fixed at 5 kV and (c) under different accelerating voltages when the filament current was fixed at 62 μA. As shown in Fig. 10(a), the studied samples exhibited the characteristic emissions of Eu3+ ions and the emission originating from the 5D0 → 7F2 transition was dominated in the CL spectrum, which coincided well with the PL spectrum. Furthermore, according to the Fig. 10(b) and (c), it is evident that the CL intensity was continuously and gradually increased by increasing the filament current and accelerating voltage without exhibiting any significant saturation tendency. In both cases, the electron energy was also increased, leading to the larger electron beam current density and deeper penetration depth.35,55,56 Under these circumstances, the Eu3+ ions could be easily excited, finally resulting in the stronger emission intensity. In addition, based on the detected CL spectrum, the CIE coordinate was found to be (0.593, 0.399) which was located in the edge of the red region. Thus, it is noticeable that the resultant phosphor could be applied not only in WLED applications but also in FED systems.
4. Conclusions
The double-perovskite Gd2−2xZnTiO6:2xEu3+ phosphors with high single crystallinity were successfully synthesized via the solid-state reaction technique. Under the irradiation of 270 nm, the vivid red colors were emitted due to the 4f–4f transitions of Eu3+ ions. Since the intensity of 5D0 → 7F2 transition was the highest, it is recognizable that the Eu3+ ions occupied the crystallographic sites with non-inversion symmetry in the Gd2ZnTiO6 host lattice. Beyond the optimal doping concentration at x = 0.07, the concentration quenching occurred due to the multipole interaction. Furthermore, the Eu3+-activated Gd2ZnTiO6 phosphors did not only exhibited good color coordinate but also possessed high color purity of 96.8%. The studied samples possessed good thermal stability with high ΔE value of 0.233 eV. With the help of the prepared samples, a WLED device was prepared and it can emit bright white light with the high CRI value of 82.9. Additionally, the powders also revealed the excellent CL properties under various circumstances. These results suggest that the Gd2−2xZnTiO6:2xEu3+ phosphors can be served as promising candidates in both WLED and FED applications.Conflicts of interest
There are no conflicts to declare.Acknowledgements
This work was supported by the National Research Foundation of Korea (NRF) grant funded by the Korean government (MSIP) (No. 2017R1A2B4011998).References
- M. Koike, N. Shibata, H. Kato and Y. Takahashi, IEEE J. Sel. Top. Quantum Electron., 2002, 8, 271–277 CrossRef CAS.
- F. M. Steranka, J. Bhat, D. Collins, L. Cook, M. G. Craford, R. Fletcher, N. Gardner, P. Grillot, W. Goetz, M. Keuper, R. Khare, A. Kim, M. Krames, G. Harbers, M. Ludowise, P. S. Martin, M. Misra, G. Mueller, R. Mueller-Mach, S. Rudaz, Y.-C. Shen, D. Steigerwald, S. Stockman, S. Subramanya, T. Trottier and J. J. Wierer, Phys. Status Solidi A, 2002, 194, 380–388 CrossRef CAS.
- C.-Y. Yang, S. Som, S. Das and C.-H. Lu, Sci. Rep., 2017, 7, 45832 CrossRef CAS PubMed.
- S. K. Hussain and J. S. Yu, RSC Adv., 2017, 7, 13281–13288 RSC.
- M. Peng, X. Yin, P. A. Tanner, M. G. Brik and P. Li, Chem. Mater., 2015, 27, 2938–2945 CrossRef CAS.
- L. Li, J. Shen, Y. Pan, X. Zhou, H. Huang, W. Chang, Q. He and X. Wei, Mater. Res. Bull., 2016, 78, 26–30 CrossRef CAS.
- G. Dong, C. Hou, Z. Yang, P. Liu, C. Wang, F. Lu and X. Li, Ceram. Int., 2014, 40, 14787–14792 CrossRef CAS.
- C.-H. Chiang, Y.-C. Fang, H.-Y. Lin and S.-Y. Chu, Ceram. Int., 2017, 43, 4353–4356 CrossRef CAS.
- P. Dai, S.-P. Lee, T.-S. Chan, C.-H. Huang, Y.-W. Chiang and T.-M. Chen, J. Mater. Chem. C, 2016, 4, 1170–1177 RSC.
- M. Dalal, V. B. Taxak, S. Chahar, A. Khatkar and S. P. Khatkar, J. Phys. Chem. Solids, 2016, 89, 45–52 CrossRef CAS.
- S. H. Lee, P. Du, L. K. Bharat and J. S. Yu, Ceram. Int., 2017, 43, 4599–4605 CrossRef CAS.
- Y. Zeng, K. Qiu, Z. Yang, Y. Bu, W. Zhang and J. Lia, Ceram. Int., 2017, 43, 830–834 CrossRef CAS.
- Y. Chen, K. Wu, J. He, Z. Tang, J. Shi, Y. Xu and Z.-Q. Liu, J. Mater. Chem. C, 2017, 5, 8828–8835 RSC.
- Z.-B. Tang, C.-L. Xu, X.-R. Wei, X.-G. Zhang and Y.-B. Chen, J. Alloys Compd., 2017, 695, 2745–2750 CrossRef CAS.
- P. Du and J. S. Yu, Sci. Rep., 2017, 7, 11953 CrossRef PubMed.
- P. Du and J. S. Yu, Chem. Eng. J., 2017, 327, 109–119 CrossRef CAS.
- N. Zhang, J. Zheng, J. Gao, Y. Wu, R. Zhang, T. Li and C. Guo, Dyes Pigm., 2017, 136, 601–611 CrossRef CAS.
- S. Huang, J. Li, X. Wang, Q. Zhu and X. Sun, Chem. Eng. J., 2016, 306, 322–329 CrossRef CAS.
- K. Li, S. Liang, H. Lian, M. Shang, B. Xing and J. Lin, J. Mater. Chem. C, 2016, 4, 3443–3453 RSC.
- G. Liu, Z. Fu, T. Sheng, Z. Sun, X. Zhang, Y. Wei, L. Ma, X. Wang and Z. Wu, RSC Adv., 2016, 6, 97676–97683 RSC.
- Y. Guo, B. K. Moon, B. C. Choi, J. H. Jeong and J. H. Kim, Mater. Res. Bull., 2017, 88, 166–173 CrossRef CAS.
- Q. Liu, L. Wang, W. Huang, X. Li, M. Yu and Q. Zhang, Ceram. Int., 2018, 44, 1662–1667 CrossRef CAS.
- P. Chen, D. Yang, W. Hu, J. Zhang and Y. Wu, Chem. Phys. Lett., 2017, 689, 169–173 CrossRef CAS.
- N. Ding, L. Zhang, Q. Liu, T. Xu and Q. Zhang, J. Mater. Sci., 2017, 28, 12239–12245 CAS.
- R. Yu, C. Wang, J. Chen, Y. Wu, H. Li and H. Ma, ECS J. Solid State Sci. Technol., 2014, 3, R33–R37 CrossRef CAS.
- N. Das, M. A. Nath, G. S. Thakur, M. Thirumal and A. K. Ganguli, J. Solid State Chem., 2015, 229, 97–102 CrossRef CAS.
- H. Chen, H. Lin, Q. Huang, F. Huang, J. Xu, B. Wang, Z. Lin, J. Zhou and Y. Wang, J. Mater. Chem. C, 2016, 4, 2374–2381 RSC.
- J. Liao, Q. Wang, H.-R. Wen, H. Yuan, S.-J. Liu, J. Fu and B. Qiu, J. Mater. Chem. C, 2017, 5, 9098–9105 RSC.
- P. Du, X. Huang and J. S. Yu, Chem. Eng. J., 2018, 337, 91–100 CrossRef CAS.
- J. Zhou, Z. Xia, M. Bettinelli and Q. Liu, RSC Adv., 2016, 6, 2046–2054 RSC.
- J. Zhong, D. Chen, Y. Zhou, Z. Wan, M. Ding, W. Bai and Z. Ji, Dalton Trans., 2016, 45, 4762–4770 RSC.
- N. Xiao, J. Shen, T. Xiao, B. Wu, X. Luo, L. Li, Z. Wang and X. Zhou, Mater. Res. Bull., 2015, 70, 684–690 CrossRef CAS.
- T. T. Deng, E. H. Song, Y. Y. Zhou, L. Y. Wang and Q. Y. Zhang, J. Mater. Chem. C, 2017, 5, 12422–12429 RSC.
- R. Phatak, S. K. Gupta, K. Krishnan, S. K. Sali, S. V. Godbole and A. Das, Dalton Trans., 2014, 43, 3306–3312 RSC.
- P. Du and J. S. Yu, RSC Adv., 2015, 5, 60121–60127 RSC.
- H. Deng, Z. Gao, N. Xue, J. H. Jeong and R. Yu, J. Lumin., 2017, 192, 684–689 CrossRef CAS.
- J. Zhao, C. Guo, T. Li, X. Su, N. Zhang and J. Chen, Dyes Pigm., 2016, 132, 159–166 CrossRef CAS.
- R.-Y. Yanga, Y.-M. Peng, H.-L. Lai, Y.-K. Su and S.-J. Chang, Ceram. Int., 2017, 43, S682–S687 CrossRef.
- Q. Liu, X. Li, B. Zhang, L. Wang, Q. Zhang and L. Zhang, Ceram. Int., 2016, 42, 15294–15300 CrossRef CAS.
- O. Meza, E. G. Villabona-Leal, L. A. Diaz-Torres, H. Desirena, J. L. Rodríguez-López and E. Pérez, J. Phys. Chem. A, 2014, 118, 1390–1396 CrossRef CAS PubMed.
- J. Zhang, Y. Yang, Y. Liu, C. Mi, G. Li, B. Han, Y. Zhang and H. J. Seo, J. Am. Ceram. Soc., 2015, 98, 1567–1573 CrossRef CAS.
- M. Xin, D. Tu, H. Zhu, W. Luo, Z. Liu, P. Huang, R. Li, Y. Cao and X. Chen, J. Mater. Chem. C, 2015, 3, 7286–7293 RSC.
- Y. Jia, R. Pang, H. Li, W. Sun, J. Fu, L. Jiang, S. Zhang, Q. Su, C. Li and R.-S. Liu, Dalton Trans., 2015, 44, 11399–11407 RSC.
- G. Blasse, J. Solid State Chem., 1986, 62, 207–211 CrossRef CAS.
- G. Blasse and A. Bril, J. Chem. Phys., 1969, 51, 3252–3254 CrossRef CAS.
- C. Zhao, Z. Xia and S. Yu, J. Mater. Chem. C, 2014, 2, 6032–6039 RSC.
- P. Du and J. S. Yu, J. Lumin., 2016, 179, 451–456 CrossRef CAS.
- C. Wang, Y. Jin, Y. Lv, G. Ju, L. Chen, Z. Li and Y. Hu, J. Lumin., 2017, 192, 337–342 CrossRef CAS.
- X. Huang, H. Guo and B. Li, J. Alloys Compd., 2017, 720, 29–38 CrossRef CAS.
- L. K. Bharat, S. R. Dugasani, G. S. R. Raju and J. S. Yu, Nanotechnology, 2017, 28, 375601 CrossRef PubMed.
- D. L. Wood and J. Tauc, Phys. Rev. B, 1972, 5, 3144–3151 CrossRef.
- S. Som, A. K. Kunti, V. Kumar, V. Kumar, S. Dutta, M. Chowdhury, S. K. Sharma, J. J. Terblans and H. C. Swart, J. Appl. Phys., 2014, 115, 193101 CrossRef.
- P. Du, Y. Guo, S. H. Lee and J. S. Yu, RSC Adv., 2017, 7, 3170–3178 RSC.
- X. Huang, B. Li, H. Guo and D. Chen, Dyes Pigm., 2017, 143, 86–94 CrossRef CAS.
- Q. Long, C. Wang, Y. Li, J. Ding and Y. Wang, J. Alloys Compd., 2016, 671, 372–380 CrossRef CAS.
- G. Li, Y. Wang, W. Zeng, W. Chen, S. Han, H. Guo and Y. Li, J. Mater. Chem. C, 2016, 4, 3304–3312 RSC.
Footnote |
| † Electronic supplementary information (ESI) available. See DOI: 10.1039/c8ra00700d |
| This journal is © The Royal Society of Chemistry 2018 |

