 Open Access Article
Investigation into THF hydrate slurry flow behaviour and inhibition by an anti-agglomerant
Hao Zhang ,
Jianwei Du*,
Yanhong Wang,
Xuemei Lang,
Gang Li,
Jianbiao Chen and
Shuanshi Fan
 *
*
Key Laboratory of Enhanced Heat Transfer and Energy Conservation, Ministry of Education, School of Chemistry and Chemical Engineering, South China University of Technology, Guangzhou 510640, China. E-mail: ssfan@scut.edu.cn; jianwei.du@hotmail.com; Fax: +86-20-22236581; Tel: +86-20-22236581
First published on 27th March 2018
Abstract
Hydrate plugs are one of the highest risks for gas and oil transportation in pipelines, especially in deep sea environments. In a newly built-up loop, pilot-scale experiments were carried out to study typical hydrate plug phenomena and to explore the specific reasons behind these. A tetrahydrofuran (THF) hydrate slurry was formed and investigated in this loop fluid at two liquid loadings (50 vol% and 100 vol%) with/without a typical anti-agglomerant, KL-1. Morphology and temperature variations revealed that THF hydrate slurry evolution had four stages: (a) flowable fluid; (b) particle formation; (c) agglomeration; and (d) plug. The effect of liquid loading (LL) and an anti-agglomerant (AA) on morphology and temperature in three cases were studied. The morphologies in each stage were compared for the three cases. Hydrate conversion was calculated according to the liquid and solid volume proportion in these morphologies. From these morphologies, heterogeneous hydrate deposition was found to be more likely to happen in 50 vol% than in the 100 vol% LL system. The hydrate plug was also found to be induced by hydrate deposition rather than the bed at the bottom of the pipeline. By dispersing hydrate particle agglomeration, AA compressed hydrate deposition and the plug.
1. Introduction
Gas hydrates are non-stoichiometric crystalline inclusion compounds with molecular cages of water surrounding certain gas molecules, such as methane, ethane and carbon dioxide.1 In the oil and gas industry, gas hydrates were commonly encountered in deep-sea oil and gas pipelines and led to severe operation and safety hazards,2,3 as temperature and pressure conditions thermodynamically preferred hydrate formation. In some typical cases, the rapid formation of hydrates in subsea environments can occlude the line and halt flow. The current strategy for hydrate flow assurance is transferring from full hydrate inhibition to risk management. The understanding of hydrate slurry plugs and the hydrate slurry morphology change process is necessary for risk management.The pipeline inner surface offers many nucleation sites and coldest points. Several experimental studies and field trials suggested that hydrate deposition often occurred on the pipeline wall.4,5 Hydrate plugs were assumed from changes in rheology such as sloughing and jamming. Knowledge of hydrate formation and flow behaviour is of importance to plug prevention in offshore operations. Researchers have spent a great deal of effort on developing this knowledge.6,7 Many studies focused on the changing trend of flow parameters (e.g., P, T, flow rate, pressure drop, hydrate particle size, inhibitor, hydrate formation induction, supercooling degree etc.8–12), and other studies focused on the relationship between supercooling degree and kinetic inhibitor concentration,13 but hydrate morphology evolvement and liquid stratification phenomena during the plugging process are less involved.
Nicholas et al.14 experimentally observed cyclopentane hydrates deposited on the pipeline wall in a single pass flow loop with gas-dissolved water. In this system, hydrates formed fast enough to generate hydrate deposition before forming transportable lumps. Hence, the wetting conditions of the pipeline wall were believed to be critical for the stickiness of hydrates onto the wall. Rao et al.15 measured methane hydrate film growth along a cold tube inside a high-pressure visual cell. The paper noted that the hydrate deposition thickness gradually reached a limit as the hydrate surface approached the hydrate equilibrium temperature. In the first 20 hours, 30–40% porosities dropped and then remained as constant values after 20 hours. Based on the established hydrate membrane growth model, hydrate deposition was found to be dependent on the heat transfer in the system rather than on hydrate structure.
Recently, fluid flow has been studied in the pipeline for observation of the changing processes, morphology of hydrate formation and deposition on the wall. Aspenes et al.16,17 compared several surfaces’ effects. The conclusion suggested that hydrates would not preferentially deposit on the pipeline wall without free water. This may indicate that hydrates forming from water droplets on the pipeline wall would prefer to stay attached to the wall and lead to deposition. The surface properties of the pipeline have an influence on hydrate deposition as well. This conclusion can be inferred from the measurement of adhesion force between hydrate particles and surfaces in previous studies.2,14,16,18 Chen et al.19 and Lin Ding et al.20 studied the morphology of natural gas + water + diesel oil with different water cuts and hydrate inhibitors, respectively. Chen et al. studied the flow character and multiphase fluids with a series of water cuts and with or without inhibitors. The paper concluded that the pressure drop decreased when hydrates initially formed at high water cuts. The pipeline remained flowable and no plugging occurred when hydrate volume fractions were less than 5%. When hydrate volume fractions were more than 10%, the flow loop would be at high hydrate plugging risk. Lin Ding et al.20 investigated the influence of hydrate formation on flow parameter and two flow pattern maps were made based on the experimental data. GuangChun Song et al.8 carried out experiments in a high-pressure flow loop for a natural gas + diesel oil + water system. They studied the character of hydrate formation and distribution in a series of flow velocities and water cuts.
The results showed that for low water cut systems, the bulk phase was the only site for hydrate formation. The hydrate mass fraction and hydrate distribution in the flow loop were key factors for the trend of flow rate and pressure drop. Hydrates would form in the whole flow loop when the conditions were satisfied. Two plugging conditions, a gradual plugging condition and a rapid plugging condition, were identified based on the calculated hydrate mass fraction. Both the gradual plugging condition and the rapid plugging condition had the same four formation stages.
Akhfash et al.21 proposed the relationship between the Reynolds number and hydrate volume fraction. Hydrate formation behaviour was studied for methane-water systems, over a range of shear conditions with initial Reynolds numbers ranging from 300 to 5000. At high shear rates the value of the hydrate volume fraction increased with the Reynolds number. Joshi et al.10 investigated the hydrate plugging mechanism in systems of different water cuts using a series of flow loop experiments and suggested that the onset of hydrate plugging formation was associated with the stabilization of a moving hydrate bed at the gas–water interface. Nicholas et al.4 used a single-pass flow loop to investigate hydrate/ice plugging and deposition mechanisms from water dissolved in a liquid condensate system. Two different hydrate/ice plugging mechanisms were observed: (1) a rapid pressure drop increase (>6.89 kPa h−1) was observed when the condensate was cooled down below the liquid water saturation curve; (2) uniform/dispersed deposition forming a dissolved water phase resulted in a slow pressure drop increase (<6.89 kPa h−1) throughout the first 12.2–24.4 m of the flow loop.
Table 1 shows previous studies on THF hydrate slurries. The phase equilibrium of THF hydrate was studied by Makino and Sugahara et al.22 Norland and Kelland,26 Zhang and Somasundaran et al.,23 Foo and Ruan et al.,29 and Sun and Peng et al.31 investigated the influence of inhibitors on THF hydrate growth and formation. Karamoddin and Varaminian28 and Oliveira and Segtovich et al.32 provided a growth model of the THF hydrate. Wang and Fan et al.,24 Delahaye and Fournaison et al.,25 Liu and Wang et al.27 and Silva and Naccache et al.30 discussed hydrate slurry crystal size, induction time, shear rate and flow behaviours of the THF slurry: flow curve, creep and oscillatory. However, to the best of our knowledge, research on the relationship between THF hydrate plug processes and morphology and LL is still missing in THF hydrate studies. In this paper, the effect of LL on THF hydrate flow morphology and plugs was investigated in a flow loop system.
| Authors | Outcomes |
|---|---|
| 2005, Makino and Sugahara et al.22 | Phase equilibria for the THF solution |
| 2008, Zhang and Somasundaran et al.23 | Relationship between THF hydrate induction and SDS adsorption at the hydrate/liquid interface |
| 2010, Wang and Fan et al.24 | Flow behaviours and the mechanism of hydrate blockages in pipelines |
| 2010, Delahaye and Fournaison et al.25 | Characterization of THF hydrate slurry crystal size distribution |
| 2012, Norland and Kelland26 | The effect of thermodynamic inhibitor on the crystal growth of THF hydrates |
| 2015, Liu and Wang et al.27 | Induction time for THF hydrate formation in porous media |
| 2015, Karamoddin and Varaminian28 | Model hydrate growth kinetics in THF–water mixtures |
| 2016, Foo and Ruan et al.29 | Adsorbability and inhibition performance of a kinetic inhibitor towards the THF hydrate |
| 2017, Silva and Naccache et al.30 | Studied the shear rate, flow curve, creep and oscillatory of hydrate slurries |
| 2017, Sun and Peng et al.31 | Stochastic nature of formation kinetic parameters |
| 2018, Oliveira and Segtovich et al.32 | Established model to describe vapor–liquid, liquid–hydrate and liquid–ice equilibria of THF and water |
2. Experimental
2.1 Chemicals
Tetrahydrofuran (THF) with a purity of 99.0% was supplied by Guangzhou CongYuan Chemical Co. Ltd, China. The AA (KL-1) was supplied by China University of Petroleum (Beijing).2.2 Apparatus
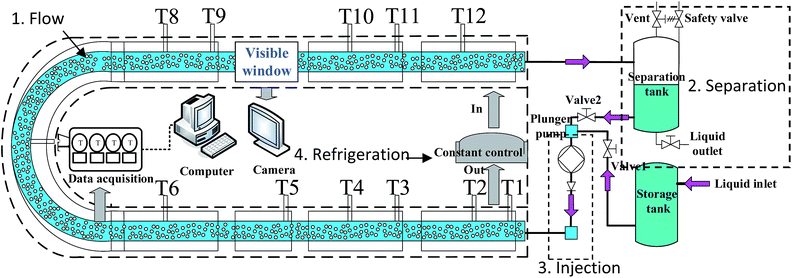
A schematic layout of the apparatus is shown in Fig. 1. The whole system contained four parts: (1) flow; (2) separation; (3) injection; (4) refrigeration. The flow part included multiphase flow in the U-bend pipe line. The separation part contained a separating tank and vent system. The injection part was where liquid was injected into the loop by a plunger pump. The refrigeration part included the U-bend jacketed pipe line.The main body of this system was a U-bend stainless steel pipe with a length of 33 m and a 25.4 mm inner diameter. The temperature of the pipe line was controlled by an inner loop ethyl alcohol cooling system. The fluid temperature was set at −5 °C in the experiments. The U-bend stainless steel pipe can contain up to 16.7 L in the U-bend plus 23.3 L in the separating tank. The whole system can range from −30 to 50 °C. Liquid was injected into the loop by a plunger pump at a constant rate of 11 L min−1. The temperatures were collected using resistance temperature detectors (RTDs, uncertainty ±0.1 K, Agilent Technologies) installed at different points. All experimental data were collected using a data acquisition system (DAQ, Model: 34970A, Agilent Technologies) at one-second intervals. Videos of the fluid transportation process in the visual window were taken using a digital video camera (Model: HDR-SR8E, SONY).
2.3 Experimental procedure
The flow loop was cleaned by flushing the inner pipe with a detergent solution (Mr Muscle, SC Johnson Wax) first, then with pure water in 3 cycles, and then it was drained. After 30 min, liquid (THF solution, 19 wt%) was injected into the loop from the storage tank. Then, the system ran for 1 hour before the flow loop was cooled down. The program was started to cool the system when the system temperature fluctuation was within 0.5 °C in 0.5 hour. The digital camera was used to record the phenomena of the fluid through the visual window at the same time. All experiments started from circulating fluid cooling down step-wise from room temperature, with three steps of 5, 4.4 (19 wt% THF solution equilibrium temperature at atmosphere) and 4 °C until 2.5 °C was reached. The morphologies of the fluid inside the pipeline were taken and analysed for all three cases.2.4 Experiment summary
The detailed experimental conditions for different cases are summarized in Table 2.| Case | Conditions | Total volume | Duration | Temperature range |
|---|---|---|---|---|
| 1 | 19 wt% THF | 20 L | 4.3 h | 31–5 °C |
| 2 | 19 wt% THF | 40 L | 8.8 h | 31–5 °C |
| 3 | 19 wt% THF + 1 wt% AA | 40 L | 8.0 h | 31–5 °C |
2.5 Concept of hydrate conversion
In flow assurance, hydrate conversion is the ratio of the actual amount of hydrate generated in the pipeline to the maximum theoretical hydrate generation.10,21,33,34 Hydrate conversion is an important index to determine the possibility of hydrate plugs in the pipeline.The THF hydrate conversion calculation can be simplified as the THF hydrate particles’ volume fraction in the total volume of liquid and particles. In this study, as shown in Fig. 2a, we employed a high resolution camera to estimate the THF hydrate conversion (ΦV = VH/V) in our flow loop (where VH is hydrate volume and V is the volume of all liquid). From the video, THF hydrate particles and liquid volumes can be distinguished and measured using image-processing software SimplePCI, the error of which is from ±1% to ±5% (Fig. 2b). The distortion of the video caused by the change from 3-dimensional to 2-dimensional has been considered to reduce the error in the estimation.
 | ||
| Fig. 2 Diagram of hydrate conversion estimation ((a) side view of hydrate conversion from the visible window shown in Fig. 1; (b) actual hydrate particles in the video from the visible window shown in Fig. 1). | ||
3. Results and discussion
Fig. 3 shows the different morphologies of case 1, case 2 and case 3 of Table 2 with time elapsing. The evolution of hydrate in the flow loop can be clearly divided into four stages: (a) flowable fluid; (b) particle formation; (c) agglomeration; (d) plug, which is in accordance with conclusions from previous publications.2,35,36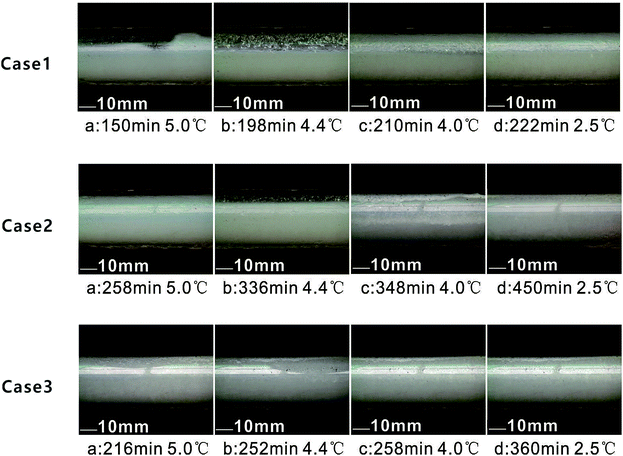 | ||
| Fig. 3 Morphological evolution of THF hydrates in the flow loop (stage a–d for case 1, case 2 and case 3). | ||
Table 3 lists the THF hydrate conversion at each stage. The effect of LL and AA on morphology and temperature in three cases is discussed.
| Stage | a | b | c | d |
|---|---|---|---|---|
| Case 1 | 150 min | 198 min | 210 min | 222 min |
| 0 | 2.7 ± 1.0% | 57.2 ± 3.0% | 72.8 ± 5.0% | |
| Case 2 | 258 min | 336 min | 348 min | 450 min |
| 0 | 4.2 ± 1.0% | 62.7 ± 3.5% | 83.5 ± 4.5% | |
| Case 3 | 216 min | 252 min | 258 min | 360 min |
| 0 | 15.7 ± 2.5% | 33.8 ± 4.0% | 49.0 ± 5.0% |
3.1 The effect of LL on morphology and process
It is well known that hydrate plugs could be the result of hydrate particle agglomeration. Typically, the agglomeration can be in form of wall deposition or a hydrate bed at the bottom of the loop.10,15 It is still unclear where the preferable position for hydrate deposition is at the beginning of hydrate agglomeration. There is also a gap in the knowledge on the relationship between hydrate agglomeration and LL. In this part, the hydrate plugging process was observed in 50 vol% and 100 vol% LL conditions.Fig. 4 shows THF hydrate evolution in the pipeline for case 1 with 50 vol% LL. THF droplets outlined preferable positions for the hydrate particles coming out at the beginning, as shown in Fig. 4a, because fluid flushed into the pipe and liquid splashed onto the top wall and stayed there. In Fig. 4b, heterogeneous suspension of THF hydrate particles happened and THF hydrate particles deposited on the upper gas phase part of the loop first. No hydrate particles were observed in the liquid phase part of the loop at this time. It is reasonable to consider the dual effect of stationary liquid splash (mass transfer) on the top part and the colder loop wall (heat transfer). In Fig. 4c, hydrate agglomeration developed from these hydrate depositions on the inner pipe wall. Meanwhile, a hydrate bed was generated at the bottom of the pipe in the liquid phase. The existing hydrate deposition easily induced hydrate agglomeration and the pipe was at risk of developing a hydrate plug. If no action was taken to inhibit further hydrate plug development, a final full hydrate plug would happen as shown in Fig. 4d.
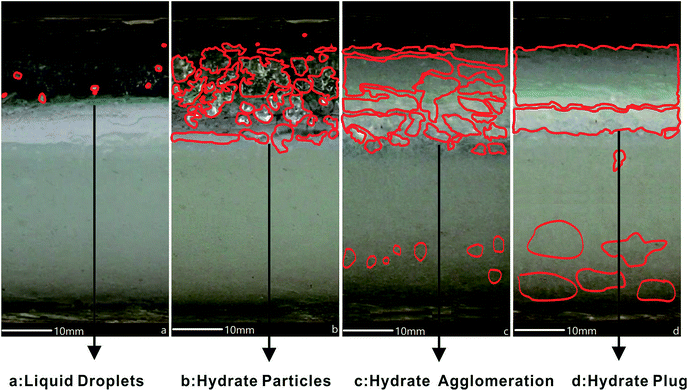 | ||
| Fig. 4 THF hydrate evolution in the pipeline for case 1 with 50 vol% LL. ((a) liquid droplets; (b) hydrate particles; (c) hydrate agglomeration; (d) hydrate plug). | ||
Compared to 50 vol% LL as shown in Fig. 4(a–d), 100 vol% LL THF fluid homogeneously generated hydrate particles around the pipeline wall Fig. 5(a–d). The droplets shape in Fig. 5a is almost identical with Fig. 4a. The range of the hydrate particles’ diameters is from 0.5 mm to 2.0 mm as shown in Fig. 5b, which gives a smaller mean value than that shown in Fig. 4b. This can be attributed to the dynamic hydrate particle formation process in 100 vol% LL, while for 50 vol% LL as shown in Fig. 4b, this process happened with stationary liquid droplets. At this stage, the hydrate slurry inside can still maintain its flow of liquid. With the temperature cooling down to 4 °C, the hydrate plugged partially, as shown by the white crystal in Fig. 5c, and hydrate conversion was about 60%. When the temperature cooled further down to 2.5 °C, a full hydrate block happened with about 70% hydrate conversion as shown in Fig. 5d.
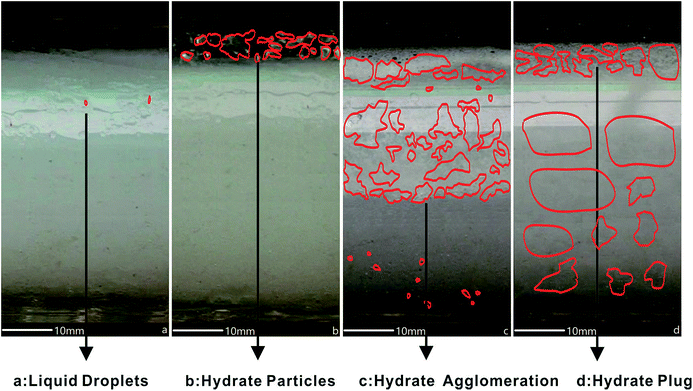 | ||
| Fig. 5 THF hydrate evolution in the pipeline for case 2 with 100 vol% LL. ((a) liquid droplets; (b) hydrate particles; (c) hydrate agglomeration; (d) hydrate plug). | ||
50 vol% LL had more spaces inside the pipeline and resulted in more severe flow disturbances. Besides this, under the conditions of a certain cold output, the cooling rate of the 100% LL system was slower than that of the 50% LL system and it had a smaller driving force. A smaller driving force might be the reason for the finer hydrate particles of the 100 vol% LL system. This phenomenon meant that the hydrate plug had a positive correlation with driving force.
3.2 The effect of AA on morphology and process
A typical AA (KL-1) was chosen to investigate its effect on compressing a hydrate plug in 100 vol% LL. The experiment for the system of 100 vol% LL + 1 wt% AA is shown in Fig. 6(a–d). With AA addition, liquid droplets changed into crystalline form in Fig. 6a and hydrate particles became more loose and disperse as shown in Fig. 6b than in case 2. In Fig. 6c, snow-like hydrate agglomeration showed that the AA also diminished the hydrate particle agglomeration trend by reducing adhesion forces among them. Although AA could help compress large hydrate coalescence at lower subcooling (4 °C), it no longer worked in this experiment at high subcooling.11,37–39 Finally, the hydrate fully plugged the flow-loop in Fig. 6d when the temperature reached 2.5 °C. The addition of an AA can prolong hydrate plug formation by two and a half times. In addition, KL-1 can change the formation mode of the hydrate particles from the interaction effect mode to mutual independence. KL-1 can also change the hydrate particles from coarse to fine and generate different morphology in every stage.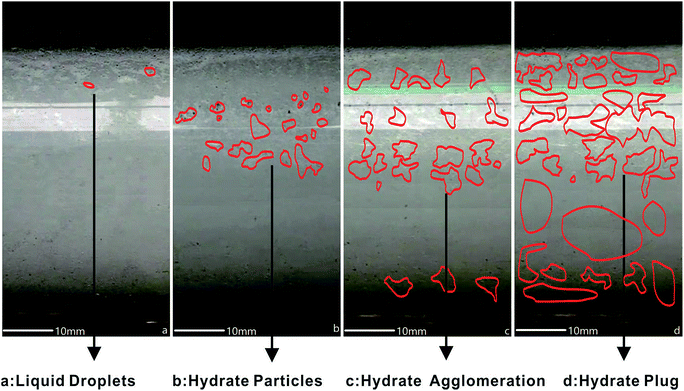 | ||
| Fig. 6 THF hydrate evolution in the pipeline for case 3 with AA added in 100 vol% LL. ((a) liquid droplets; (b) hydrate particles; (c) hydrate agglomeration; (d) hydrate plug). | ||
3.3 The temperature variation in the three cases
With twelve temperature sensors (RTDs) being installed in this flow loop, the curves of temperature varying with time can be obtained for proof of hydrate formation and hydrate plugging process discussion.The whole experimental circle lasted 270 min in case 1 (Fig. 7) for 50 vol% LL, while in case 2 (Fig. 8), the total period was about 540 min. The difference in the experimental period in Fig. 7b and 8b was because the higher LL in case 2 would need a longer time to form hydrates under the same rated refrigeration capacity. Because of the site difference of the 12 RTDs and the random hydrate formation nature, the RTDs had discrepancies in the variation curves during the hydrate plugging process. A sharp temperature rise indicated a hydrate plug.
Fig. 7a was the temperature curve changed with time for case 1 and Fig. 8a was the temperature curve changed with time for case 2. As shown in Fig. 7b, a sharp temperature rise appeared between 235 min and 245 min for all 12 RTDs. At a time of 235 min, T8 and T9 had turning points and the temperatures of both were about −3.5 °C. The difference between −3.5 °C and 4.4 °C (19 wt% THF hydrate phase equilibrium temperature) is about 7.9 °C. This meant that the sub-cooling at both the T8 and T9 sites is 7.9 °C. At the sites of T8 and T9 at 235 min, hydrates started to form, and after 4 min, the temperature curve levelled off. By checking the video at this time and these sites, this can be attributed to the fact that the hydrate agglomerated but had not plugged and the enthalpies of formation were taken away by the circulating coolant within the loop jacket. At a time of 244 min, all temperature points had a sudden temperature drop and then rose within two minutes. The temperature drop and rise in a short time demonstrated the bulky hydrate plugging process. The initial hydrate plug slowed the flow rate, which resulted in reduced heat capacity from the fluid at all 12 RTD sites. The relative cold balance increase from the constant cooling bath caused the temperature drop. With bulky hydrate plugging being induced in the whole pipe in a short time, the enthalpies of hydrate formation heated up the fluid again.
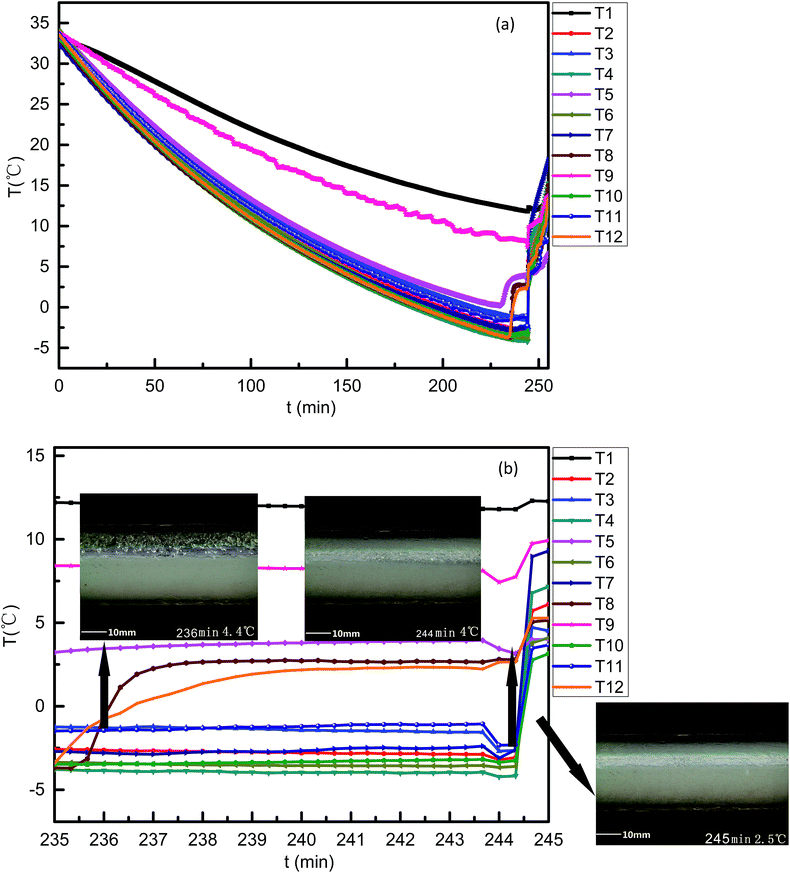 | ||
| Fig. 7 Curves of temperature varying with time for the case 1 system. ((a) 0–260 min; (b) 235–245 min). | ||
For case 2, similar temperature variation curves were found (Fig. 8). However, neither the temperature rise and the duration were comparable to those of case 1. By referring to the video, one possible reason was found: 50 vol% LL fluid was more intensely at the same flow rate, and could form more hydrates in a short period. Fig. 9a was the temperature curve changed with time for case 1. For case 3 (Fig. 9), the temperature signals showed that the AA smoothened but prolonged the hydrate plugging process as showed in Fig. 9b, which was in accordance with AA tests in previous publications.1,40–44 The formation process and the morphology of the hydrate blockage were revealed by the hydrate slurry formation in the flow pipe. In either system, the hydrate particles were formed on the inner wall and then underwent growth and accumulation. Heat transfer is preferred to mass transfer in the process of hydrate plug formation in this paper. The hydrate particles first formed on the inner wall of the pipeline and then could be transferred to anywhere in the pipeline. As a result, the hydrate plug formed in the pipeline by heat transfer and mass transfer.
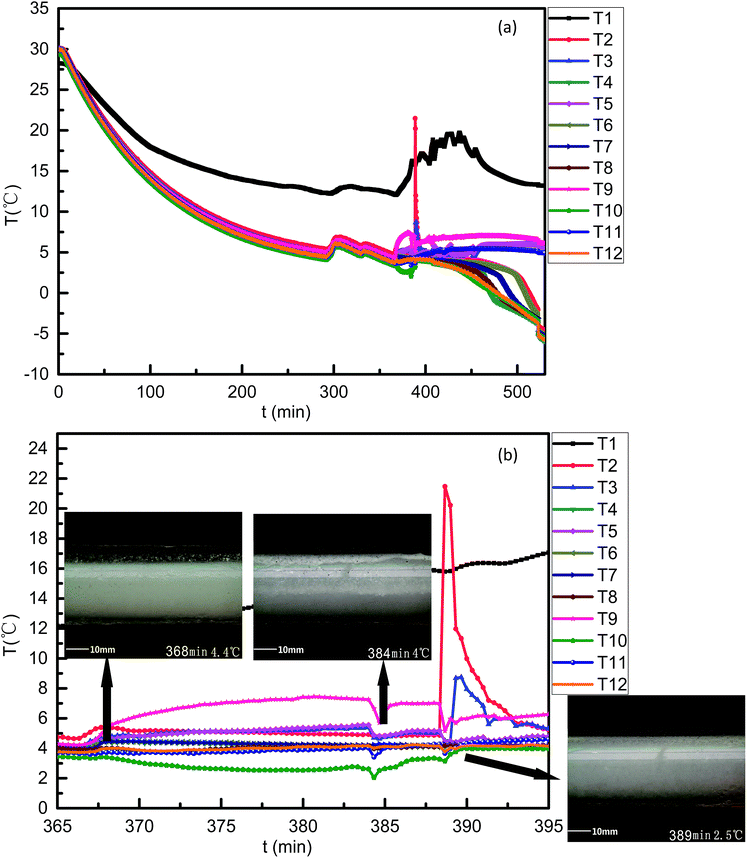 | ||
| Fig. 8 Curves of temperature varying with time for the case 2 system. ((a) 0–530 min; (b) 365–395 min). | ||
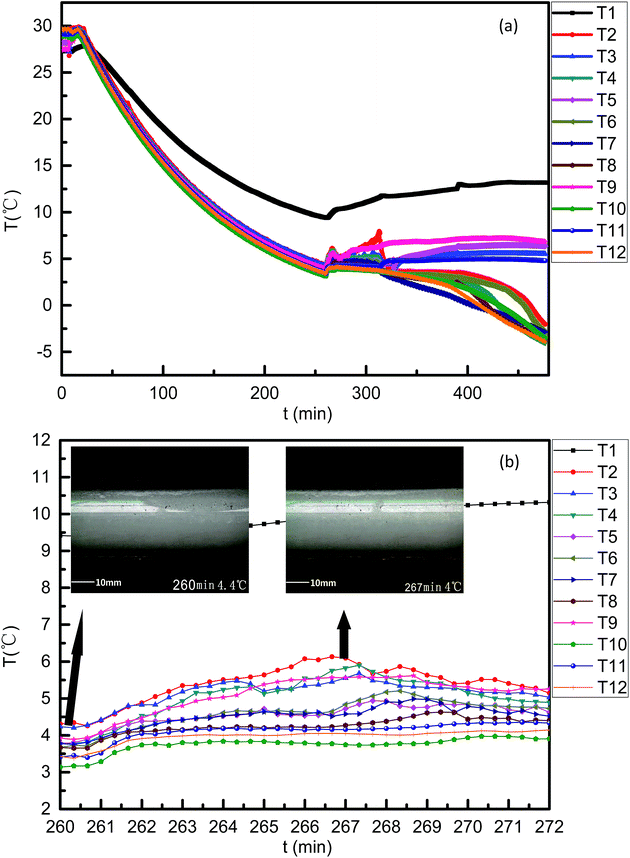 | ||
| Fig. 9 Curves of temperature varying with time for the case 3 system. ((a) 0–480 min; (b) 260–272 min). | ||
4. Analysis of hydrate blockage formation
Fig. 10(a–d) is a diagrammatic drawing of the process of hydrate particles changing into a hydrate plug in the pipeline, with (a) flowable fluid; (b) particle formation; (c) agglomeration; (d) plug. First, as showed in Fig. 10a, a good flowable state appeared above the equilibrium point and only a few water drops adhered to the inner wall. Second, when it reached the phase equilibrium point, some hydrate particles formed on the inner wall by heat transfer and the inner wall acted as a cold point, which can be seen from in Fig. 10b. Third, hydrate particles were transferred to anywhere in the pipe by flowing in Fig. 10c. At this point, hydrate deposition started to occur by heat and mass transfer. There is an obvious liquid level drawdown and temperature increase at this time. Fourth, several minutes later, the hydrate block changed into a hydrate plug and stopped the flow. The plug does not mean that all liquids were converted into hydrates. As shown in Fig. 10d, a thick covering of hydrate is on the wall but a little liquid phase is still in the central pipe. In summary, heat transfer was the main factor in the process of hydrate plug formation, rather than mass transfer. | ||
| Fig. 10 Diagrammatic drawing of the process of hydrate particles changing into a hydrate plug in the pipeline. (a) Flowable fluid; (b) particle formation; (c) agglomeration; (d) plug. | ||
5. Conclusions
Three cases for THF hydrates in 50 vol% LL, 100 vol% LL and a 100 vol% LL system with an AA were studied in a visual flow loop. Liquid loading showed important influences on THF hydrate evolution. The 50 vol% LL system was liable to form bigger particles and agglomeration than the 100 vol% system. Deposition was found in the gas phase at the top of the pipeline prior to the liquid phase at the bottom of the pipeline in 50 vol% LL. In both 50 vol% and 100 vol% LL systems, the hydrate plug was induced from deposition around the pipeline wall but not from the bed at the bottom of the pipeline. The AA could reduce the adhesive forces among hydrate particles and loosen hydrate agglomeration at lower subcooling, but its inhibition failed at higher subcooling. The temperatures of the system at different sites reflected hydrate slurry evolution and were in accordance with morphology changes.Conflicts of interest
There are no conflicts to declare.Acknowledgements
This work was supported by the National Natural Science Foundation of China (51576069 and 21736005), the Guangdong Natural Science Foundation (2016A030313488 and 2015A030310472), and Fundamental Research Funds for the Central University (2015ZZ076 and 2015ZM057).Notes and references
- S. Subramanian, R. A. Kini, S. F. Des and E. D. Sloan, Chem. Eng. Sci., 2000, 55, 1981–1999 CrossRef CAS.
- Z. M. Aman, W. J. Leith, G. A. Grasso, E. D. Sloan, A. K. Sum and C. Koh, Langmuir, 2013, 29, 15551–15557 CrossRef CAS PubMed.
- S. R. Davies, J. A. Boxall, L. E. Dieker, A. K. Sum, C. A. Koh, E. D. Sloan, J. L. Creek and Z. G. Xu, J. Pet. Sci. Eng., 2010, 72, 302–309 CrossRef CAS.
- J. W. Nicholas, C. A. Koh, E. D. Sloan, L. Nuebling, H. He and B. Horn, AIChE J., 2009, 55, 1882–1888 CrossRef CAS.
- Z. M. Aman, E. D. Sloan, A. K. Sum and C. A. Koh, Phys. Chem. Chem. Phys., 2014, 16, 25121–25128 RSC.
- Z. M. Aman, L. E. Dieker, G. Aspenes, A. K. Sum, E. D. Sloan and C. A. Koh, Energy Fuels, 2010, 24, 5441–5445 CrossRef CAS.
- Z. M. Aman, E. P. Brown, E. D. Sloan, A. K. Sum and C. A. Koh, Phys. Chem. Chem. Phys., 2011, 13, 19796–19806 RSC.
- G. Song, Y. Li, W. Wang, K. Jiang, X. Ye and P. Zhao, Chem. Eng. Sci., 2017, 158, 480–489 CrossRef CAS.
- X. Lv, B. Shi, Y. Wang and J. Gong, Energy Fuels, 2013, 27, 7294–7302 CrossRef CAS.
- S. V. Joshi, G. A. Grasso, P. G. Lafond, I. Rao, E. Webb, L. E. Zerpa, E. D. Sloan, C. A. Koh and A. K. Sum, Chem. Eng. Sci., 2013, 97, 198–209 CrossRef CAS.
- J. Chen, C. Y. Sun, B. Z. Peng, B. Liu, S. Si, M. L. Jia, L. Mu, K. L. Yan and G. J. Chen, Energy Fuels, 2013, 27, 2488–2496 CrossRef CAS.
- C. Ruan, L. Ding, B. Shi, Q. Huang and J. Gong, RSC Adv., 2017, 7, 48127–48135 RSC.
- M. Muraoka, N. Susuki and Y. Yamamoto, RSC Adv., 2016, 6, 63880–63885 RSC.
- J. W. Nicholas, L. E. Dieker, E. D. Sloan and C. A. Koh, J. Colloid Interface Sci., 2009, 331, 322–328 CrossRef CAS PubMed.
- I. Rao, C. A. Koh, E. D. Sloan and A. K. Sum, Ind. Eng. Chem. Res., 2013, 52, 6262–6269 CrossRef CAS.
- G. Aspenes, L. E. Dieker, Z. M. Aman, S. Hoiland, A. K. Sum, C. A. Koh and E. D. Sloan, J. Colloid Interface Sci., 2010, 343, 529–536 CrossRef CAS PubMed.
- G. Aspenes, S. Hoiland, T. Barth and K. M. Askvik, J. Colloid Interface Sci., 2009, 333, 533–539 CrossRef CAS PubMed.
- J. D. Smith, A. J. Meuler, H. L. Bralower, R. Venkatesan, S. Subramanian, R. E. Cohen, G. H. McKinley and K. K. Varanasi, Phys. Chem. Chem. Phys., 2012, 14, 6013–6020 RSC.
- J. Chen, K. L. Yan, G. J. Chen, C. Y. Sun, B. Liu, N. Ren, D. J. Shen, M. Niu, Y. N. Lv, N. Li and A. K. Sum, Chem. Eng. Sci., 2015, 122, 284–290 CrossRef CAS.
- L. Ding, B. Shi, X. Lv, Y. Liu, H. Wu, W. Wang and J. Gong, Chem. Eng. Sci., 2016, 146, 199–206 CrossRef CAS.
- M. Akhfash, J. A. Boxall, Z. M. Aman, M. L. Johns and E. F. May, Chem. Eng. Sci., 2013, 104, 177–188 CrossRef CAS.
- T. Makino, T. Sugahara and K. Ohgaki, J. Chem. Eng. Data, 2005, 50, 2058–2060 CrossRef CAS.
- J. S. Zhang, C. Lo, P. Somasundaran, S. Lu, A. Couzis and J. W. Lee, J. Phys. Chem. C, 2008, 112, 12381–12385 CAS.
- W. Wang, S. Fan, D. Liang and Y. Li, J. Nat. Gas Chem., 2010, 19, 318–322 CrossRef CAS.
- A. Delahaye, L. Fournaison and J. Guilpart, Int. J. Refrig., 2010, 33, 1639–1647 CrossRef CAS.
- A. K. Norland and M. A. Kelland, Chem. Eng. Sci., 2012, 69, 483–491 CrossRef CAS.
- W. Liu, S. Wang, M. Yang, Y. Song, S. Wang and J. Zhao, J. Nat. Gas Sci. Eng., 2015, 24, 357–364 CrossRef CAS.
- M. Karamoddin and F. Varaminian, Ind. Eng. Chem., 2015, 21, 749–753 CrossRef CAS.
- C. W. Foo, L. Ruan and X. Lou, J. Nat. Gas Sci. Eng., 2016, 35, 1587–1593 CrossRef CAS.
- P. H. de Lima Silva, M. F. Naccache, P. R. de Souza Mendes, F. B. Campos, A. Teixeira and A. K. Sum, Energy Fuels, 2017, 31, 14385–14392 CrossRef CAS.
- S. Sun, X. Peng, Y. Zhang, J. Zhao and Y. Kong, J. Chem. Thermodyn., 2017, 107, 141–152 CrossRef CAS.
- I. A. de Oliveira, I. S. V. Segtovich, A. G. Barreto Jr and F. W. Tavares, J. Chem. Thermodyn., 2018, 117, 60–67 CrossRef.
- M. Akhfash, Z. M. Aman, J. Du, P. F. Pickering, M. L. Johns, C. A. Koh and E. F. May, Energy Fuels, 2017, 31, 4875–4885 CrossRef CAS.
- Z. M. Aman, W. G. T. Syddall, A. Haber, Y. Qin, B. Graham, E. F. May, M. L. Johns and P. F. Pickering, Energy Fuels, 2017, 31, 5806–5816 CrossRef CAS.
- Z. M. Aman, E. D. Sloan, A. K. Sum and C. A. Koh, Energy Fuels, 2012, 26, 5102–5108 CrossRef CAS.
- B. R. Lee and A. K. Sum, Langmuir, 2015, 31, 3884–3888 CrossRef CAS PubMed.
- J. Chen, Y. F. Wang, C. Y. Sun, F. G. Li, N. Ren, M. L. Jia, K. L. Yan, Y. N. Lv, B. Liu and G. J. Chen, Energy Fuels, 2014, 29, 122–129 CrossRef CAS.
- P. C. Chua and M. A. Kelland, Energy Fuels, 2013, 27, 1285–1292 CrossRef CAS.
- M. A. Kelland, T. M. Svartaas, J. Øvsthus, T. Tomita and K. Mizuta, Chem. Eng. Sci., 2006, 61, 4290–4298 CrossRef CAS.
- H. Zhao, M. Sun and A. Firoozabadi, Fuel, 2016, 180, 187–193 CrossRef CAS.
- K. L. Yan, C. Y. Sun, J. Chen, L. T. Chen, D. J. Shen, B. Liu, M. L. Jia, M. Niu, Y. N. Lv, N. Li, Z. Y. Song, S. S. Niu and G. J. Chen, Chem. Eng. Sci., 2014, 106, 99–108 CrossRef CAS.
- M. Sun and A. Firoozabadi, J. Colloid Interface Sci., 2013, 402, 312–319 CrossRef CAS PubMed.
- Z. Huo, E. Freer, M. Lamar, B. Sannigrahi, D. M. Knauss and E. D. Sloan, Chem. Eng. Sci., 2001, 56, 4979–4991 CrossRef CAS.
- A. Sinquin, D. Arla, C. Prioux, J. L. Peytavy, P. Glenat and C. Dicharry, Energy Fuels, 2008, 22, 721–728 CrossRef CAS.
| This journal is © The Royal Society of Chemistry 2018 |

