 Open Access Article
Effects of template molecules on the structures and luminescence intensities of a series of porous Tb-MOFs based on the 2-nitroterephthalate ligand†
Yi-Xia Ren *,
Xiao-Long Zhao,
Zhi-Xiang Wang,
Yong Pan,
Hui-Ping Li,
Fei-Yan Wang,
Shao-Feng Zhu and
Chen-Hui Shao
College of Chemistry and Chemical Engineering, Laboratory of New Energy and New Function Materials, Yan'an University, Yan'an 716000, P. R. China. E-mail: renyixia1@163.com
First published on 14th May 2018
Abstract
Four novel porous Tb(III) metal–organic frameworks (Tb-MOFs) have been designed and prepared hydrothermally from 2-nitroterephthalate (2-H2ntp), namely {[Tb(2-ntp)1.5(H2O)]·H2O}n (1), {[Tb(2-ntp)2(H2O)]·4,4′-Hbipy}n (2), {[Tb(2-ntp)2(H2O)]·2,4-Hbipy}n (3), and {[Tb(2-ntp)2(H2O)]·(1,4-H2bbi)0.5}n (4) (4,4′-bipy = 4,4′-bipyridine; 2,4-bipy = 2,4-bipyridine; 1,4-bbi = 1,4-bisbenzimidazole). X-ray diffraction structural analyses show these Tb-MOFs are porous and are based on Tb3+ ions and 2-nitroterephthalate, in which water molecules (1) or protonated N-donor ligands (2–4) exist as templates. The fluorescence properties of complexes 1–4 could be associated with the characteristic peaks of Tb(III) ions, and the existence of different guest molecules affects the intensities of peaks, which means that these could be potential fluorescence materials, with intensities adjusted using guests.
Introduction
Porous metal–organic frameworks (MOFs) have attracted increasing attention due to their diversified structures and potential applications to heterogeneous catalysis, selective guest adsorption, the immobilization of ions, energy storage and so on.1 In the pores of MOFs, there are solvents or other small molecules, such as ions, anions, amino-compounds and so on.2 Some of these can be exchanged with other ions or molecules, but some are templates which can't be exchanged and are located in the pores.3 Lanthanide ions have high coordination numbers and large ionic radii, resulting in varieties of lanthanide porous MOF materials that exhibit more outstanding properties toward ionic selection and discrimination, nanoparticle catalysis, guest exchange and adsorption.4 As a new species, lanthanide-based metal–organic frameworks (Ln-MOFs) attract more research attention in the fields of material, synthetic and inorganic chemistry.5 Of the lanthanides, Eu3+ and Tb3+ ions possess good fluorescence properties, so Eu/Tb-MOFs have good fluorescence detection abilities and wide applications in fluorescence probes, fluorescence discrimination and sensing.6Multi-carboxylate ligands have been employed in the preparation of MOFs due to the varied coordination modes of the carboxyl group.7 Bicarboxylate functional ligands, such as terephthalate and its derivatives, have been used in the construction of a great deal of MOFs as rigid spacers.8 Furthermore, different auxiliary co-ligands containing nitrogen, such as bipyridine, also have been used to adjust structural features and properties.9 In the paper, we used a simple terephthalate derivative, namely 2-nitroterephthalate, to design and prepare successfully a series of Tb-MOFs featuring different guest molecules. Interestingly, for these complexes, the N-donor co-ligands are not coordinated to Tb ions, but are located in the pores as template molecules.
Experimental
Materials and measurements
All chemicals were commercially available and used as received without further purification. Elemental analyses (CHN) were performed using a Vario EL elemental analyzer. FT-IR spectra were recorded from KBr pellets over the range of 4000–400 cm−1 on a Nicolet Avatar 360 FT-IR spectrometer. Thermogravimetric curves were measured using a Netzsch STA449 F3 analyzer at a heating rate of 10 °C min−1 from room temperature to 900 °C in air. Fluorescence measurements were carried out with a SHIMADZU RT5301PC spectrofluorophotometer. The lifetimes of the excited states were measured with an Edinburgh Instruments FLS920 fluorescence spectrophotometer. X-ray powder diffraction (XRPD) intensities were measured at 293 K using a D8 Advance (Bruker) diffractometer (Cu-Kα; λ = 1.54056 Å). The simulated PXRD patterns were calculated from the single crystal diffraction data using PowderCell.Syntheses
X-ray data collection and structural determination
Single crystal X-ray diffraction analyses of the coordination polymers 1–4 were carried out on a Bruker SMART APEX CCD diffractometer equipped with graphite monochromated Mo-Kα radiation (λ = 0.71073 Å). Raw data were integrated using the SAINT program.10 The structures were solved via direct methods with SHELXS-97 and refined using full-matrix least-squares on F2 using SHELXS-97.11 An empirical absorption correction was applied using the program SADABS.12 All non-hydrogen atoms were refined anisotropically. The hydrogen atoms were set in calculated positions and refined using a riding mode. Parts of the 2-nitro group on 2-ntp2− ligands are positionally disordered in complexes 1–4. Crystallographic details of 1–4 are provided in Table 1, while selected bond distances and angles are listed in Tables S1–4.†| Complex | 1 | 2 | 3 | 4 |
|---|---|---|---|---|
| Empirical formula | C48H32N6O43Tb4 | C26H17N4O13Tb | C26H17N4O13Tb | C23H15N4O13Tb |
| Mw | 2016.48 | 752.36 | 752.36 | 714.31 |
| T/K | 296(2) | 296(2) | 296(2) | 296(2) |
| Crystal system | Orthorhombic | Monoclinic | Monoclinic | Monoclinic |
| Space group | C2/c | P21/n | P21/n | P21/a |
| a/Å | 16.7852(19) | 11.9800(5) | 11.7024(8) | 15.308(3) |
| b/Å | 11.3430(13) | 14.5780(6) | 14.5744(9) | 15.900(3) |
| c/Å | 15.3991(18) | 15.2371(6) | 15.8996(11) | 11.580(2) |
| α/° | 90 | 90 | 90 | 90 |
| β/° | 90 | 105.5310(10) | 105.519(11) | 118.12(3) |
| γ/° | 90 | 90 | 90 | 90 |
| V/Å3 | 2931.9(6) | 2563.91(18) | 2612.9(3) | 2485.8(8) |
| Z | 2 | 4 | 4 | 4 |
| Dcalcd/g cm−1 | 2.284 | 1.949 | 1.913 | 1.903 |
| μ/mm−1 | 4.890 | 2.841 | 2.788 | 2.923 |
| θ range/° | 3.42 to 27.64 | 3.11 to 25.01 | 3.00 to 25.01 | 3.16 to 25.01 |
| Reflections collected | 22![[thin space (1/6-em)]](https://www.rsc.org/images/entities/char_2009.gif) 200 200 |
25![[thin space (1/6-em)]](https://www.rsc.org/images/entities/char_2009.gif) 667 667 |
34![[thin space (1/6-em)]](https://www.rsc.org/images/entities/char_2009.gif) 170 170 |
32![[thin space (1/6-em)]](https://www.rsc.org/images/entities/char_2009.gif) 271 271 |
| Unique reflections | 3119 | 3716 | 4199 | 3227 |
| GOF | 1.055 | 1.077 | 1.031 | 1.014 |
| R1 [I > 2σ(I)] | 0.0273 | 0.0266 | 0.0205 | 0.0382 |
| wR2 (all data) | 0.0736 | 0.0605 | 0.0565 | 0.1622 |
Results and discussion
Crystal structure of 1
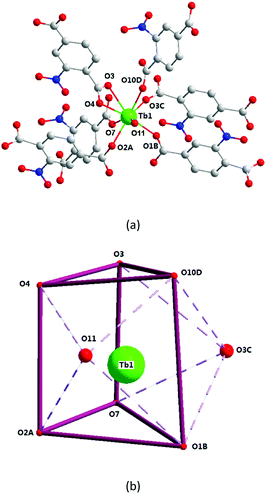
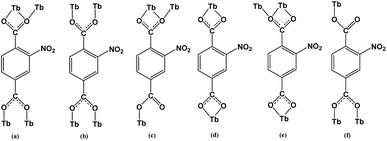
X-ray single-crystal diffraction analysis shows that 1 has a three-dimensional porous framework with lattice water molecules filling in the pores. The center metal Tb3+ ion is surrounded by eight oxygen atoms from one chelated carboxyl group (O3 and O4), five bridged carboxyl groups (O1B, O2A, O3C, O7, and O10D) from six 2-ntp ligands, and one water molecule (O11) (Fig. 1a). The Tb3+ ion polyhedron is in a distorted two-capped triangular prism configuration, in which O3, O4, and O10D, and O7, O2A, and O1B construct two surfaces, and O3C and O11 are vertex atoms (Fig. 1b). The Tb–O bond lengths range from 2.292(2) to 2.601(3) Å, which are in accordance with those found in the other Tb(III) complexes.13The 2-ntp2− ligand in 1 exhibits two μ4 coordination modes, (κ2-κ1)-(κ1-κ1)-μ4 and (κ1-κ1)-(κ1-κ1)-μ4 (Chart 1(a) and (b)), linking four Tb3+ ions. The adjacent Tb3+ ions (the Tb⋯Tb distances are 3.96 and 5.23 Å) are bridged via carboxyl groups, in (κ2-κ1)-μ2 and (κ1-κ1)-μ2 modes, from 2-ntp ligands to form a one-dimensional chain with two kinds of rings, four-member rings and six-member rings, joining alternately, as shown in Fig. 2. Then the 1D chains extend into a 2D network bridged by 2-ntp2− ligands in the bc plane. Furthermore, the 3D porous structure has been formed through 2-ntp2− ligands in different directions, in which the guest water molecules (O12) exist through H-bonds with coordination water molecules (O11) (O11–H11wB⋯O12: 2.647 Å, 164.52°) and oxygen atoms (O4 and O6) from the carboxyl groups of ligands (O12–H12wA⋯O4: 2.901 Å, 131.78°; O12–H12wB⋯O6: 2.849 Å, 127.24°) (Fig. 3).
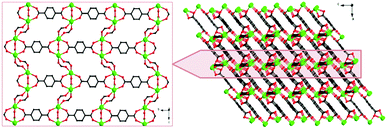 | ||
| Fig. 3 The two-dimensional network (left) and three-dimensional porous structure (right) of 1 (the nitro groups in the 2-ntp ligands and hydrogen atoms have been omitted for clarity). | ||
Crystal structures of 2 and 3
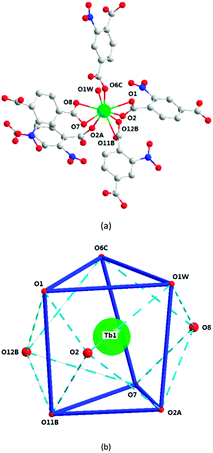
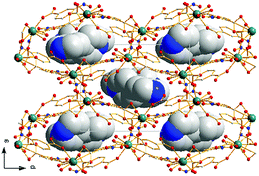
Structural analyses reveal that complexes 2 and 3 crystallize in the same monoclinic system, the P21/n space group, and the frameworks of complexes 2 and 3 are isomorphic, despite having different N-donor molecules as guests in their pores. Here, only complex 2 will be described in detail. In 2, the Tb1 ion lies in a nine-coordinated three-capped triangular prism configuration, in which O2, O8, O12B are the capping atoms and O1, O6C and O1W, and O11B, O7, and O2A form the two faces of the prism (Fig. 4b). Of the nine coordinated oxygen atoms, six atoms (O1, O2, O7, O8, O11B, and O12B) are from chelated carboxyl groups of 2-ntp2− ligands, O2A and O6C belong to bridging carboxyl groups, and O1W comes from one water molecule (Fig. 4a). The Tb–O bond lengths range from 2.304(2) to 2.638(2) Å, and the O–Tb–O bond angles are in the range of 50.92(7) to 155.74(9)°.The dimer unit consists of two terbium ions with a Tb⋯Tb distance of 4.23 Å, and extends into a three-dimensional porous framework, bridging via 2-ntp2− ligands (Fig. 5). The 2-ntp2− ligands in 2 adopt two coordination modes, (κ2-κ1)-(κ1)-μ3 and (κ2)-(κ2)-μ2 (Chart 1(c) and (d)), linking three or two metal ions. In the pores, the guest molecules are protonated 4,4′-Hbipy ligands, which exist via H-bonds with the coordinated water molecules (Fig. 6).
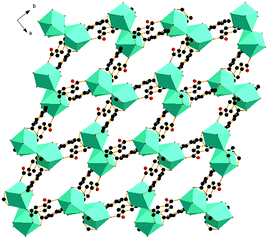 | ||
| Fig. 5 The two-dimensional structural of 2 from the c axis. The nitro groups and H atoms are omitted for clarity. | ||
Crystal structure of 4
In 4, the Tb1 ion is surrounded by six 2-ntp2- ligands, with their carboxyl groups in chelate (O3, O15, O6A, and O8A) or monodentate (O4, O10, O6, and O11) mode, and one coordinated water molecule (O16), which construct a one-capped square antiprism polyhedron (Fig. 7). As shown in Fig. 7b, O3, O15, O4, and O16 and O6, O11, O8A, and O10 form the square faces of the prism, and O6A is the capping atom. The Tb–O bond lengths range from 2.338(5) to 2.724(6) Å, and the O–Tb–O bond angles are in the range of 52.7(2)–149.15(18).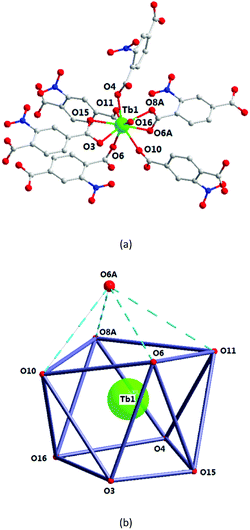 | ||
| Fig. 7 The Tb1 coordination environment (a) and polyhedron (b) for complex 4. All H atoms are omitted for clarity. Symmetry code: (A) 1 − x, 1 − y, −z. | ||
The dimer unit consists of two terbium ions with a Tb⋯Tb distance of 4.10 Å, which is less than in complexes 2 and 3. These dimers are linked via 2-ntp2− ligands in two coordination modes, (κ2-κ1)-(κ2)-μ3 and (κ1-κ1)-(κ1)-μ3 (Chart 1(e) and (f)), into a 3D framework, which differs from complexes 1–3 (Fig. 8a). As for guest molecules, long, soft, protonated 1,4-H2bbi ligands are located in the cavities of the framework via H-bonds with the coordination water molecules (Fig. 8b).
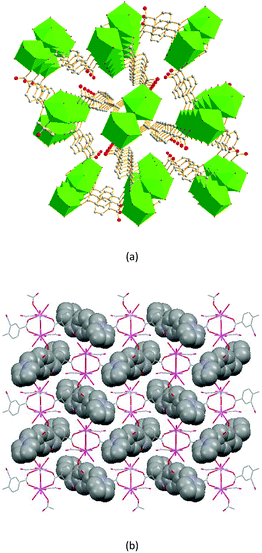 | ||
| Fig. 8 (a) The porous structure along the c axis, with nitro groups and H atoms omitted for clarity; and (b) the 3D structure, containing 1,4-H2bbi guests, of 4. | ||
Discussion relating to the structures
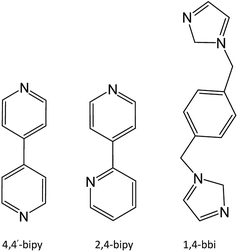
The porous Tb-MOF series features different guest molecules (H2O, 4,4′-bipy, 2,4-bipy and 1,4-bbi) (Chart 2), which are N-donor long-chain ligands, except for H2O in 1. The frameworks of complexes 2–4 display negative charge and interacted with the protonated guest molecules, while 1 differs from these with an electrically neutral framework. From H2O to 4,4′-bipy to 1,4-bbi, the guests in complexes 1–4 get bigger and longer, and the frameworks adjust their pores to contain these guests. We tried to use a longer guest than 1,4-bbi when preparing complexes but this failed, which might mean that pore sizes of these frameworks are limited. The existence of guest molecules might affect the coordination polyhedrons of metal ions and the coordination modes of the organic ligands. The host–guest system of Tb-MOFs has been reported in recent years.14 The Tb(III) ion coordination number is eight for 1 and nine for 2–4, and the coordination polyhedrons change from a two-capped triangular prism to a three-capped triangular prism to a one-capped square antiprism, and are probably affected by the template molecules in the pores. The 2-ntp2− ligand adopts six coordination modes in these complexes: (a) (κ2-κ1)-(κ1-κ1)-μ4; (b) (κ1-κ1)-(κ1-κ1)-μ4; (c) (κ2-κ1)-(κ1)-μ3; (d) (κ2)-(κ2)-μ2; (e) (κ2-κ1)-(κ2)-μ3; and (f) (κ1-κ1)-(κ1)-μ3. The 2-ntp2− ligand acts in a μ4 fashion to link four metal ions in 1, but the μ2 and μ3 fashion are also probably affected by the N-donor guests in 2–4.Powder X-ray diffraction
In order to confirm the phase purity of the bulk materials, powder X-ray diffraction (PXRD) patterns were recorded at room temperature for 1–4 (see Fig. S1†). Compared to simulated patterns from the single crystal data, although the experimental patterns have a few unindexed diffraction peaks and some peaks are slightly broadened, we can conclude that the bulk as-synthesized crystalline materials represent complexes 1–4, due to their adequate similarity.Thermal stability behaviour
In order to examine the thermal stabilities of complexes 1–4, we carried out thermogravimetric analyses (TGA) under an air atmosphere at a heating rate of 10 °C min−1, from 30 to 900 °C (Fig. S2†). The TGA curve for 1 exhibits that the first weight loss step of 11.2% began from 234 °C, which indicates the high stability of the complex, and could be attributed to the loss of one coordinated and two lattice water molecules (calc. 10.8%). The second step might be the complete collapse of the whole skeleton of 1, from 369 to 798 °C (Fig. S2a†). The TGA curves of complexes 2–4 are similar and show one-step decomposition (Fig. S2b–S2d†). The complex possesses high stability in relation to the initial decomposition from 242 °C for 2. At 304 °C for 2, there is point of inflexion, with a weight loss of 79.8%, which could be assigned to the release of the guest molecule 4,4′-bipy (calc. 79.3%). Following the release, the framework of complex 2 decomposed. Complex 3 begins to decompose from 270 °C, and then the framework of 3 is destroyed up to 550 °C with a weight loss of 25.3% which can be considered as decomposition to yield terbium oxide (calc. 24.31%). For complex 4, thermal decomposition begins from 282 °C, and the skeleton is broken down up to 840 °C, with the residual weight 28.8% being attributed to Tb2O3 (calc. 25.68%).Luminescence properties
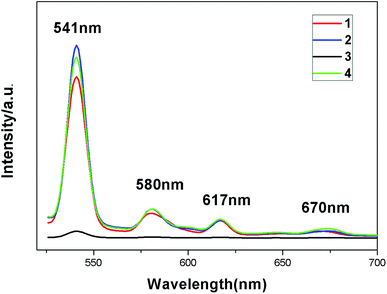
The fluorescence spectra of complexes 1–4 were obtained in the solid state at room temperature. From Fig. 9, we can see that all the emission spectra of these complexes exhibit the characteristic peaks of the terbium ion (λex = 487 nm) at 541 nm, 580 nm, 617 nm and 670 nm, corresponding to 5D4 → 7F5, 5D4 → 7F4, 5D4 → 7F3 and 5D4 → 7F2 transitions. The excitation spectra of the four complexes each show one single peak at 487 nm (λem = 541 nm) (Fig. S3†), the intensities of which are similar to those of the emission peaks. The intensities of emissions of these complexes are different, especially complex 3, which shows drastic quenching, which means that the existence of guest molecules might affect ligand-to-metal energy transfer (LMET) and result in fluorescence enhancing or quenching. The luminescence quenching mechanism induced by guests might be explained through a donor–acceptor electron transfer effect from ligands to metal centers.15 The effects of guest molecules on the fluorescence intensities of Tb-MOFs have been reported.16 We have analyzed carefully the structures and luminescence properties of these Tb-MOFs, and found that different interactions between the guest molecules and the organic ligand 2-ntp2− might be the key to the effects on lanthanide emissions. It is well known that the luminescence properties of lanthanide complexes mainly depend on the coordination environments of the metal ions contributing to the energy transfer from L ligands to Tb(III) ions. For these complexes, the guest molecules exist in the pores and have no interactions with the Tb(III) ions directly, but they interact with the organic ligands and might affect the energy transition to Tb(III) ions from the 2-ntp2− ligands. The intermolecular interactions between the guests and 2-ntp2− ligands are H-bonding and π–π packing interactions, but the H-bonds are similar to the close distances of N⋯O atoms, at about 2.60 Å, so we investigated the π–π packing interactions. From the structural factors, two pyridine rings of the guest 2,4-bipy in complex 3 have good coplanarity with the smallest dihedral angle of 19.15° (other guests have bad coplanarity, as shown in Fig. S4†), which results in stronger π–π packing interactions with 2-ntp2− ligands than the other guests in 2 and 4 have. The weak bonding between 2,4-bipy and 2-ntp2− might partly quench the singlet and triplet excited stated of the ligand-to-Tb optically active core, and might decrease the efficiency of energy transfer, causing the decreasing luminescence intensity of 3.The fluorescence lifetimes of these complexes have been determined, in which the processes of decay all involve two components. The lifetime of complex 1 is τ = 323.73 μs with a quantum yield of 65.59%, τ = 334.41 μs with a quantum yield of 59.56% for 2, τ = 443.42 μs with a quantum yield of 26.60% for 3, and τ = 374.67 μs with a quantum yield of 49.43% for 4. From the lifetimes and quantum yields of these complexes, we could find that the lifetimes of complexes 2–4 show varying degrees of improvement caused by the existence of guest molecules, but the quantum yields decrease compared with complex 1.
Conclusions
In summary, a series of porous Tb-MOFs with 2-nitroterephthalate, featuring different template guests (H2O (1), 4,4′-Hbipy (2), 2,4-Hbipy (3), and 1,4-H2bbi (4)), has been reported. The 2-ntp2− ligand adopts six coordination modes in these complexes and they extend into 3D porous frameworks containing different guest molecules. The terbium(III) ions lie in eight/nine-coordination environments with two-capped triangular prism (1), three-capped triangular prism (2 and 3), and one-capped square antiprism (4) polyhedron configurations, which may be affected by the different guest molecules. The luminescence emission spectra exhibit the characteristic peaks of the terbium ion in the solid state, and the intensities have been influenced by the existence of guest molecules.Conflicts of interest
There are no conflicts to declare.Acknowledgements
This work was supported by the National Natural Science Foundation of China (No. 21573189), and the Natural Scientific Research Foundation of National Undergraduate Training Programs of Innovation and Entrepreneurship (No. 201510719256 and D2016019).Notes and references
- Y. P. Wu, W. Zhou, J. Zhao, W. W. Dong, Y. Q. Lan, D. S. Li, C. H. Sun and X. H. Bu, Angew. Chem., Int. Ed., 2017, 56, 13001 CrossRef PubMed; S. Horike, R. Matsuda, D. Tanaka, S. Matsubara, M. Mizuno, K. Endo and S. Kitagawa, J. Am. Chem. Soc., 2006, 128, 4222 CrossRef PubMed; L. Wang, Y. Z. Han, X. Feng, J. W. Zhou, P. F. Qi and B. Wang, Coord. Chem. Rev., 2016, 307, 361–381 CrossRef; M. Yoon, R. Srirambalaji and K. Kim, Chem. Rev., 2012, 112, 1196 CrossRef PubMed.
- Y. Li, S. S. Zhang and D. T. Song, Angew. Chem., Int. Ed., 2013, 52, 710 CrossRef PubMed; A. J. Timmons and M. D. Symes, Chem. Soc. Rev., 2015, 44, 6708 RSC; C. B. He, D. M. Liu and W. B. Lin, Chem. Rev., 2015, 115, 11079 CrossRef PubMed.
- M. C. Bernini, N. Snejko, E. G. Puebla, E. V. Brusau, G. E. Narda and M. A. Monge, Inorg. Chem., 2011, 50, 5958 CrossRef PubMed; Y. F. Yue, Z. A. Qiao, P. F. Fulvio, A. J. Binder, C. C. Tian, J. H. Chen, K. M. Nelson, X. Zhu and S. Dai, J. Am. Chem. Soc., 2013, 135(26), 9572 CrossRef PubMed.
- V. Chandrasekhar, P. Bag and E. Colacio, Inorg. Chem., 2013, 52, 4562 CrossRef PubMed; X. L. Mei, X. F. Wang, J. J. Wang, Y. Ma, L. C. Li and D. Z. Liao, New J. Chem., 2013, 37, 3620 RSC; B. Zhang, X. D. Zheng, H. Su, Y. Zhu, C. X. Du and M. P. Song, Dalton Trans., 2013, 8571 RSC.
- D. Kovacs, X. Lu, L. S. Meszaros, M. Ott, J. Andres and K. E. Borbas, J. Am. Chem. Soc., 2017, 139, 5756 CrossRef PubMed; S. P. Chen, Y. X. Ren, W. T. Wang and S. L. Gao, Dalton Trans., 2010, 1552–1557 RSC.
- G. W. Xu, Y. P. Wu, W. W. Dong, J. Zhao, X. Q. Wu, D. S. Li and Q. C. Zhang, Small, 2017, 13, 1602996 CrossRef PubMed; G. W. Xu, Y. P. Wu, W. W. Dong, J. Zhao, D. S. Li and J. Zhang, Inorg. Chem., 2016, 55, 10114 CrossRef PubMed.
- S. F. Du, C. Q. Ji and X. L. Xin, J. Mol. Struct., 2017, 1130, 565 CrossRef; J. M. Zhou, W. Shi, N. Xu and P. Cheng, Cryst. Growth Des., 2013, 13, 1218 Search PubMed; Y. X. Ren, H. Y. Ma, F. Fu, Z. L. Zhang and Y. R. Zhang, J. Inorg. Organomet. Polym., 2013, 23, 646 CrossRef.
- A. E. Platero-Prats, N. Snejko, M. Iglesias, A. Monge and E. Guti errez-Puebla, Chem.–Eur. J., 2013, 19, 15572 CrossRef PubMed; Y. X. Ren, S. S. Xiao, L. C. Li and X. J. Zheng, Inorg. Chem. Commun., 2012, 16, 8 CrossRef; J. Zhang, T. Wu, S. Chen, P. Feng and X. Bu, Angew. Chem., Int. Ed., 2009, 51, 3486 CrossRef PubMed; Z. Chen, B. Zhao, P. Cheng, X. Q. Zhao, W. Shi and Y. Song, Inorg. Chem., 2009, 48, 3493 CrossRef PubMed.
- H. Seko, K. Tsuge, A. Igashira-Kamiyama, T. Kawamoto and T. Konno, Chem. Commun., 2010, 46, 1962 RSC; M. H. Mir and J. J. Vittal, Angew. Chem., Int. Ed., 2007, 46, 5925 CrossRef PubMed; J. R. Li, D. J. Timmons and H. C. Zhou, J. Am. Chem. Soc., 2009, 131, 6368 CrossRef PubMed.
- G. M. Sheldrick, SADABS, A Program for Empirical Absorption Correction of Area detector Data, University of Göttingen, Germany, 1997 Search PubMed.
- G. M. Sheldrick, SHELXS-97, Program for Crystal Structure Solution, University of Göttingen, Germany, 1997 Search PubMed.
- G. M. Sheldrick, SHELXL-97, Program for Crystal Structure Refinement, University of Göttingen, Germany, 1997 Search PubMed.
- G. X. Wen, M. L. Han, X. Q. Wu, Y. P. Wu, W. W. Dong, J. Zhao, D. S. Li and L. F. Ma, Dalton Trans., 2016, 15492 RSC.
- I. A. Ibarra, T. W. Hesterberg, J. S. Chang, J. W. Yoon, B. J. Holliday and S. M. Humphrey, Chem. Commun., 2013, 49, 7156 RSC; J. M. Zhou, W. Shi, H. M. Li, H. Li and P. Cheng, J. Phys. Chem. C, 2014, 118, 416 Search PubMed.
- J. X. Ma, X. F. Huang, X. Q. Song and W. S. Liu, Chem.–Eur. J., 2013, 19, 3590 CrossRef PubMed; J. N. Hao and B. Yan, J. Mater. Chem. A, 2014, 2, 18018 Search PubMed.
- J. Zhao, Y. N. Wang, W. W. Dong, Y. P. Wu, D. S. Li and Q. C. Zhang, Inorg. Chem., 2016, 55, 3265 CrossRef PubMed.
Footnote |
| † Electronic supplementary information (ESI) available: Selected bond distances and angles are listed in Tables S1–4. TG curves and PXRD patterns are available for 1–4. CCDC 1815608–1815611 for complexes 1–4. For ESI and crystallographic data in CIF or other electronic format see DOI: 10.1039/c8ra01224e |
| This journal is © The Royal Society of Chemistry 2018 |

