 Open Access Article
Rapid and label-free fluorescence bioassay for microRNA based on exonuclease III-assisted cycle amplification†
Ming Xiu Liu,
Shuping Liang,
Yafang Tang,
Jianniao Tian *,
YanChun Zhao
 * and
Shulin Zhao
Key Laboratory for the Chemistry and Molecular Engineering of Medicinal Resources (Ministry of Education of China), School of Chemistry and Pharmaceutical Science of Guangxi Normal University, Guilin, 541004, China. E-mail: birdtjn@sina.com; yanchunzhao@aliyun.com
First published on 30th April 2018
Abstract
The quantitative analysis of microRNA is extremely important in biological research and clinical diagnosis due to the relationship between microRNA and disease. In this study, we reported a new assay for the rapid and simple detection of microRNA based on G-quadruplex and exonuclease III (ExoIII) dual signal amplification. We specifically designed two hairpins with G-quadruplex sequence. In the absence of a target, the G-quadruplex sequences are enclosed in the hairpin and fluorescence signal shut down. However, when a target is added, the dual cycle is carried out because two hairpins are digested and X and Y sequences are released under the action of ExoIII. Then, these released sequences form the G-quadruplex sequence, and N-methylmorpholine (NMM) is embedded in the G-quadruplex to produce strong fluorescence. The linear range is from 2.5 × 10⁻¹⁰ to 4 × 10⁻⁹ mol L−1 with a low detection limit of 6 pM. Compared to some of the previous strategies, this bioassay needs only a simple one-step reaction, and is easy for realizing the rapid detection of microRNAs. The time required for the entire analysis is only 1 hour. In addition, this bioassay has good specificity and can be applied to the actual samples.
Introduction
MicroRNAs (miRNA) are a class of homologous, non-coded RNA molecules, which are only 18–25 bases long. The unusual performance of miRNA can reflect the presence of some diseases, such as cancer, cardiovascular diseases, and autoimmune diseases1–3 and can adjust the reverse transcription of gene expression.2,4 Therefore, miRNA is of utmost significance as a biomarker in the early stages of diagnosis and treatment of disease. According to previous reports, there are close links between miRNA-122 and hepatitis c, liver cancer and other diseases.5,6 As a result, its qualitative and quantitative analysis is significant for the future development of pathology. However, the detection of miRNA-122 is difficult because of some of its characteristics, such as short length, high homogeneity and low abundance.7,8 Therefore, its analysis is challenging, and much effort is needed to develop a sensitive, convenient and feasible method for detection of miRNA.In the past, the main detection methods of miRNA were Northern blotting,9 microarray,3,10 and quantitative real-time PCR (qRT-PCR).11,12 These methods are classic, but they have some defects.13,14 Northern blotting and microarray methods provide acceptable results, but they both need complex operation and are time consuming; also, the former involves measurements using radioactive isotopes. The qRT-PCR method has a wide linear range and good sensitivity in comparison with the former two methods. However, this approach also has some disadvantages that are ascribed to the characteristics of miRNA sequences, such as short sequence and sequence homology.12 In order to overcome these disadvantages, some new signal amplification methods were developed to improve the sensitivity, reduce reaction time and step up the operation. These methods include rolling circle amplification (RCA),15,16 hybridization chain reaction (HCR),17,18 strand displacement assay (SDA),19,20 the enzyme-based cyclic amplification,21–26 and the energy transfer-based assay.27,28 Among them, the enzyme-based cyclic amplification has become a gradually popular strategy to detect miRNAs due to its special amplifying function and can be used for homogeneous liquids.29 According to previous reports, duplex specific nuclease (DSN),21,22 λ-exonuclease,23 nicking enzyme,24,25 and DNA polymerase26 were often used in enzyme-based biosensors for the detection of miRNA. For instance, Li et al.21 have developed a fluorescence biosensor based on labeling-molecular beacon and DSN to detect miRNA. In addition, a turn-on fluorescence biosensor for miRNA detection was also constructed based on strand displacement and Mg2+-based DNAzyme.26 These methods although greatly increased sensitivity, but some of them involve labelling, complicated processes and use of expensive samples or instruments. Although Exo III can selectively hydrolyze the 3′-hydroxyl flat or concave termini of duplex DNA to mononucleotides, it has weak ability on single-stranded DNA or duplex DNAs with a protruding 3′-terminus.30 Thus far, there are many reports on the strategy of Exo III-assisted target recycling to detect DNA31–36 because it does not need a specific binding site. Liu et al.32 used MoS2 and Exo III to design a double signal amplification fluorescence “turn off” strategy for DNA detection. Bi et al.33 constructed a new method based on exonuclease-assisted cascaded target recycling amplification for the detection of DNA. These methods based on Exo III are able to lead target recycling amplification. However, most of the previously reported fluorescence methods based on Exo III-assisted cycle amplification aimed to detect small biomolecules.32,37–39 For instance, Sun et al.39 applied exonuclease III-assisted DNA cycling and HCR detection method to detect adenosine. Furthermore, many of these methods involve labelling, complex sample processing and tedious procedures.
In order to overcome the above limitations, we designed a convenient and low energy consuming method with simple operation and high specificity for the bioassay of miRNA based on exonuclease III (Exo III) with G-quadruplex double recycling signal amplification. MiRNA-122 was used as the model microRNA to verify the feasibility of this bioassay. In the absence of the target, NMM is in the free-state and presents low fluorescence background values. In the presence of miRNA122, two hairpins opened to release G-quadruplex sequence by Exo III. Then, N-methylmorpholine (NMM) embeds in a sequence under the action of K+, generating a fluorescence signal. The bioassay has a linear detection range from 2.5 × 10⁻¹⁰ to 4 × 10⁻⁹ mol L−1 and the limit of detection (LOD) is 6 pmol L−1 (S/N = 3). In addition, it also has good specificity for distinguishing homologous species.
Experimental
Chemicals
Trihydroxymethyl aminomethane (Tris) and (DEPC)-treated water were bought from the Sangon Biotechnology Co. Ltd. (Shanghai, China). Exo III and 10 NEBuffer 1 were bought from New England Biolabs (USA). Sodium chloride (NaCl), potassium chloride (KCl) and magnesium chloride (MgCl2·6H2O) were bought from Xilong Scientific Co. Ltd. (Chaoshan, China). N-Methylmorpholine (NMM) was bought from Frontier Scientific Inc. (USA). All other chemicals used in the experiments were of analytical grade. The sequences of hairpin probe and miRNAs were purchased from the Shanghai Sangon Biotechnology Co. Ltd. (Shanghai, China) and purified by HPLC. All sequences are listed in Table 1. Normal human serum samples were obtained from the Guilin's Fifth People's Hospital (China).| Name | Sequence (5′ → 3′) |
|---|---|
| a The underlined portion in HP1 and HP2 correspond to X and Y sequences, respectively. | |
| Hairpin probe 1 (HP1) | ![[C with combining low line]](https://www.rsc.org/images/entities/char_0043_0332.gif) ![[A with combining low line]](https://www.rsc.org/images/entities/char_0041_0332.gif) ![[A with combining low line]](https://www.rsc.org/images/entities/char_0041_0332.gif) ![[T with combining low line]](https://www.rsc.org/images/entities/char_0054_0332.gif) ![[G with combining low line]](https://www.rsc.org/images/entities/char_0047_0332.gif) ![[G with combining low line]](https://www.rsc.org/images/entities/char_0047_0332.gif) ![[T with combining low line]](https://www.rsc.org/images/entities/char_0054_0332.gif) ![[G with combining low line]](https://www.rsc.org/images/entities/char_0047_0332.gif) ![[G with combining low line]](https://www.rsc.org/images/entities/char_0047_0332.gif) ![[G with combining low line]](https://www.rsc.org/images/entities/char_0047_0332.gif) ![[G with combining low line]](https://www.rsc.org/images/entities/char_0047_0332.gif) ![[T with combining low line]](https://www.rsc.org/images/entities/char_0054_0332.gif) ![[T with combining low line]](https://www.rsc.org/images/entities/char_0054_0332.gif) ![[G with combining low line]](https://www.rsc.org/images/entities/char_0047_0332.gif) ![[G with combining low line]](https://www.rsc.org/images/entities/char_0047_0332.gif) ![[G with combining low line]](https://www.rsc.org/images/entities/char_0047_0332.gif) ![[C with combining low line]](https://www.rsc.org/images/entities/char_0043_0332.gif) ![[G with combining low line]](https://www.rsc.org/images/entities/char_0047_0332.gif) ![[G with combining low line]](https://www.rsc.org/images/entities/char_0047_0332.gif) ![[G with combining low line]](https://www.rsc.org/images/entities/char_0047_0332.gif) ![[T with combining low line]](https://www.rsc.org/images/entities/char_0054_0332.gif) ![[T with combining low line]](https://www.rsc.org/images/entities/char_0054_0332.gif) ![[G with combining low line]](https://www.rsc.org/images/entities/char_0047_0332.gif) ![[G with combining low line]](https://www.rsc.org/images/entities/char_0047_0332.gif) ![[G with combining low line]](https://www.rsc.org/images/entities/char_0047_0332.gif) ACCCCACCATTGTCACACTCCA ACCCCACCATTGTCACACTCCA |
| Hairpin probe 2 (HP2) | ![[G with combining low line]](https://www.rsc.org/images/entities/char_0047_0332.gif) ![[G with combining low line]](https://www.rsc.org/images/entities/char_0047_0332.gif) ![[G with combining low line]](https://www.rsc.org/images/entities/char_0047_0332.gif) ![[T with combining low line]](https://www.rsc.org/images/entities/char_0054_0332.gif) ![[T with combining low line]](https://www.rsc.org/images/entities/char_0054_0332.gif) ![[G with combining low line]](https://www.rsc.org/images/entities/char_0047_0332.gif) ![[G with combining low line]](https://www.rsc.org/images/entities/char_0047_0332.gif) ![[G with combining low line]](https://www.rsc.org/images/entities/char_0047_0332.gif) ![[C with combining low line]](https://www.rsc.org/images/entities/char_0043_0332.gif) ![[G with combining low line]](https://www.rsc.org/images/entities/char_0047_0332.gif) ![[G with combining low line]](https://www.rsc.org/images/entities/char_0047_0332.gif) ![[G with combining low line]](https://www.rsc.org/images/entities/char_0047_0332.gif) ![[T with combining low line]](https://www.rsc.org/images/entities/char_0054_0332.gif) ![[T with combining low line]](https://www.rsc.org/images/entities/char_0054_0332.gif) ![[G with combining low line]](https://www.rsc.org/images/entities/char_0047_0332.gif) ![[G with combining low line]](https://www.rsc.org/images/entities/char_0047_0332.gif) ![[G with combining low line]](https://www.rsc.org/images/entities/char_0047_0332.gif) ![[T with combining low line]](https://www.rsc.org/images/entities/char_0054_0332.gif) ![[T with combining low line]](https://www.rsc.org/images/entities/char_0054_0332.gif) ![[T with combining low line]](https://www.rsc.org/images/entities/char_0054_0332.gif) ![[T with combining low line]](https://www.rsc.org/images/entities/char_0054_0332.gif) ![[T with combining low line]](https://www.rsc.org/images/entities/char_0054_0332.gif) ![[T with combining low line]](https://www.rsc.org/images/entities/char_0054_0332.gif) CCCAACCCGCCCAACCCCACCATT CCCAACCCGCCCAACCCCACCATT |
| MiRNA-122 | UGG AGU GUG ACA AUG GUG UUU G |
| MiRNA-21 | UAG CUU AUC AGA CUG AUG UUG A |
| MiRNA-155 | UUA AUG CUA AUC GUG AUA GGG GA |
| MiRNA-205 | UCC UUC AUU CCA CCC GAG UCU G |
| MiRNA-221 | ACC UGG CAU ACA AUG UAG AUU U |
| MiRNA-223 | UGU CAG UUU GUC AAA UAC CCC A |
| Mismatch sequences (MS) | UUG UAC UAC ACA AAA GUA CUG |
Ethical statement
The authors received the permission for using serum sample of human volunteers from Guilin's Fifth People's Hospital (China) according to institutional guidelines. All animal procedures and all experiments were performed in accordance with the Guidelines for Care and Use of Laboratory Animals of Guangxi Normal University (Guilin, China) and approved by the Animal Ethics Committee of China.Preparation of sample
miRNA was dissolved in DEPC-treated water to prepare a suitable concentration. The hairpin probes HP1 and HP2 were dissolved in 20 mmol L−1 Tris–HCl (100 mmol L−1 NaCl, 10 mmol L−1 MgCl2, pH 7.4). Before the reaction, the hairpins were pre-treated with the following process: the hairpins were heated to 90 °C and incubated for 5 min; then, they were slowly cooled to 25 °C. Then, the processed hairpins were stored at 0 °C.Gel electrophoresis
We prepared 4% agarose gel and 1 × TBE buffer (90 mmol L−1 Tris–H3BO3, 2 mmol L−1 EDTA, pH 8.0) for gel electrophoresis analysis. First, the agarose gel sample was run for 15 min under 70 V, and then run for 1 h under 100 V. At last, the agarose gel sample with ethidium bromide (EB) was stained for 35 min and then scanned by an Omega 16 Gel Document System.Fluorescence detection
First, the mixture of 1 μL 10 μmol L−1 HP1, 6 μL 20 μmol L−1 HP2, 1 μL 6 U Exo III and different concentration of miRNA122 in 1NEB1 buffer solution of 50 μL was reacted for 40 min at 37 °C. Second, 4 μL 75 μM NMM was added to the mixture, followed by the addition of 200 μL of 20 mmol L−1 Tris–HCl (100 mmol L−1 NaCl, 10 mmol L−1 MgCl2, 10 mmol L−1 KCl, pH = 7.4). The obtained solution was incubated under 30 °C for 20 min. Finally, the fluorescence value of the sample was measured by a LS-55 luminescence spectrometer (Perkin Elmer, USA). Sample test conditions were as follows: excitation wavelength at 400 nm, emission wavelength at 610 nm, the voltage of 700 V, and slit width of 10 nm.Results and discussion
The principle of strategy
The principle strategy is illustrated in Scheme 1. We specifically designed two hairpins of HP1 and HP2, such that the 5′-end of each sequence has a tail of 10 bases and 7 bases, respectively. HP1 contains the target identification sequence and X sequence, while HP2 contains X identification sequence and Y sequence. X and Y sequences are rich in guanine, which can form G-quadruplex under the action of K+. In the absence of the target, the G-quadruplex sequences are enclosed in the hairpin to produce a low fluorescence background value. However, the target can open the hairpin HP1 to form target-HP1 complexes that have 3′-hydroxyl flat termini of duplex DNA. Under the action of Exo III, target-HP1 complexes degrade to form cycle of target and release X sequences at the same time. Then, X sequence as the replacement of the target can open the HP2 and form an X-HP2 complex that has 3′-hydroxyl concave termini of duplex DNA. X-HP2 complexes are degraded by Exo III to form the circulation of X sequence and release Y sequence. At last, the released X and Y sequences form the G-quadruplex, and NMM is embedded in the G-quadruplex to produce strong fluorescence. miRNA can be detected by the change in the fluorescence value before and after the addition of the target.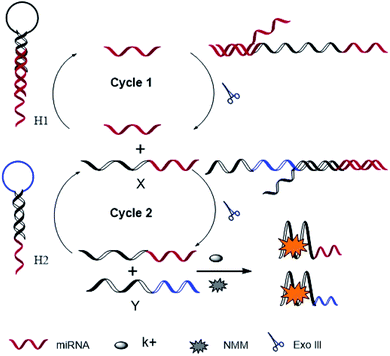 | ||
| Scheme 1 Schematic illustration of exonuclease III and G-quadruplex-based dual signal amplification strategy for miRNA detection. | ||
The feasibility of strategy
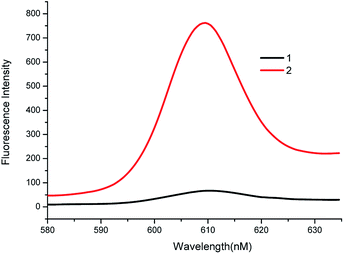
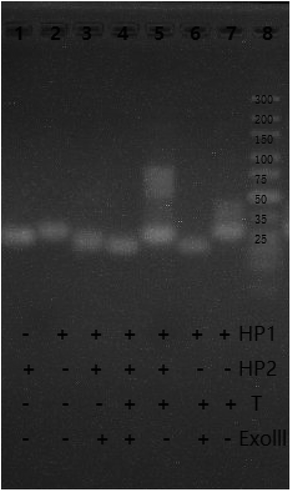
To explore the feasibility of the experiment, the fluorescence spectra and gel electrophoresis data of the system were analyzed. First, the feasibility of fluorescent characterization was investigated. As shown in Fig. 1, in the absence of the target, weak fluorescence intensity was recorded (Curve 1). This demonstrates that the G-quadruplex sequences are closed in the hairpin and cannot form G-quadruplex. When the target is present, fluorescence intensity of system increases rapidly, and presents a high signal-to-noise ratio (Curve 2). The changes in fluorescence intensity before and after adding the target prove the feasibility of the bioassay.Second, we explored the feasibility of the system by agarose gel electrophoresis. As shown in Fig. 2, as compared to band 6, band 7 has a bright stripe at around 35 bp. This phenomenon shows that the target has reacted with HP1 to form the target-HP1 complex. In the same position as of band 7, band 6 does not show the bright stripe because compounds are hydrolysed by Exo III. Furthermore, the target is added in bands 4 and 5. Although there is no Exo III, a bright stripe is observed in band 5 at 58 bp. However, band 4 has no bright stipe in the same location. These observations imply that HP1-target-HP2 complex was formed in band 5 and was hydrolysed by Exo III in band 4. To sum up, these phenomena can well explain the hybridization and hydrolysis process of the system.
Optimization of experimental conditions
To achieve a higher sensitivity, the following prominent influencing factors were optimized: the proportion of H1 and H2, the concentration and incubation time of Exo III, and the concentration of NMM. First, the proportion of H1 and H2 was optimized. As shown in Fig. S1 (ESI†), with the increase in the ratio of H1 to H2, the fluorescence intensity increased gradually. When the ratio reached 1![[thin space (1/6-em)]](https://www.rsc.org/images/entities/char_2009.gif) :
:![[thin space (1/6-em)]](https://www.rsc.org/images/entities/char_2009.gif) 12, the fluorescence intensity plateaued and then, a direct downward trend was observed. Hence, we chose 1
12, the fluorescence intensity plateaued and then, a direct downward trend was observed. Hence, we chose 1![[thin space (1/6-em)]](https://www.rsc.org/images/entities/char_2009.gif) :
:![[thin space (1/6-em)]](https://www.rsc.org/images/entities/char_2009.gif) 12 as the optimal ratio. Second, the concentration and incubation time of Exo III were optimized, as shown in Fig. S2 and S3 (ESI†). When the concentration and time reached 6 U and 40 min, respectively, the fluorescent value tends to plateau. Hence, 6 U and 40 min were chosen as the optimal values. Finally, the concentration of NMM was optimized, as shown in Fig. S4 (ESI†). When the concentration of the NMM reaches 1.5 μM, the fluorescence intensity reaches a plateau; therefore, the optimal value of 1.5 μM for NMM was selected.
12 as the optimal ratio. Second, the concentration and incubation time of Exo III were optimized, as shown in Fig. S2 and S3 (ESI†). When the concentration and time reached 6 U and 40 min, respectively, the fluorescent value tends to plateau. Hence, 6 U and 40 min were chosen as the optimal values. Finally, the concentration of NMM was optimized, as shown in Fig. S4 (ESI†). When the concentration of the NMM reaches 1.5 μM, the fluorescence intensity reaches a plateau; therefore, the optimal value of 1.5 μM for NMM was selected.
Sensitivity for miRNA detection
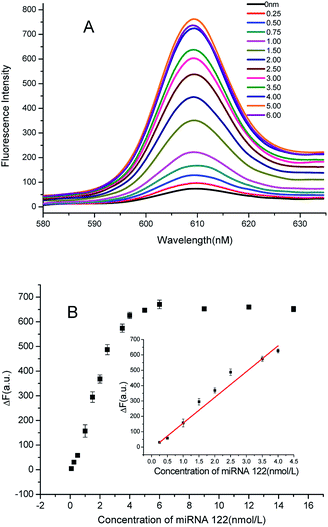
In order to demonstrate the ability to detect microRNAs, we explored the relationship between the concentration of the target and the fluorescence intensity. As shown in Fig. 3A, when adding a small amount of the target, a large amount of NMM is in the free-state, and hence, the fluorescence intensity is low. With an increase in the concentration of the target, the fluorescent value also increases. As the concentration of the target increases further, H1 and H2 can be opened to produce more X and Y sequences, which consequently form G-quadruplex. Then, NMM embeds in the G-quadruplex, leading to further enhancement in fluorescence intensity. When the concentration of the target reaches 4 nM, the fluorescence intensity tends to plateau. The illustrations in Fig. 3B represent the linear relationship of the target concentration and the fluorescence intensity ranging from 2.5 × 10⁻¹⁰ to 4 × 10⁻⁹ mol L−1, with a best fit linear equation of Y = 167.7X − 11.89 (R2 = 0.9877). The detection limit is 6 pM (3σ, n = 11). Compared with the previously reported methods, the sensitivity of the present method is superior with shorter reaction time, and no tedious operation is required (Table S1, ESI†). The repeatability of the method was also explored. We chose the miRNA concentration of 2.5 nM as an example; the relative standard deviation of fluorescence intensity was found to be 2.36% after nine parallel sample testing, indicating that the method has good repeatability.Detection specificity
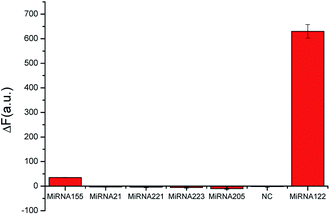
In order to prove the specificity of this bioassay, we made contrast fluorescence changes between miRNA-122 and its homologues, namely, miR-21, miR-155, miR-205, miR-221, miR-223 and mismatch sequences (Fig. 4). From Fig. 4, it can be seen that the hairpins H1 and H2 opened up to generate more G-quadruplex sequences, and the fluorescence intensity increased significantly in the presence of the target. However, when a target analogue of 50-times its concentration was added, fluorescence intensity changed slightly. These results indicate that the bioassay has good selectivity and can effectively distinguish miRNA-122 from its homologues even if their concentration 50-times that of miRNA-122.Real sample assay
We conducted the recovery test in 1% 10KD normal human serum samples and the results are listed in Table 2. We chose three appropriate concentrations of linear range to conduct recovery test: 0.50, 1.5, and 3.0 nM. The recovery was 98–110% and the relative standard deviation was 1.42–2.52%. These results indicate that this assay has good accuracy and can be applied to actual sample testing.| Sample | Added (nM) | Found (nM) | Recovery (%) | RSD (%) |
|---|---|---|---|---|
| 1 | 0.5 | 0.55 | 110 | 2.52 |
| 2 | 1.5 | 1.47 | 98.0 | 1.42 |
| 3 | 3.0 | 2.98 | 99.3 | 1.93 |
Conclusions
In summary, we developed a new fluorescence “take on” bioassay based on Exo III assisted recycling signal amplification for detection of microRNAs. Compared with some ultrasensitive detection methods, although the sensitivity of this method is not very high, it has the following advantages. First, the sample pretreatment process is simple and does not require labelling and time-consuming material preparation. Second, this method can be easily carried out, with mild reaction conditions and no tedious temperature-control processes. The reaction time is only 1 h. Third, the specificity is outstanding, which makes this method sensitive enough to distinguish miRNA-122 from its homologues with 50-times higher concentration. Therefore, this label-free fluorescence assay possesses excellent specificity and good reproducibility. This strategy might have a promising application for detecting other biomolecules in clinical diagnosis.Conflicts of interest
There are no conflicts to declare.Acknowledgements
This study was supported by National Natural Science Foundation of China (no. 21465007, 21565007, 21165004, 21163002), the Guangxi Natural Science Foundation of China (2015GXNSFGA139003), Bagui group of Guangxi province, and the project of State Key Laboratory for Chemistry and Molecular Engineering of Medicinal Resources, School of Chemistry and Pharmaceutical Science of Guangxi Normal University (CMEMR2014-A08).Notes and references
- C. Wei, L. Li and S. Gupta, Mol. Cell. Biochem., 2014, 387, 135 CrossRef CAS PubMed.
- T. Y. Ha, Immune Netw., 2011, 11, 135–154 CrossRef PubMed.
- M. Callari, P. Tiberio, L. D. Cecco, E. Cavadini, M. Dugo, C. Ghimenti, M. G. Daidone, S. Canevari and V. Appierto, Anal. Biochem., 2013, 437, 123–125 CrossRef CAS PubMed.
- C. T. Yang, M. Pourhassan-Moghaddam, L. Wu, P. Bai and B. Thierry, ACS Sens., 2017, 2, 635 CrossRef CAS PubMed.
- Y. C. He, B. C. Yin, L. Jiang and B. C. Ye, Chem. Commun., 2014, 50, 6236–6239 RSC.
- Y. Xu, Y. Wang, S. Liu, J. Yu, H. Wang, Y. Guo and J. Huang, Biosens. Bioelectron., 2016, 81, 236 CrossRef CAS PubMed.
- M. Labib and M. V. Berezovski, Biosens. Bioelectron., 2015, 68, 83 CrossRef CAS PubMed.
- S. Campuzano, M. Pedrero and J. M. Pingarrón, Anal. Bioanal. Chem., 2014, 406, 27 CrossRef CAS PubMed.
- C. Peterhaensel, I. Obermaier and B. Rueger, Anal. Biochem., 1998, 264, 279–283 CrossRef CAS PubMed.
- S. Roy, J. H. Soh and J. Y. Ying, Biosens. Bioelectron., 2016, 75, 238–246 CrossRef CAS PubMed.
- Y. Shen, F. Tian, Z. Chen, R. Li, Q. Ge and Z. Lu, Biosens. Bioelectron., 2015, 71, 322–331 CrossRef CAS PubMed.
- S. Derveaux, J. Vandesompele and J. Hellemans, Methods, 2010, 50, 227–230 CrossRef CAS PubMed.
- Y. Q. Liu, M. Zhang, B. C. Yin and B. C. Ye, Anal. Chem., 2012, 84, 5165–5169 CrossRef CAS PubMed.
- T. Liao, X. Li, T. Qian, Z. Kai, Z. Hang, L. Tang, Z. Sun and G. J. Zhang, Anal. Chem., 2017, 89, 5511–5518 CrossRef CAS PubMed.
- H. Fujita, Y. Kataoka, S. Tobita, M. Kuwahara and N. Sugimoto, Anal. Chem., 2016, 88, 7137 CrossRef CAS PubMed.
- P. Zhang, X. Wu, R. Yuan and Y. Chai, Anal. Chem., 2015, 87, 3202–3207 CrossRef CAS PubMed.
- F. Yin, H. Liu, Q. Li, X. Gao, Y. Yin and D. Liu, Anal. Chem., 2016, 88, 4600 CrossRef CAS PubMed.
- P. Miao, Y. Tang and J. Yin, Chem. Commun., 2015, 51, 15629 RSC.
- H. Jia, Y. Bu, B. Zou, J. Wang, S. Kumar, J. L. Pitman, G. Zhou and Q. Song, Analyst, 2016, 141, 6297 RSC.
- Z. M. Li, Z. H. Zhong, R. P. Liang and J. D. Qiu, Sens. Actuators, B, 2017, 238, 626–632 CrossRef CAS.
- H. Zhou, C. Yang, H. Chen, X. Li, Y. Li and X. Fan, Biosens. Bioelectron., 2017, 87, 552 CrossRef CAS PubMed.
- W. Lv, J. Zhao, B. Situ, B. Li, W. Ma, J. Liu, Z. Wu, W. Wang, X. Yan and L. Zheng, Biosens. Bioelectron., 2016, 83, 250 CrossRef CAS PubMed.
- X. Guo, X. Yang, P. Liu, K. Wang, Q. Wang, Q. Guo, J. Huang, W. Li, F. Xu and C. Song, Analyst, 2015, 140, 2016–2022 RSC.
- M. Hiratani, M. Ohara and R. Kawano, Anal. Chem., 2017, 89, 2312–2317 CrossRef CAS PubMed.
- H. Zhang, M. Hiratani, K. Nagaoka and R. Kawano, Nanoscale, 2017, 9, 16124 RSC.
- H. S. Yin, B. C. Li, Y. L. Zhou, H. Y. Wang, M. H. Wang and S. Y. Ai, Biosens. Bioelectron., 2017, 96, 106 CrossRef CAS PubMed.
- W. Engelen, K. M. van de Wiel, L. H. H. Meijer, B. Saha and M. Merkx, Chem. Commun., 2017, 53, 2862–2865 RSC.
- Y. Tang, X. He, Z. Zhou, J. Tang, R. Guo and X. Feng, Chem. Commun., 2016, 52, 13905 RSC.
- M. Yan, W. Bai, Z. Chao, Y. Huang, Y. Jiao and A. Chen, Biosens. Bioelectron., 2015, 77, 613 CrossRef PubMed.
- C. Zhao, L. Wu, J. Ren and X. Qu, Chem. Commun., 2011, 47, 5461–5463 RSC.
- E. Xiong, X. Yan, X. Zhang, Y. Liu, J. Zhou and J. Chen, Biosens. Bioelectron., 2017, 87, 732–736 CrossRef CAS PubMed.
- Y. F. Liu, J. T. Xue, H. J. Yan, L. J. Yang, W. Liu and X. D. Sun, Chin. J. Anal. Chem., 2017, 45, 303–308 CAS.
- S. Bi, L. Li and Y. Y. Cui, Chem. Commun., 2012, 48, 1018–1020 RSC.
- Y. G. Yan, S. Z. Yue, T. T. Zhao, B. Y. Luo and S. Bi, Chem. Commun., 2017, 53, 12201 RSC.
- S. Bi, X. Q. Jia, J. Y. Ye and Y. Dong, Biosens. Bioelectron., 2015, 71, 427–433 CrossRef CAS PubMed.
- S. Bi, B. Y. Luo, J. Y. Ye and Z. H. Wang, Biosens. Bioelectron., 2014, 62, 208–213 CrossRef CAS PubMed.
- C. Ding, X. Q. Li, W. Wang and Y. Y. Chen, Biosens. Bioelectron., 2016, 83, 102–105 CrossRef CAS PubMed.
- X. Xiao, J. Tao, H. Z. Zhang, C. Z. Huang and S. J. Zhen, Biosens. Bioelectron., 2016, 85, 822–827 CrossRef CAS PubMed.
- J. W. Sun, W. Jiang, J. Zhu, W. Li and L. Wang, Biosens. Bioelectron., 2015, 70, 15–20 CrossRef CAS PubMed.
Footnote |
| † Electronic supplementary information (ESI) available. See DOI: 10.1039/c8ra01605d |
| This journal is © The Royal Society of Chemistry 2018 |

