 Open Access Article
A new mechanism for improving electromagnetic properties based on tunable crystallographic structures of FeCoNiSixAl0.4 high entropy alloy powders†
Bin Zhanga,
Yuping Duan *a,
Yulong Cuia,
Guojia Mab,
Tongmin Wang
 *a and
Xinglong Dong
 a
a
aKey Laboratory of Solidification Control and Digital Preparation Technology (Liaoning Province), School of Materials Science and Engineering, Dalian University of Technology, Dalian 116085, P. R. China
bBeijing Aeronautical Manufacturing Technology Research Institute, Beijing 100024, PR China
First published on 19th April 2018
Abstract
Mechanical grinding method was employed to prepare FeCoNiSixAl0.4 high entropy alloy powders, which present a simple solid solution structure (FCC and BCC). After annealing at 673 K, a large amount of BCC phase precipitate and a small amount of CoFe2O4 phase generate. The change of crystal structure may lead to an increase in Ms (from 100.3 emu g−1 to 124.2 emu g−1) and a decrease in Hc (from 107 Oe to 59.5 Oe for FeCoNiSi0.3Al0.4). The silica content has a significant effect on the electromagnetic parameters of the as-milled and as-annealed alloy powders, presenting the trend of first increase and then decrease. And the dielectric constant is obviously improved after annealing (e.g. from 8.48 to 11.21 and from 0.15 to 2.84 for the ε′ and ε′′ of FeCoNiSi0.3Al0.4 at 18 GHz, respectively), while the permeability is reduced. Compared with those of the as-milled samples, the μ′ of as-annealed FeCoNiSixAl0.4 (x = 0.1, 0.3, 0.4) remain unchanged or even increase due to the formation of CoFe2O4. Meanwhile, the relative content of the precipitated BCC to FCC for FeCoNiSi0.3Al0.4 enhance with the annealing temperature increase from 573 K to 773 K, and then reduce. And the ε′ and μ′ at 2 GHz present the same trend as the content ratio (ABCC/AFCC), while the ε′′ improve obviously after annealing, corresponding to the elevation of conductivity.
1. Introduction
As the electronic devices using microwave frequency range are growing every single year, the hazards of electromagnetic (EM) wave on human body and equipment are increasing. To reduce or avoid the harms of EM wave, high-performance EM wave absorbing materials have high demand in civil, commercial and military applications, especially working under harsh conditions, such as oxidizing and corrosive conditions.1–4 Meanwhile, the lightweight nanomaterials are the primary choice for EM wave absorbers.5,6 Therefore, the high entropy alloy powders with the above merits are excepted to be a new generation of EM wave absorbing materials.The high entropy alloys (HEAs) have received much attention in last ten years due to their high hardness and strength, outstanding wear resistance, good corrosion and oxidation resistance and combinations of two or more properties, which brings the new alloy design concept.7–15 Different from traditional alloy, HEAs are defined as the alloys with five or more principal elements in equimolar or near-equimolar ratio and tend to form simple body-centered-cubic (BCC) and/or face-centered-cubic (FCC), and hexagonal close packed (HCP) solid solution due to the high configurational entropy.16–21 In recent studies, some of the quaternary and ternary alloys in equimolar ratio are also considered as HEAs.22–24
Lin et al.12 have proven that the corrosion potential and pitting potential of the FeCoNiCrAl0.5 HEA in a 3.5 wt% NaCl solution are smaller than those of the AISI 304L stainless steel. Effects of Al element on the corrosion resistance behaviors of Fe1.5Ni0.5CrMnAlx HEAs were investigated, and it can be concluded that the pitting potentials of Al-containing alloys in NaCl solution are obviously lower than that of Al-free alloy.25 These are because the surface of the alloy is easy to form an oxide film of Al2O3. Zhang et al.26 have studied the high temperature oxidation properties of NbCrMoAl0.5X (X = Ti, V, TiV, TiVSi0.3). It proved that the addition of Al, Ti or Si element help to improve the oxidation resistance. Therefore, we can get that the HEAs with adding Si–Al elements have excellent corrosion resistance and high temperature oxidation resistance due to the presence of the “cocktail effects” for HEAs.
Recently, the magnetic properties of HEAs with varying composition have been extensively investigated. The CuAl contents had obvious influence on the microstructure and saturation magnetization of FeCoNi(CuAl)x alloy, and the Ms of FeCoNi(CuAl)0.8 alloy increased from 78.9 Am2 kg−1 to 93.1 Am2 kg−1 by annealing at 673 K.27 Annealing can effectively improve the saturation magnetization of a certain constituent. Zhang et al. have prepared the FeCoNi(SiAl)x HEAs by arc-melting method and found that the electrical resistivity increased and sacrificed the magnetization with adding SiAl content, and the coercivity with a single-phase structure (BCC or FCC) was smaller than that of the two-phase structure (BCC and FCC).22 Therefore, the alloy components and annealing process have great influence on the magnetic properties of alloys. In addition, Chen et al. found that the electrical conductivity of FeCoNiCrAlx alloys decreased as x increasing in single-phase (FCC or BCC) regions and the electrical conductivity in duplex phase region possessed smaller value than that in single region.14 It is clearly seen that the electrical conductivity is related to the composition and phase structure. As far as we know, Liu et al. have investigated the magnetic and EM wave absorbing properties of FeCoNiCrAl and FeCoNiCrAl0.8 HEAs at different milling time. Ms ranges from 20.21 emu g−1 to 67.52 emu g−1, while Hc distributes over an interval of 59.68 Oe to 142 Oe.28,29
Although a large number of literatures have studied the microstructures, mechanical and magnetic properties of HEAs, little attention have been paid to the effects of element content and annealing on the tunable crystallographic structures and relationship between crystal structures and EM properties of the high entropy alloy powders. In the paper, the quinary FeCoNiSixAl0.4 HEA powders were prepared by mechanical alloying and processed by subsequent annealing treatment. The tunable crystallographic structures and EM properties of the alloy powders were investigated by adding different Si content. In addition, since the HEA powders can produce BCC and CoFe2O4 new phase after annealing, so effects of crystal structure on the magnetic and EM properties were studied. It is useful to modulate crystal structure and to optimize magnetic properties and EM parameters.
2. Experimental
2.1 Synthetic procedures
The elemental powders of Fe, Co, Ni, Si, and Al with purity higher than 99% and particle size less than 50 μm were used as raw materials. The HEA powders with nominal compositions of FeCoNiSixAl0.4 (expressed in molar ratio, denoted as Mx, x = 0.1, 0.2, 0.3, 0.4, and 0.5) were prepared by mechanical milling for 70 h in a planetary ball mill (QM-QX4). A moderate amount of anhydrous ethanol as a process control agent was added into the reaction system before milling. The powder-to-ball (10 mm and 6 mm in diameter) weight ratio was 1![[thin space (1/6-em)]](https://www.rsc.org/images/entities/char_2009.gif) :
:![[thin space (1/6-em)]](https://www.rsc.org/images/entities/char_2009.gif) 20, and the stainless steel pot rotation speed was 300 rpm. In addition, a pause of 4 min have been done to avoid excessive heating during milling, and the direction of the rotation was changed every half an hour. Then the alloy powders were annealed at 673 K, and denoted as Ax (x = 0.1, 0.2, 0.3, 0.4, and 0.5).
20, and the stainless steel pot rotation speed was 300 rpm. In addition, a pause of 4 min have been done to avoid excessive heating during milling, and the direction of the rotation was changed every half an hour. Then the alloy powders were annealed at 673 K, and denoted as Ax (x = 0.1, 0.2, 0.3, 0.4, and 0.5).
2.2 Characterization
The phase composition of the prepared powders was tested by X-ray diffraction (XRD, Empyrean) using a Co Kα radiation (λ = 1.78901 Å) in the 2θ scan ranging from 30° to 120°, and the operating voltage and tube current was 35 kV and 50 mA. The morphology of the powders was performed by scanning electron microscopy (SEM, SUPRA55) with EDS. And the size distribution of alloy powders were measured by laser scattering particle size distribution analyzer (LA960WET). The magnetic properties of the alloy powders were measured with vibrating sample magnetometer (VSM7404) with a maximum applied field of 10![[thin space (1/6-em)]](https://www.rsc.org/images/entities/char_2009.gif) 000 Oe at room temperature. The electrical conductivity was measured using four point probe measurement (RTS-9), and the cylinders used for measurement were cold pressed by presses at 10 MPa. The complex permittivity (ε(f)) and permeability (μ(f)) were measured by Agilent vector network analyzer (8720B) in the frequency of ranging of 2–18 GHz. The mixture used for EM parameter measurements were prepared by blending the milled powers and paraffin at weight ratio of 6
000 Oe at room temperature. The electrical conductivity was measured using four point probe measurement (RTS-9), and the cylinders used for measurement were cold pressed by presses at 10 MPa. The complex permittivity (ε(f)) and permeability (μ(f)) were measured by Agilent vector network analyzer (8720B) in the frequency of ranging of 2–18 GHz. The mixture used for EM parameter measurements were prepared by blending the milled powers and paraffin at weight ratio of 6![[thin space (1/6-em)]](https://www.rsc.org/images/entities/char_2009.gif) :
:![[thin space (1/6-em)]](https://www.rsc.org/images/entities/char_2009.gif) 4, and then a concentric cylinder with 3.00 mm in inner diameter, 7.00 mm in outer diameter and 2.00 mm in thickness was prepared by using a mold.
4, and then a concentric cylinder with 3.00 mm in inner diameter, 7.00 mm in outer diameter and 2.00 mm in thickness was prepared by using a mold.
3. Results and discussion
3.1 Structural characterization
Fig. 1(a) shows the XRD patterns of as-milled FeCoNiSixAl0.4 alloy powders with varying Si content. It is distinct that all alloy powders are composed of a large amount of FCC phase (corresponding to (111), (200), (220) crystal face) and a small amount of BCC phase (corresponding to (110), (200), (211) crystal face), indicating the formation of complete solid solution (high entropy alloy). The diffraction peaks of BCC phase are obscure and even no peak of the (110) crystal face is observed, which could be due to the low content and the relatively low diffraction intensity.30–32 The peaks of Si at around 33.2° and 55.5° can be indexed as the (111) and (220) diffraction planes of Si (JCPDS, no. 27-1402), respectively. Si is incomplete dissolution because Si has a diamond-type crystal structure that is different from other elements. And the dissolution rate of the element is related to the melting point and crystal structure, and the elements with low melting point and the same crystal structure are more soluble. In addition, the structure of diamond-type is more difficult to break up, which is the another reason for Si failed to dissolve. The insertion shows an enlarged picture of the main peaks of FCC phase. Because of the lattice parameter of FCC phases decrease slightly by adding Si element with smaller atomic radius, the peaks are shifted rightwards. In addition, the relative XRD intensity of FCC phase reduce along with the increase of Si content. This is because the augment of the X-ray diffusive scattering effect, and this phenomenon is the result of the larger lattice distortion caused by the atomic radius's difference between the adding atoms and inherent atoms. Such a phenomenon is not uncommon for HEAs system, and it also presents in other HEAs system.10,14 For example, the relative intensity of main peak decreases with increasing Al addition in FeCoNiCrAlx alloys.Fig. 1(b) shows the XRD patterns of as-annealed FeCoNiSixAl0.4 alloy powders with varying Si content. The crystal structures are same with those of milled alloy powders. Differently, the intensity of the Si peaks at 33.2° and 55.5° decrease and this is because the silicon gradually dissolves in the matrix after annealing. And the intensity of the diffraction peaks magnify, on account of the increase in crystallinity and crystallite size and the decrease in internal stress of the alloy powders. The illustration shows an enlarged picture of peak positions at 2θ = 50–55°. The offset direction is similar with that of the milled powders. In addition, the diffraction peaks located at 2θ of 52.7° and 41.53° appear after annealing, indicating that BCC alloy phases precipitate and the CoFe2O4 (JCPDS, no. 22-1086) phases generate. And the size of the CoFe2O4 phase for samples A0.1, A0.3, A0.4 are larger than others. Moreover, the relative content of BCC to FCC (ratio of the integral area, ABCC/AFCC) for the as-annealed powders are presented in the illustration.
3.2 Microscopic characterization
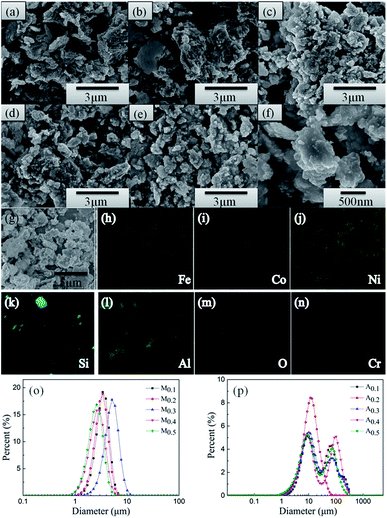
The morphologies and particle sizes of different samples are characterized using SEM. Fig. 2(a–e) presents the back-scattered images of the as-annealed FeCoNiSixAl0.4 alloy powders with varying Si content. The sizes of the particles present a uneven distribution, varying from hundreds of nanometers to hundreds of micrometers. All of the alloy particles present an aggregation composed of elliptic ball shape (see Fig. 2(f)) for using alcohol as grinding media, which leads to the aspect ratio increase and results in the decline of eddy current loss and the acclivity of surface polarization simultaneously.33–36 It can be seen that the morphologies of all alloy particles are similar and the particle size distribution are inhomogeneous. So the size distribution of as-milled and as-annealed alloy powders were measured by laser particle size distribution analyzer, as shown in Fig. 2(o and p). After annealing, the particle sizes are obviously increased by the aggregation of small particles. Roughly, the sizes of the as-milled particles present an uptrend with the increase of Si content and then decline. However, the size distribution in Fig. 2(p) is abnormally due to the irregular aggregation of particles during the annealing process. Fig. 2(g–n) show the elemental mapping of Fe, Co, Ni, Si, Al, O, and Cr for sample A0.3. Among them, the elements of O and Cr are introduced into system during the ball milling. It is evident that the other five elements are dispersed better and there is the presence of undissolved silicon element. This is corresponding to the result of XRD. Besides, the oxidation of the particles' surface is inevitable.The TEM (a and e) and HRTEM (b and f) images of the as-milled (a–c) and as-annealed (d–h) FeCoNiSi0.3Al0.4 HEA powders are presented in Fig. 3. As depicted in the bright field image (Fig. 3(a) and (e)), the smaller particles of both HEA powders also present elliptic ball shape. The interplanar d spacings of 0.20 nm and 0.21 nm could be obviously observed in the HRTEM image, which are consistent with the (110) and (111) crystallographic planes of the BCC and FCC phase, respectively. Moreover, the newly generated CoFe2O4 phase can be observed from HRTEM and SAD, which is in agreement with the XRD dates. Obviously, various crystalline structures are surrounded by amorphous structure, and the boundaries between crystal and amorphous phases become more pronounced after annealing. From the SAD, it can be seen that more amorphous phase are contained in the milled sample and many crystal diffraction spots are generated after annealing. This illustrates that the crystallinity rise after annealing.
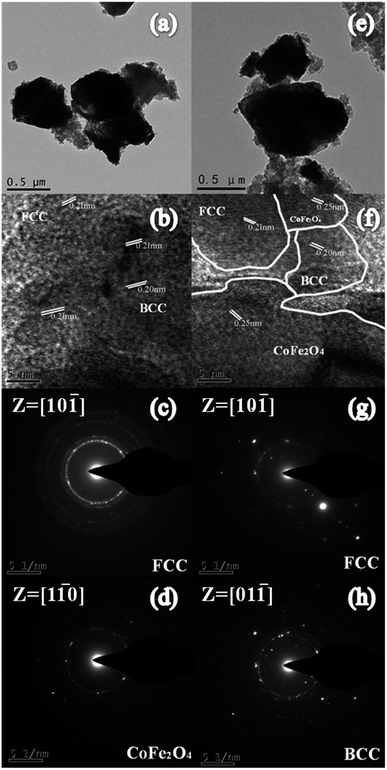 | ||
| Fig. 3 (a and e) TEM and (b and f) HRTEM images of (a–c) as-milled and (d–h) as-annealed FeCoNiSi0.3Al0.4 HEA powders. The SAED patterns (c) and (d, g and h) for the samples. | ||
3.3 Magnetic properties
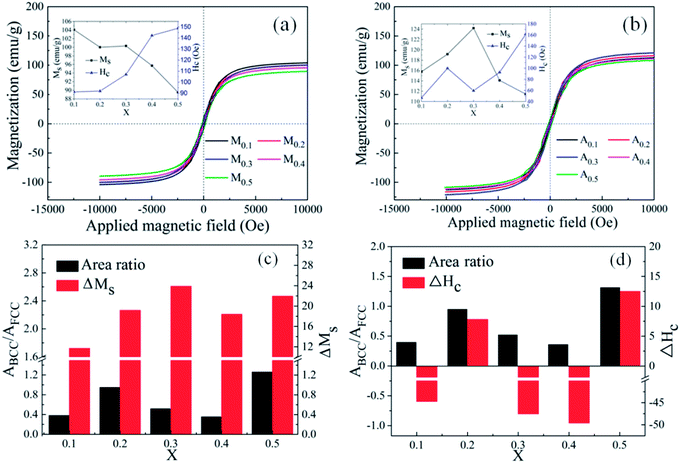
Fig. 4 displays the hysteresis loops of (a) M0.1–0.5 and (b) A0.1–0.5 alloy powders measured at room temperature with an applied field of −10![[thin space (1/6-em)]](https://www.rsc.org/images/entities/char_2009.gif) 000 Oe to 10
000 Oe to 10![[thin space (1/6-em)]](https://www.rsc.org/images/entities/char_2009.gif) 000 Oe. It is obvious that all alloy powders present partial soft magnetic peculiarity. Compared with the FeCoNiCrAl HEA powders, all alloy powders possess biggish saturation magnetization, which may lead to a higher initial permeability.28,29 The coercivity (Hc) and saturation magnetization (Ms) of FeCoNiSixAl0.4 as a function of Si content are given in the inset. In Fig. 4(a), the Ms decreases from 104.1 emu g−1 to 89.5 emu g−1 and the Hc increases from 91.3 Oe to 148.8 Oe. Adversely, the Ms of A0.3 has the maximum value (124 emu g−1) and declines in other concentrations, while the Hc presents an enlarging trend within the whole range with a deviation in A0.3 in Fig. 4(b).
000 Oe. It is obvious that all alloy powders present partial soft magnetic peculiarity. Compared with the FeCoNiCrAl HEA powders, all alloy powders possess biggish saturation magnetization, which may lead to a higher initial permeability.28,29 The coercivity (Hc) and saturation magnetization (Ms) of FeCoNiSixAl0.4 as a function of Si content are given in the inset. In Fig. 4(a), the Ms decreases from 104.1 emu g−1 to 89.5 emu g−1 and the Hc increases from 91.3 Oe to 148.8 Oe. Adversely, the Ms of A0.3 has the maximum value (124 emu g−1) and declines in other concentrations, while the Hc presents an enlarging trend within the whole range with a deviation in A0.3 in Fig. 4(b).
In the light of the fact that the Ms is primarily determined by the composition and atomic-level structure, and the Hc is sensitive to the grain size, impurity, and the heat-treatment process.22 So, the reason for the Ms decrease with the increment of Si content is more 3d electrons of magnetic atoms transfer to the 2p electron layer of Si atoms, while the augment in Hc is due to the ineradicable point defect rise, corresponding to the Si content increase. After annealing, the Ms and Hc of the alloy powders with same Si content rise. The Ms increase is attributed to the precipitation of the BCC phase, and the magnitude of ΔMs (Ms (Ax) − Ms (Mx)) is related to the relative content of the precipitated BCC to FCC (ABCC/AFCC). Although the stress and defects generated in the process of milling are reduced after annealing, the increase in magnetic anisotropy constant (K1), magnetostriction coefficient (λs), crystallinity, crystallite size (D), particle size and Ms can magnify magnetic anisotropy, stress anisotropy and shape anisotropy, which bring about the increase of Hc. The anomalies of ΔMs and ΔHc (Hc (Ax) − Hc (Mx)) for A0.1, A0.3 and A0.4 attribute to the generation of new phase CoFe2O4 (in Fig. 4(c and d)). Namely, the CoFe2O4 phase can effectively improve Ms and lower Hc. The analysis of magnetic properties are corresponding to the test results of XRD.
3.4 EM parameters analysis
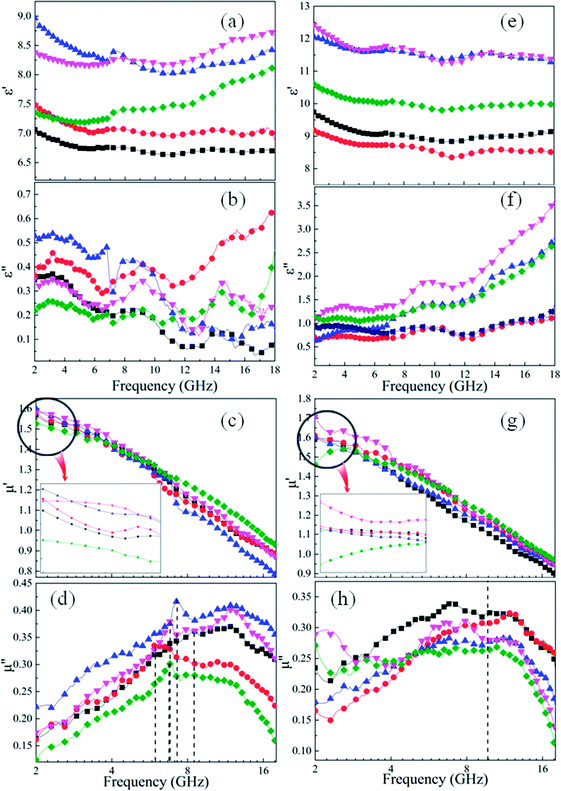
For microwave absorbing materials, the relative complex permittivity (εr = ε′ − jε′′) and the relative complex permeability (μr = μ′ − jμ′′) are the key point to determine the absorbing properties. Generally, the real parts (ε′ and μ′) and the imaginary parts (ε′′ and μ′′) represent the energy storage and energy dissipation respectively. The energy is stored through dipole displacement polarization and resonance when the EM wave radiates to the surface of the absorbing materials. And the energy is dissipated by the way of conduction loss, dielectric loss and magnetic loss.Fig. 5 shows the frequency dependence of (a and e) the real parts (ε′) and (b and f) the imaginary parts (ε′′) of complex permittivity of (a and b) as-milled and (e and f) as-annealed (at 673 K) alloy powders within the range of 2–18 GHz. The ε′ of all alloy powders change a little in the 2–18 GHz range, and the ε′′ of as-annealed powders gradually rise with the increment of frequency. It is apparent that the Si contents have a strong impact on the permittivity of both kinds of alloy powders. The ε′ of alloy powders M0.1–0.5 increase from M0.1 (≈6.8) to M0.3 (≈8.5) along with the Si content increasing and get the maximum value at M0.3, and then decrease to M0.5 (≈7.5). And the change of ε′′ (in the frequency range of 2–10 GHz) along with Si content agrees with that of ε′. The increase in dielectric constant can be illustrated by the following three reasons. Firstly, the polarization sites have a positive correlation with the point defects, and as the increase of Si content induce more point defects, which results in the growth of polarization effect. Secondly, while at a relatively lower content (x ≤ 0.3), the surface polarization rises with the enlargement of aspect ratio, corresponding to the increase of Si content (see Fig. 2(o)). Finally, the skin depth presents an uptrend with the increment of electrical resistivity. Previous researches show that only part of magnetic materials within the skin depth interact with the EM wave.37 The larger the skin depth is, the more fraction of magnetic materials absorbing the EM wave is. The decrease of dielectric constant can be explained by the following reasons similarly. Compared with the metal elements, the brittleness of Si element is larger. While at a relatively higher content (x ≥ 0.4), the surface polarization weakening caused by the reduction of aspect ratio gives rise to the decrease of permittivity. Moreover, researches demonstrate a negative correlation between the interaction radius of dipole and the point defects when the defects are more, and as the smaller radius induce the less displacement polarization.38 Furthermore, the electrical resistivity (ρ = 1/σ) increase results in the decline of ε′ and ε′′ (conduction loss) directly, according to the formulas Debye's relaxation:39
| ε′ = σ/ω2τε0 + ε∞ | (1) |
| ε′′ = σ/ωε0 | (2) |
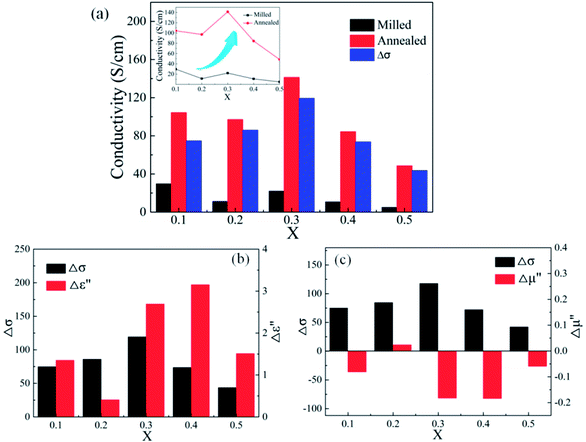
Compared with the as-milled samples, the as-annealed samples possess a larger dielectric constant value. The most fundamental reason is the decrease in defects, the formation of CoFe2O4 and BCC (FeCo) phase and the growth of particles from the process of annealing. First of all, the interaction radius of dipole presents an uptrend with the reduction of defects, and then the displacement polarization could be increased, which leads to the enlargement of ε′. At the same time, an increase in phase-interface caused by the formation of CoFe2O4 and BCC phase induces the enhancement of interfacial polarization. And the growth of particles results in the increase of surface polarization. The ε′ of the alloy powders A0.2 (≈8.6) and A0.4 (≈11.7) does not conform to the original change rule of the as-milled powders. This may be caused by the particle sizes are different from other samples. The sample A0.2 has smaller particle, and the sample A0.4 has larger particles than other alloy powders (see Fig. 2(p)). Meanwhile, the augment of electrical conductivity (see Fig. 6(a)) caused by the decrease of defects brings about the augment of ε′ and ε′′ (according to the eqn (1) and (2)), especially in the high frequency area. And the magnitude of Δε′′ (ε′′ (Ax) − ε′′ (Mx)) at high frequency for A0.1, A0.3, and A0.5 agree well with the increment of conductivity (Δσ) (in Fig. 6(b)). To the sample A0.2, the polarization loss is less than others due to the generation of smaller particles, which leads to the smaller increase of ε′′, and the opposite is true for the sample A0.4. Namely, the ε′′ in high frequency is mainly the role of conductive loss. And the enlargement of conductivity can be illustrated by the formula of the metallic resistivity:
 | (3) |
Fig. 5 shows the frequency response of (c and g) the real parts (μ′) and (d and h) the imaginary parts (μ′′) of complex permeability of (c and d) as-milled and (g and h) as-annealed (at 673 K) alloy powders within the 2–18 GHz range. As shown in Fig. 5(c and d), the μ′ decrease gradually and stabilize in the high frequency, and the μ′′ present an open downward parabolic shape over the almost entire frequency range, which is caused by the inhomogeneity of the particle size distribution (see Fig. 2(o)).40 Similar to the change of the complex permittivity, the μ′ of alloy powders M0.1–0.5 at 2 GHz increase from M0.1 (1.57) to M0.3 (1.60) along with the increase of Si content and get the maximum value at M0.3, and then decrease to M0.5 (1.52). It can be explained by the empirical formula of the initial permeability (μi):41
 | (4) |
| μi − 1 = 4πMs/(Hk + 4πMsNh) | (5) |
The imaginary parts (μ′′) of complex permeability possess a wide resonance peak over the whole frequency range. The changing trend of μ′′ is consistent with that of μ′, and this can be illustrated by the formula of eddy current loss. Formula is expressed as follows:
 | (6) |
It is clearly that μr′′ is proportional to μ′ and conductivity (σ). So the value of μr′′ increases firstly and then decreases. To recognize carefully, the location of resonance peaks agree with the distributions of particles. This can be illustrated by the formula of natural resonance or shape-dependent Snoek's limit. According to the natural resonance frequency equation,
| 2πfr = γHa | (7) |
| (μi − 1)f2r = (γ/2π)24πMs(Hk + 4πMsN⊥) | (8) |
 | (9) |
Compared with those of the as-milled alloy powders, the μ′ of the A0.1, A0.3, A0.4 samples get larger and the A0.2 and A0.5 get smaller, ranging from 1.46 (A0.5) to 1.70 (A0.4) (see Fig. 5(g and h)). The reason for this phenomenon is the BCC (FeCo) phase precipitate out after annealing, and Fe and SiAl elements are separated from each other. The Ms, K1 and λs for the as-annealed powders increase at the same time and the increment of Ms for A0.1, A0.3, A0.4 is larger than others, corresponding to the formation of CoFe2O4 phase, which result in the diversification. In addition, the decrease in σ and β caused by annealing bring about the amplify of μ′ according to the eqn (4), which prompt the enlargement of μ′. Moreover, these three samples possessing larger values of Δμ′ (μ′ (Ax) − μ′ (Mx)) have smaller ΔHc. On account of the skin depth reduction caused by the enlargement of conductivity and particle sizes, the μ′′ of the as-annealed samples become smaller. And the magnitude of Δμ′′ (μ′′ (Ax) − μ′′ (Mx)) for A0.1, A0.3, and A0.5 agree with the increment of conductivity (Δσ) (in Fig. 6(c)). To the sample A0.2, the particle size turns into smaller than the skin depth, which leads to the larger Δμ′′, and the opposite is true for the sample A0.4. In addition, the resonance peaks disappear after annealing, which is caused by the extreme non-uniformity of the particles (see Fig. 2(p)).
Based on these results, we propose the change of crystal structure for FeCoNiSixAl0.4 system in the process of milling and annealing and the interaction mechanism with EM wave as a consistent explanation of all the above experimental observations as depicted in Fig. 7. The initial powders of Fe, Co, Ni, Si, and Al possess the crystal structure with BCC, HCP, FCC, CDT (cubic diamond type), and FCC phase, respectively. The FeCoNiSixAl0.4 alloy powders with FCC and BCC phase crystal structure were prepared by the process of ball milling, where, all the elements are mixed together randomly. The alloy powders show elliptic ball shape because of the use of alcohol as a control agent.
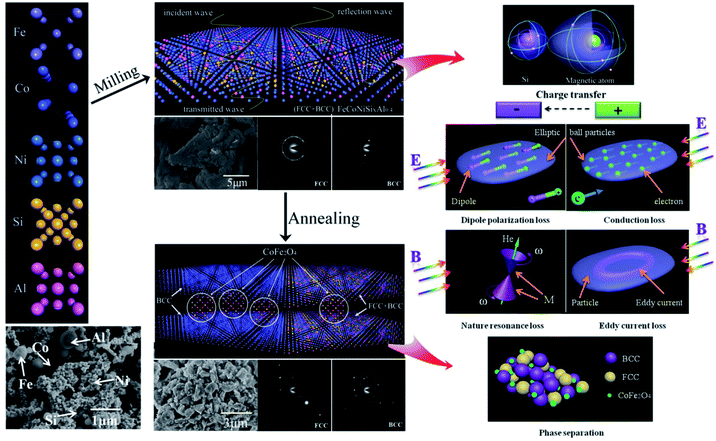 | ||
| Fig. 7 Schematic illustration of the change of crystal structure in the process of milling and annealing and the mechanism interacted with EM wave for HEA powders. | ||
For the milled alloy powders, Si element are evenly distributed around the magnetic elements, and the charge flows from magnetic atoms into the silicon atom, which brings about the Ms decrease and a microstructural asymmetry generation, and results in the formation of a permanent electric dipole that can excite a dipole polarization under the alternating EM field. When the EM wave irradiate to the particle surface, the EM field will generate the electric and magnetic field component in the direction of paralleling to the surface of particles. The alternating electrical field interact with the alloy material to create conduction loss. Meanwhile, the alloy particles will be magnetized under the alternating magnetic field to generate the magnetization (M). The compound interaction of magnetocrystalline, shape and stress anisotropy field produce a valid field (He), which can replace the extra steady magnetic field and interact with M, then generate nature resonance when satisfies the formula 2πf = γHe. In addition, a kind of ring induction current, known as eddy current, are generated in the direction of perpendicular to the magnetic flux, which can induce the eddy current loss. All of the above types can attenuate the EM wave.
After annealing, the FeCo and CoFe2O4 phase respective with BCC phase and spinel crystal structure are separated out from the matrix, which give rise to the increase in interface (phase interface and particle surface) polarization. And the decrease of defects magnify the conduction loss. Meanwhile, the clutter distribution of anisotropy caused by the phase dissociation leads to the clutter distribution of valid field, which result in the resonance peak disappear. And the size of the reunited alloy powders are larger than that of the reduced skin depth, which bring about the reduction of the effective volume for the alloy powders interacted with EM wave.
To further investigate the variations of EM parameters with the annealing temperature, the XRD and EM parameters of as-annealed (at 573–873 K) FeCoNiSi0.3Al0.4 alloy powders were tested.
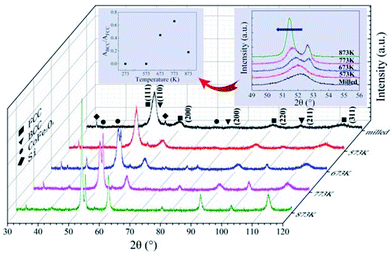
XRD patterns of the as-milled and as-annealed FeCoNiSi0.3Al0.4 alloy powders are shown in Fig. 8. Along with the annealing temperature rises, the intensity of (111), (200) and (220) for FCC increase, which attribute to the augment of crystallinity, while BCC (corresponding to (110), (200) and (211) crystal face) begin to precipitate at 673 K and get the maximum value at 773 K, and then decrease. In addition, the new phase CoFe2O4 starts to generate at 673 K and its magnitude gets down with the annealing temperature increasing. The insect shows an enlarged picture of the main peaks of FCC and BCC phase. Obviously, the peaks shift leftwards slightly due to the increase in the lattice parameter of the FCC phase. It can be illustrated that the Si element dissolves into the alloy phase gradually during the annealing process. And the intensity of 33.2° for silicon peak is reduced by degrees. Meanwhile, the relative content of BCC to FCC (ABCC/AFCC) for the as-annealed powders at different temperatures are presented in the illustration, and it shows a tendency to increase first (from 573 K to 773 K) and then to decrease.
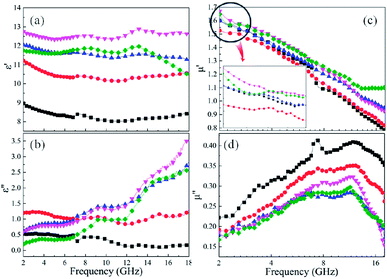
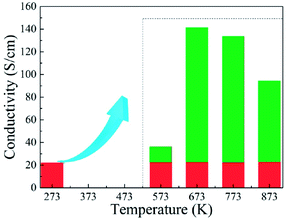
Fig. 9 shows effects of the annealing temperature on the (a) ε′ (b) ε′′ (c) μ′, and (d) μ′′ for the as-annealed (at 573–873 K) FeCoNiSi0.3Al0.4 alloy powders. The ε′ presents an uptrend with the increase of annealing temperature and reaches a maximum at 773 K, and then decreases. This may be caused by the relative content of BCC to FCC (in Fig. 8), since the growth of these two phases interface can store more energy. The effects of annealing temperature on ε′′ are obvious, especially in high frequency area, and the increment of ε′′ depends on the increment of conductivity (in Fig. 10). This is also true that the conduction loss play a major role in the high frequency range. The annealed sample (at 773 K), possessing larger interfacial polarization and loss, get a greater increase in ε′′ than other samples. After annealing, the μ′ at 2 GHz decrease first and then increase (from 573 K to 773 K), which is the combination effect of Ms, K1 and λs, and the decrease in μ′′ may be caused by the fact that the particle size turn into larger than the skin depth, similarly.
The reflection loss of the as-milled and as-annealed (673 K) FeCoNiSixAl0.4 (x = 0.1, 0.2, 0.3, 0.4, and 0.5) alloy powders and the EM parameters of as-annealed (573–873 K) FeCoNiSixAl0.4 (x = 0.1, 0.2, 0.4, and 0.5) alloy powders are presented in the supporting.
4. Conclusions
FeCoNiSixAl0.4 HEA powders are prepared by mechanical ball milling and processed by annealing (at 673 K), and the relation between Si content, microstructure and magnetic and EM properties are investigated. The Ms decrease and the Hc increase with the increase of Si content for the as-milled samples and the Ms and Hc rise after annealing. The CoFe2O4 phase generated in the annealing process has a beneficial to magnify Ms and diminish Hc. The ε′ of the as-milled alloy powders rise first along with the Si content increase, then reduce, and has a maximum value, ε′ ≈ 8.5 (M0.3). The μ′ present the same changing rule, and get the maximum value at M0.3 (1.60 at 2 GHz). After annealing, the ε′ and ε′′ have an obviously increase, while the μ′′ decrease. The generation of CoFe2O4 phase can magnify μ′. The conductivity has been significantly improved after annealing, and the ε′′ in high frequency is mainly the role of conductive loss. Moreover, the annealing temperature has a significant impact on the relative content of CoFe2O4 and the precipitated BCC to FCC, and the change of EM parameters agree with this transformation.Conflicts of interest
There are no conflicts to declare.Acknowledgements
The authors acknowledge the supported by Program for the National Key R&D Program of China (2017YFB0703103), the National Natural Science Foundation of China (No. 51577021, U1704253), the Fundamental Research Funds for the Central Universities (DUT17GF107), the Industry-University-Research Collaboration Project of Aviation Industry Corporation of China (cxy2103DLLG34).Notes and references
- Y. Z. Shi, B. Yang and K. L. Peter, Metals, 2017, 7, 43 Search PubMed.
- X. M. Liu, Z. J. Yu, R. Ishikawa, L. Q. Chen, X. F. Liu, X. W. Yin, Y. C. Ikuhara and R. Riedel, Acta Mater., 2017, 130, 83–93 Search PubMed.
- Z. Guo, S. E. Lee, H. Kim, S. Park, H. T. Hahn, A. B. Karki and D. P. Young, Acta Mater., 2009, 57, 267–277 Search PubMed.
- S. S. Zuo, H. X. Bai, Q. Han, H. G. Liao, H. B. Gu and Z. F. Chen, Mater. Des., 2017, 114, 25–30 Search PubMed.
- A. Shah, Y. H. Wang, H. Huang, L. Zhang, D. X. Wang, L. Zhou, Y. P. Duan, X. L. Dong and Z. D. Zhang, Compos. Struct., 2015, 131, 1132–1141 Search PubMed.
- A. Shah, A. Ding, Y. H. Wang, L. Zhang, D. X. Wang, J. Muhammad, H. Huang, Y. P. Duan, X. L. Dong and Z. D. Zhang, Carbon, 2016, 96, 987–997 CrossRef CAS.
- J. Y. He, H. Wang, H. L. Huang, X. D. Xu, M. W. Chen, Y. Wu, X. J. Liu, T. G. Nieh, K. An and Z. P. Lu, Acta Mater., 2016, 102, 187–196 CrossRef CAS.
- C. Y. Shang, E. Axinte, J. Sun, X. T. Li, P. Li, J. W. Du, P. C. Qiao and Y. Wang, Mater. Des., 2017, 117, 193–202 CrossRef CAS.
- A. J. Zhang, J. S. Han, B. Su, P. D. Li and J. H. Meng, Mater. Des., 2017, 114, 253–263 CrossRef CAS.
- J. M. Zhu, H. M. Fu, H. F. Zhang, A. M. Wang, H. Li and Z. Q. Hu, Mater. Sci. Eng., A, 2010, 527, 7210–7214 CrossRef.
- S. Praveen, B. Joysurya, K. Sanjay, K. G. Pradeep and S. K. Ravi, Mater. Des., 2017, 134, 426–433 CrossRef.
- C. M. Lin and H. L. Tsai, Intermetallics, 2011, 19, 288–294 CrossRef CAS.
- B. Schuh, F. Mendez-Martin, B. Völker, E. P. George, H. Clemens, R. Pippan and A. Hohenwarter, Acta Mater., 2015, 96, 258–268 CrossRef CAS.
- H. P. Chou, Y. S. Chang, S. K. Chen and J. W. Yeh, Mater. Sci. Eng., B, 2009, 163, 184–189 CrossRef CAS.
- D. H. Xiao, P. F. Zhou, W. Q. Wu, H. Y. Diao, M. C. Gao, M. Song and P. K. Liaw, Mater. Des., 2017, 116, 438–447 CrossRef CAS.
- J. W. Yeh, S. K. Chen, S. J. Lin, J. Y. Gan and T. S. Chin, Adv. Eng. Mater., 2004, 6, 299–303 CrossRef CAS.
- J. Y. He, W. H. Liu, H. Wang, Y. Wu, X. J. Liu, T. G. Nieh and Z. P. Lu, Acta Mater., 2014, 62, 105–113 CrossRef CAS.
- X. Yang and Y. Zhang, Mater. Chem. Phys., 2012, 132, 233–238 CrossRef CAS.
- S. Guo and C. T. Liu, Prog. Nat. Sci.: Mater. Int., 2011, 21, 433–446 CrossRef.
- R. Raghavan, K. C. Hari Kumar and B. S. Murty, J. Alloys Compd., 2012, 544, 152–158 CrossRef CAS.
- Y. J. Zhao, J. W. Qiao, S. G. Ma, M. C. Gao, H. J. Yang, M. W. Chen and Y. Zhang, Mater. Des., 2016, 96, 10–15 CrossRef CAS.
- Y. Zhang, T. T. Zuo, Y. Q. Cheng and K. L. Peter, Sci. Rep., 2013, 3, 1455 CrossRef PubMed.
- B. Y. Wu, W. P. Chen, Z. F. Jiang, Z. Chen and Z. Q. Fu, Mater. Sci. Eng., A, 2016, 676, 492–500 CrossRef CAS.
- M. Vaidya, S. Trubel, B. S. Murty, G. Wilde and S. V. Divinski, J. Alloys Compd., 2016, 688, 994–1001 CrossRef CAS.
- C. P. Lee, C. C. Chang, Y. Y. Chen, J. W. Yeh and H. C. Shih, Corros. Sci., 2008, 50, 2053–2060 CrossRef CAS.
- C. M. Liu, H. M. Wang, S. Q. Zhang, H. B. Tang and A. L. Zhang, J. Alloys Compd., 2014, 583, 162–169 CrossRef CAS.
- Q. Zhang, H. Xu, X. H. Tan, X. L. Hou, S. W. Wu, G. S. Tan and L. Y. Yu, J. Alloys Compd., 2017, 693, 1061–1067 CrossRef CAS.
- P. P. Yang, Y. Liu, X. C. Zhao, J. W. Cheng and H. Li, Adv. Powder Technol., 2016, 27, 1128–1133 CrossRef CAS.
- P. P. Yang, Y. Liu, X. C. Zhao, J. W. Cheng and H. Li, J. Mater. Res., 2016, 31, 2398–2406 CrossRef CAS.
- H. G. Yu, X. Huang, P. Wang and J. G. Yu, J. Phys. Chem. C, 2016, 120, 3722–3730 CAS.
- D. Lang, F. Y. Cheng and Q. J. Xiang, Catal. Sci. Technol., 2016, 6, 6207–6216 CAS.
- K. L. He, J. Xie, Z. H. Yang, R. C. Shen, Y. P. Fang, S. Ma, X. B. Chen and X. Li, Catal. Sci. Technol., 2017, 7, 1193–1202 CAS.
- M. G. Han, D. F. Liang, J. L. Xie and L. J. Deng, J. Appl. Phys., 2012, 111, 07A317 CrossRef.
- M. G. Han and L. J. Deng, J. Magn. Magn. Mater., 2013, 337–338, 70–73 CrossRef CAS.
- Z. Q. Zhang, J. Q. Wei, W. F. Yang, L. Qiao, T. Wang and F. Li, Physica B: Condens. Matter., 2011, 406, 3896–3900 CrossRef CAS.
- Y. B. Feng, C. M. Tang and T. Qiu, Mater. Sci. Eng., B, 2013, 178, 1005–1011 CrossRef CAS.
- Y. H. Wu, M. G. Han, T. Liu and L. J. Deng, J. Appl. Phys., 2015, 118, 023902 CrossRef.
- L. L. Song, Y. P. Duan, Y. H. Zhang and T. M. Wang, Comput. Mater. Sci., 2017, 138, 288–294 CrossRef CAS.
- Y. P. Duan, Z. Liu, Y. H. Zhang and M. Wen, J. Mater. Chem. C, 2013, 1, 1990–1994 RSC.
- Y. H. Wu, M. G. Han, Z. K. Tang and L. J. Deng, J. Appl. Phys., 2014, 115, 163902 CrossRef.
- G. Li, Y. Cui, N. Zhang, X. Wang and J. L. Xie, Physica B: Condens. Matter., 2016, 481, 1–7 CrossRef CAS.
- Y. P. Duan, Y. H. Zhang, T. M. Wang, S. C. Gu, X. Li and X. J. Lv, Mater. Sci. Eng., B, 2014, 185, 86–93 CrossRef CAS.
- Y. P. Duan, S. C. Gu, Z. L. Zhang and M. Wen, J. Alloys Compd., 2012, 542, 90–96 CrossRef CAS.
Footnote |
| † Electronic supplementary information (ESI) available. See DOI: 10.1039/c8ra01762j |
| This journal is © The Royal Society of Chemistry 2018 |


