 Open Access Article
Covalently-functionalized graphene oxide via introduction of bifunctional phosphorus-containing molecules as an effective flame retardant for polystyrene
Kang Dai *a,
Shuai Suna,
Wenbin Xu*a,
Yuan Songa,
Zhenzhen Denga and
Xiaodong Qianb
aSchool of Environmental Science and Engineering, Guangdong University of Technology, Guangzhou, Guangdong 510006, P. R. China. E-mail: xuwenbin@gdut.edu.cn; daikang@mail.ustc.edu.cn; Fax: +86 20 39322296; Tel: +86 20 39322296
bChinese People's Armed Police Force Academy, Langfang, Heibei 065000, P. R. China
First published on 11th July 2018
Abstract
Covalently-functionalized graphene oxide (FGO) was successfully prepared by grafting a novel phosphorus-containing flame retardant, [2-((6-oxidodibenzo[c,e][1,2]oxaphosphinin-6-yl)methoxy)acryloxyethylchlorophosphate, PACP], to graphene oxide (GO). The resulting FGO demonstrated hydrophobicity and stability in polar solvents such as N,N-dimethylformamide (DMF). The reactive vinyl groups of PACP attached to FGO further copolymerized with styrene to produce polystyrene-FGO (PS-FGO) nanocomposites. PS-FGO samples showed obviously improved fire-resistance, thermal behavior and glass transition temperature in comparison with those of neat PS and PS-GO samples, due to the good dispersion of FGO in PS as well as the strong interfacial bonds between FGO and the matrix. In addition, thermogravimetry-Fourier transform infrared (TG-FTIR) results indicated that the evolution of volatile products from PS decomposition was significantly inhibited by the introduction of FGO. Furthermore, scanning electron microscopy (SEM) and FTIR and Raman spectroscopy were employed to investigate the char residue, elaborating the flame-retardance mechanism.
1. Introduction
Nowadays, nanotechnology is proved to be an efficient way to improve the fire safety resistance performance of materials, because only adding a small amount of nanofillers can significantly improve the thermal stability and combustion performance of materials.1–3 Recently, graphene has attracted wide public interest, due to its high strength, conductivity and specific surface area, attractive for improving the mechanical, thermal, and gas barrier properties of polymer materials.4,5 In recent years, graphene and its derivatives as flame retardants have been extensively applied in various polymers to improve their fire safety. The single addition of graphene, however, is prone to agglomerate, which is attributed to the strong van der Waals attractions among graphene sheets.6,7 This drawback will give rise to the nonuniform dispersion of graphene and unfavorable graphene-matrix interfacial adhesion, which will further weaken the property enhancement of graphene-based nanocomposites and limit the utilization of graphene to a great extent. As a widely employed strategy to solve this issue, surface functionalization of graphene has drawn the attention of many researchers over the years.Generally, surface functionalization includes non-covalent and covalent functionalization.8 Non-covalent functionalization weakens the van der Waals force between graphene sheets, thereby enhancing their dispersion in solvents and polymers. Nevertheless, non-covalent interactions including hydrophobic and electrostatic interactions, as well as π–π stacking can cause a weak adhesion for the graphene-matrix interface, giving rise to a decrease in the interfacial load transfer. Moreover, the enhancement effect on the properties of composites is debilitated by the residual additive modifiers (e.g., surfactants). In comparison with that, covalent functionalization involves the introduction of tailored functional molecules to graphene or graphene-based materials via covalent linkages. The strongly attached chains can further chemically bond with the polymeric matrix, serving as connections for graphene and the matrix to form an integral part. The resulting nanocomposites mostly demonstrate conspicuous enhancement in properties. Consequently, covalent functionalization distinguishes from other approaches in improving the properties of materials as reported by researchers. Bao et al.9,10 prepared FGO via grafting hexachlorocyclo-, triphosphazene and hydroxyethyl acrylate (HEA) to GO. The produced nanocomposites with FGO demonstrate notable enhancement in both peak heat release rate (PHRR) and total heat release (THR) reduction as well as char formation increase. Yuan et al.11 reported the preparation of FGO/polypropylene (PP) nanocomposites. In a 2.0 wt% amount of addition, the FGO modified with melamine contributes a 29% decrease to PHRR as compared with that of pure PP, and the fire resistance of these nanocomposites is also improved obviously.
For DOPO and its derivates, these phosphorus-based flame retardants can exert flame retardant action in gas phase.12 In condensed phase flame retardant action, phosphate species are capable of catalyzing acrylic derivates to form cohesive char layers for the protection of underlying polymer matrix.13–15 Consequently, combining both condensed and gas phases actions will be conductive to the fire-resistance performance of flame retardants.
Polystyrene (PS) with prominent thermal and chemical resistance, low density, good mechanical properties and convenience of processing and molding, has been widely applied in industrial fields. Whereas, the high flammability and subsequent severe dripping combined with the released heavy smoke and toxic gas during combustion greatly limit the further application of PS in some fields. Therefore, it is imperative to develop high-performance flame retardants to reduce the flammability of PS.
2. Experimental
2.1. Materials
GO was obtained using a modified Hummers' method,16,17 and graphite powder with an average particle size of 800 mesh and a purity of > 99% was supplied by Aladdin reagent Co. Ltd (Shanghai, China). Potassium permanganate (KMnO4) was purchased from Kaixin chemical reagent Co. Ltd (Hengyang, China). Hydrochloric acid (HCl), sulfuric acid (H2SO4), barium chloride (BaCl2) and anhydrous ethanol were purchased from Guangzhou chemical reagent factory. Sodium nitrate (NaNO3) was supplied by Shanghai Taitan chemical Co. Ltd. Hydrogen peroxide (H2O2, 30% aq.) dimethylbenzene, N,N-dimethylformamide (DMF), triethylamine (TEA) and styrene were purchased from Damao Chemical Reagent Factory (Tianjin, China). 9,10-Dihydro-9-oxa-10-phosphaphenanthrene-10-oxide (DOPO) was supplied by Shenzhen Jinlong Chemical Co. Ltd (Shenzhen, China). Paraformaldehyde (HCHO) and benzoyl peroxide (BPO) was supplied by Aladdin reagent Co. Ltd (Shanghai, China). Hydroxyethyl acrylate (HEA) and phosphorus oxychloride were provided by Yangzhou Weide Chemical Raw Material Co. Ltd (Shanghai, China). Styrene was purified before used.2.2. Synthesis of 6-(hydroxymethyl) dibenzo [c,e][1,2] oxaphosphinine 6-oxide (DOPO-OH)
Firstly, DOPO (43.234 g, 0.2 mol) and dimethyl benzene (100 ml) were added into a 500 ml three-necked glass flask which was equipped with a mechanical stirrer, a reflux condenser and a nitrogen inlet. The mixture was stirred and heated slowly to 90 °C for 1 h under nitrogen atmosphere until DOPO was dissolved completely in dimethyl benzene. Next, paraformaldehyde (6.006 g, 0.2 mol) was added into the mixture. The reaction mixture was heated to 140 °C and kept at the refluxing temperature for another 6 h. Finally, the precipitate was filtered and washed with dimethyl benzene after cooling to room temperature, yielding a white powder. The powder was dried under a vacuum at 70 °C for 12 h.The synthetic procedures for DOPO-OH are illustrated in Scheme 1.
2.3. Synthesis of FGO
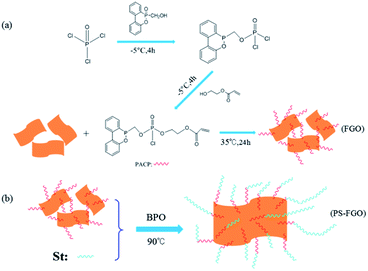
In an ice bath machine POCl3 (9.200 g, 0.06 mol) and DMF (70 ml) were firstly fed into a 500 ml three-neck flask equipped with a dropping funnel, a nitrogen inlet and a mechanical stirrer. The mixture was stirred vigorously and cooled to −5 °C under dry N2. Then a mixture of TEA (20.238 g, 0.20 mol) and DMF (20 ml) was added. After 20 min, DOPO-OH (14.776 g, 0.06 mol) dissolved in DMF (60 ml) were then added dropwise for 2 h and maintained at this temperature for an additional 4 h. After that, another mixture of HEA (6.967 g, 0.06 mol) and DMF (40 ml) was slowly added, and the resulting mixture was maintained stirring for additional 4 h to obtain PACP. Then the mixture was heated to room temperature. GO (1.0 g) was added and kept stirring for another 12 h. Finally, the mixture was filtered and washed thoroughly with deionized water. The resultant product was dried under a vacuum at 35 °C for 24 h, yielding a black powder (FGO, illustrated in Scheme 2a).2.4. Preparation of PS-GO and PS-FGO nanocomposites
In different ratios, GO/FGO was mixed with styrene to prepare PS-GO and PS-FGO nanocomposites, and BPO was used as an initiator at a concentration of 2 wt%. Each mixture was stirred vigorously with ultrasonication for 2 h. Then the mixture was heated to 90 °C and stirred until a critical viscosity. Subsequently, all samples were cast into polytetrafluoroethylene molds, cured at 90 °C for 8 h and post cured at 120 °C for 4 h. According to the amount of GO/FGO in nanocomposites, the cured samples are referred to hereafter as and PS-GO1.0, PS-FGO1.0, PS-FGO2.0 and PS-FGO3.0. The schematic reaction route between FGO and styrene is presented in Scheme 2b.2.5. Characterization
Fourier transform infrared (FTIR) spectra were recorded with a Nicolet 6700 spectrometer (Nicolet Instrument Company, USA). For solid samples, KBr discs were prepared. The 1H NMR spectrum was recorded using a Bruker AVANCE III 400 MHz, and the spectrum was referenced by solvent shifts (DMSO-d6 = 2.50 ppm). The morphologies of samples were examined by a SEM solver p47 pro using charge contrast imaging mode. Transmission electron microscopy (TEM) analysis was performed on a JEM-2100 transmission electron microscope at 200 kV. X-ray diffraction (XRD) experiments were conducted on a D/MAX-IIIC X-ray diffractometer with Cu Kα radiation. Thermal gravimetric analysis (TGA) was conducted on a PE TGA-7 calorimeter from room temperature to 700 °C at a linear heating rate of 20 °C min−1 under air or nitrogen atmosphere. Differential scanning calorimetry (DSC) was performed on a DSC Q2000 instrument (TA Ltd., USA) at a heating rate of 10 °C min−1 under nitrogen atmosphere. Micro combustion calorimeter (MCC) test was carried out in a MCC-2 (Govmark Inc., New York, USA). According to ASTM D 7309, 5–7 mg of powdery samples were heated to 700 °C at a heating rate of 1 °C s−1 in an inert gas steam (80 ml min−1). Limiting Oxygen Index (LOI) was measured using a HC-2C limiting Oxygen Index Analyzer instrument on test bars of size 100 it6.5 × 3.0 mm3, according to the ASTM standard D2863-77. Raman spectroscopy measurements were conducted at room temperature using a Lab RAMHR 800UV Laser Raman spectrometer with a laser wavelength of 633 nm, and the Gaussian peak type in the Peak Fitting Module of Origin 8.0 software was employed in curve fitting to determine spectral parameters.3. Results and discussion
3.1. Structural and morphological characterization of DOPO-OH, GO, FGO and PS-GO/FGO nanocomposites
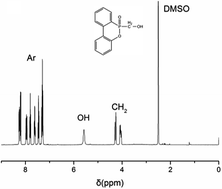
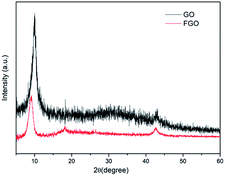
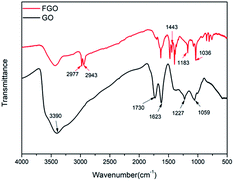
The structural characterization of DOPO-OH on 1H NMR spectrum is shown in Fig. 1. The peak at 3.35 ppm is assigned to the proton of –OH, and the chemical shifts δ = 3.90–4.40 ppm are attributed to the protons of –CH2–. Moreover, the peaks at 7.18–8.41 ppm belong to the 8H atoms of aromatic rings.18,19 All of these 1H NMR results conform to the expected structure of DOPO-OH.The chemical structures of GO and FGO were characterized by XRD. As shown in Fig. 2, for GO, in addition to a weak (100) reflection peak at 42°, another sharp diffraction peak at scattering angle 2θ = 10.1° is observed, which corresponds to the (002) reflection of GO.20 After functionalization, the intensity of the (002) peak in FGO significantly reduces, suggesting a decrease in the ordered arrangement of GO. Meanwhile, the (002) characteristic peak shifts to 9.0°, indicative of an enlarged interlayer spacing. This is accounted for by the intercalation of PACP molecules, which react with the hydroxyl groups and covalently bond on GO surface. Moreover, variations of the functionalized groups on GO and FGO are further corroborated by the FTIR spectroscopy measurements as shown in Fig. 3. Some typical absorption peaks characteristic of oxygen-containing groups can be clearly seen for GO: the stretching vibration of –OH (3390 cm−1), the stretching vibration of C![[double bond, length as m-dash]](https://www.rsc.org/images/entities/char_e001.gif) O (1730 cm−1), C
O (1730 cm−1), C![[double bond, length as m-dash]](https://www.rsc.org/images/entities/char_e001.gif) C or H2O vibration (1623 cm−1), the stretching vibration of C–O–C (1227 cm−1) and C–OH vibration (1059 cm−1).10 In contrast, the appearance of some new peaks can been found in the spectrum of FGO. In addition to the vibration of C–H (2940–2980 cm−1), the peaks at 1443, 1183 and 1036 cm−1 correspond to the stretching of P–C, P
C or H2O vibration (1623 cm−1), the stretching vibration of C–O–C (1227 cm−1) and C–OH vibration (1059 cm−1).10 In contrast, the appearance of some new peaks can been found in the spectrum of FGO. In addition to the vibration of C–H (2940–2980 cm−1), the peaks at 1443, 1183 and 1036 cm−1 correspond to the stretching of P–C, P![[double bond, length as m-dash]](https://www.rsc.org/images/entities/char_e001.gif) O and P–O–C, respectively.19,21 The emergence of these new characteristic peaks confirms the structure of FGO as shown in Scheme 2a.
O and P–O–C, respectively.19,21 The emergence of these new characteristic peaks confirms the structure of FGO as shown in Scheme 2a.
The surface morphologies of GO and FGO were analyzed by TEM. The TEM image of GO (Fig. 4a) exhibits a typical transparent and wrinkled structure, revealing the presence of large single GO sheets. Different from the surface morphology of GO, after chemical functionalization the surface of FGO is found with some black shadows (Fig. 4b), and the typical layer structure, however, is not destroyed, which are in conformity with the FTIR results and further corroborate that these phosphorus-containing flame retardants were successfully grafted to the surface of GO. For analyzing the dispersion of nanosheets in polymer matrix, the fracture surfaces of samples were characterized by SEM. As shows in Fig. 4c, agglomerated GO nanosheets can be found in PS-GO1.0, due to the strong van der Waals attractions among GO nanosheets22 and the poor interfacial interaction between GO and PS molecular chains. In contrast, the PS-FGO3.0 fracture surface shows no pulling-out of nanosheets. Because of the covalently functionalized molecules on the surface of FGO, the repulsion forces among FGO nanosheets are enhanced, and FGO can be well dispersed in polymer matrix. Moreover, these functionalized flame retardant molecules covalently react with styrene monomers during polymerization. As a result, FGO nanosheets are integrated into PS molecular chains, leading to the disappearance of the interface between FGO and the matrix.
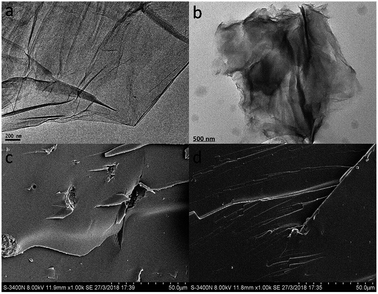 | ||
| Fig. 4 TEM images of (a) GO and (b) FGO, and SEM images of the fractured surfaces of (c) PS-GO1.0 and (d) PS-FGO3.0. | ||
Because of the existence of numerous hydrophilic groups (e.g., hydroxyl and carboxyl groups), GO is readily exfoliated in aqueous media to form stable colloidal suspensions of thin sheets.23 It was observed that after ultrasonication and standing for 1 week, the GO can be stably dispersed in H2O, as illustrated in Fig. 5. In the case of FGO, in contrast, obvious precipitation can be seen in H2O for the hydrophobic nature, and it strongly tends to agglomerate. However, FGO can well suspend in polar solvents such as DMF, forming a deeply black solution. It can be explained by that the strongly polar moiety PACP is favorably dissolved in DMF, and the reaction between this phosphorus-containing molecule and GO improves the polarity of FGO. As a result, FGO shows much better dispersibility in DMF in contrast to that of GO.
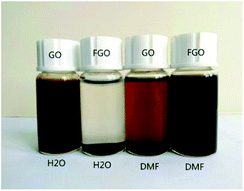 | ||
| Fig. 5 Optical pictures of GO and FGO dispersed in H2O and DMF after ultrasonication for 5 min and waiting for 1 week. | ||
3.2. Thermal stability
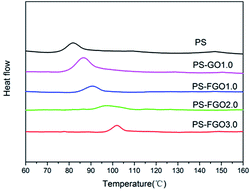
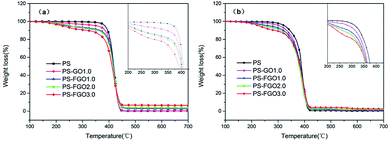
From the perspective of industrial application, the operating temperature range of a polymer material primarily depends on its Tg. Specifically, a wide operating temperature range of a polymer material requires a high Tg. The wrinkled surface of GO sheets (see Fig. 4a) with nanoscale surficial roughness facilitates the mechanical interlocking effect and constrains the mobility of polymer chains.24 Consequently, when combined with GO, PS-GO1.0 shows an increase of Tg value by 4 °C in comparison with the 82 °C of pure PS,25 as confirmed by DSC (Fig. 6). Interestingly, a higher Tg value in PS-FGO1.0 is observed, and the Tg value of PS-FGO nanocomposite increases from 90 to 102 °C when the amount of FGO reaches 3 wt%, providing a 20 °C increase for Tg. The enhancement in Tg of PS-FGO nanocomposites can be accounted for by two factors. In addition to the physical hindrance of PS chains movement by the nanosheets, PACP in FGO is covalently bonded with PS chains and plays the role of connection for GO and the polymer matrix. These combined effects contribute to a more significant restriction in the movement of PS chain segments. Therefore, much higher Tg values are shown in PS-FGO nanocomposites.To understand the thermal behavior of PS after incorporation of GO/FGO, TGA was conducted to evaluate the thermal degradation process of all samples. The corresponding TG curves and detailed data are presented in Fig. 7 and Table 1, respectively. Under nitrogen condition, the TG curve of pure PS shows one-stage weight loss in the temperature range of 350–500 °C. During this degradation, PS undergoes a chain-scissoring process followed by depolymerization with the formation of styrene monomer, oligomers and some volatiles.26 Finally, a limited char residue is observed. For PS-GO1.0, due to the lower thermal stability of GO,27 the temperature at 10 wt% weight loss (T0.1) is somewhat lower than that of PS. Meanwhile, in comparison with the onset degradation temperatures of PS-GO1.0, a decrease in T0.1 of PS-FGO1.0 is observed, and this can be explained by the cleavage of the relatively weak P–O–C linkage in FGO, which can accelerate the degradation of the matrix.28 Different from the one-stage weight loss in PS, the two-stage weight loss between 150 and 350 °C becomes increasingly evident with an increase in the FGO content of these samples. This indicates that the introduction of FGO into PS significantly alters the decomposition process. Moreover, the enhancement in char formation is worthy of note. At 700 °C only a 0.33 wt% char residue is seen for PS, however the char residue of PS-FGO3.0 is as high as 6.50 wt%. In addition, the 2.70 wt% char residue of PS-FGO1.0 is obviously higher than that of PS-GO1.0. This improvement is attributed to two factors: the GO nanosheets act as physical barriers to protect the PS matrix from thermal degradation; the flame retardant molecular chains on well dispersed FGO surface have a catalytic effect on char formation. The resulting high char residue with better thermal stability in condensed phase can retard the transfer of oxygen and flammable gaseous products, restrain thermal conductivity and endow higher decomposition temperatures to the matrix.29,30 Therefore, PS-FGO3.0 with the highest char residue exhibits the lowest maximum mass loss rate (MMLR). Specifically, the MMLR for PS-FGO3.0 is reduced by 28.5%, relative to that of the neat PS. In air, the quantified temperatures [e.g., T0.1, the temperature corresponding to the maximum weight loss (Tmax)] for all samples are somewhat lower than these under nitrogen, implying that these polymer materials degradation may be accelerated by oxygen, and the primary carbonaceous char further oxidizes after 430 °C, as observed in Fig. 7-b. However, the thermo-oxidative stability of the samples with FGO at high temperatures is enhanced, as corroborated by the increased char residues at 700 °C. This improvement in the inhibition of thermo-oxidative degradation of PS-FGO nanocomposites is attributed to the well dispersion of FGO as well as the strong interfacial interaction between FGO and PS, which hinders the thermal movement of polymer chains at high temperatures, promotes char formation and contributes to further enhancement in thermo-oxidative stability.
| Samples | T0.1 (°C) (N2/air) | Tmax (°C) (N2/air) | Tg (°C) | MMLR (%/°C) (N2/air) | Residues at 700 °C (wt%) (N2/air) |
|---|---|---|---|---|---|
| Error | ±1 | ±1 | ±1 | ±0.01 | ±0.01 |
| PS | 393/344 | 421/393 | 82 | 2.77/2.39 | 0.33/0.21 |
| PS-GO1.0 | 384/332 | 421/393 | 86 | 2.56/1.96 | 0.81/0.43 |
| PS-FGO1.0 | 364/320 | 419/394 | 90 | 2.47/1.86 | 2.70/1.34 |
| PS-FGO2.0 | 354/309 | 417/390 | 97 | 2.23/1.80 | 3.77/1.85 |
| PS-FGO3.0 | 322/288 | 422/398 | 102 | 1.98/1.64 | 6.50/2.66 |
3.3. Combustion properties
The combustion performance of PS and PS nanocomposites was evaluated by LOI and MCC test. LOI is an important and representative parameter to evaluate the flammability of materials,31 and the LOI values of all samples are summarized in Table 2. The pure PS is high flammable with a low LOI value of 19.0. With the increase of FGO content, however, the LOI values of samples increase. The LOI value reaches 22.5 with 1 wt% amount of FGO and further increases to 25.0 for PS-FGO3.0, suggesting the flame retardancy of these nanocomposites is enhanced by the incorporation of FGO.| Sample | HRC (J g−1 k−1) | THR (kJ g−1) | TpHRR (°C) | LOI (%) |
|---|---|---|---|---|
| Error | ±1 | ±0.1 | ±1 | ±0.5 |
| PS | 984 | 26.7 | 441 | 19.0 |
| PS-GO1.0 | 799 | 24.2 | 441 | 21.0 |
| PS-FGO1.0 | 701 | 23.4 | 445 | 22.5 |
| PS-FGO2.0 | 631 | 22.7 | 438 | 24.0 |
| PS-FGO3.0 | 599 | 21.4 | 436 | 25.0 |
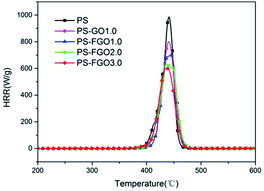
To further understand the combustion properties of all samples, MCC was used to evaluate their heat release. The heat release rate (HRR) curves of PS and PS nanocomposites and corresponding MCC data are presented in Fig. 8 and Table 2, respectively. It is evident that the total heat release (THR) of PS-FGO nanocomposites decreases as the FGO amount rises. Meanwhile, it can be observed that the 23.4 kJ g−1 THR value of PS-FGO1.0 is lower than that of PS-GO1.0. These results indicate that comparing to GO, FGO significantly facilitates the conversion degree of carbonization during combustion, resulting in more cohesive char instead of combustible volatiles, and fit well with the TGA experiments. Further, the reduced THR value suggests that less heat releases during combustion, which is beneficial to the control of potential fire hazard. For heat release capacity (HRC), as a good predictor of fire and flammability behavior, it is obtained by dividing the peak heat release rate by the heating rate and indicates the maximum capacity of a material to release combustion heat.32 While a high HRC value is observed for pure PS, introduction of FGO endows this polymer with a pronounced reduction in HRC. HRC value decreases from 984 J g−1 k−1 (PS) to 599 J g−1 k−1 (PS-FGO3.0), with a reduction of 39.1%. This improvement can be attributed to the reduced MMLR and the combustion heat of the decomposition products at that temperature.33 In the case of PS-FGO nanocomposites, as FGO can efficaciously catalyze char formation and hinder the thermal degradation of polymer matrix, less combustible gaseous products are formed with increasing FGO content. Thus reduced combustible volatiles coupled with the lowered MMLR contribute to the much better nonflammability of PS-FGO nanocomposites as compared to the neat PS. For PS-FGO nanocomposites with similar components, the difference in major decomposition products can be considered less than that in MMLRs. PS-FGO3.0 with the lowest MMLR, consequently, exhibits the best nonflammability.
The above results demonstrate that different from the mainly physical barrier effect of GO, well dispersed FGO can further react with the polymer molecule chains to improve the flame-retardant properties of PS-FGO nanocomposites.
3.4. Flame-retardant mechanism analysis
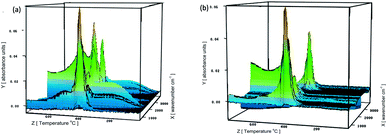
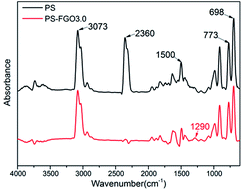
To understand the flame-retardant mechanism of PS-FGO nanocomposites, firstly, TG-FTIR spectroscopy is employed to analyze the evolved gaseous products of samples. Fig. 9 shows the 3D diagrams of the gaseous volatiles during combustion process of PS and PS-FGO3.0. It is evident that after incorporation of FGO, the volatile products decrease significantly before ca. 400 °C (Fig. 9-b), and the volatile gas intensity reaches the maximum value at ca. 420 °C, which is consistent with the MMLR temperature in TGA results. Characteristic FTIR signals of PS and PS-FGO3.0 pyrolysis products at MMLR were studied as presented in Fig. 10: CO2 (2360 cm−1), compounds containing aromatic rings (3073, 1500, 773, and 698 cm−1), and hydrocarbon groups (2980–2900 cm−1).15,34 Jang et al.35 reported that the mainly decomposed products of PS are styrene, dimer and trimer of phenyl alkenyl. Considering the DOPO moiety in FGO, it can exert flame retardant action in vapor phase. By comparing the spectra of both samples, although the characteristic peak of P–O group cannot be clearly detected at high temperatures, because of overlap with the C–O stretching band, it is observed that new adsorption band of P![[double bond, length as m-dash]](https://www.rsc.org/images/entities/char_e001.gif) O (1290 cm−1)12 appears in PS-FGO3.0, which is referred to PO2 in H3PO2.18,36 This volatile phosphorus compound can act as an effective flame quencher to inhibit the gas-phase chain reactions in combustion, improving the flame retardancy of PS-FGO nanocomposites.
O (1290 cm−1)12 appears in PS-FGO3.0, which is referred to PO2 in H3PO2.18,36 This volatile phosphorus compound can act as an effective flame quencher to inhibit the gas-phase chain reactions in combustion, improving the flame retardancy of PS-FGO nanocomposites.
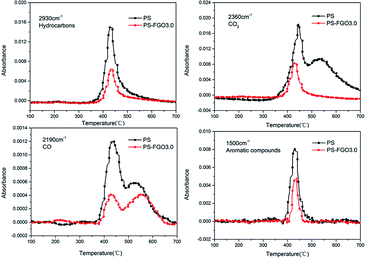
In order to further investigate the variations of various volatiles, the absorbance-time of representative pyrolysis products (hydrocarbons, CO2, CO and aromatic compounds) for PS and PS-FGO3.0 were detected, and the absorbance values were normalized, as exhibited in Fig. 11. Clear indications of a remarkable reduction in the absorbance intensity of the combustible volatiles (hydrocarbons and aromatic compounds) are observed in PS-FGO3.0, as compared to these in PS. This improvement is attributed to the barrier effect of well dispersed FGO sheets and promoted char residues. As less combustible volatiles are evolved, HRR will be reduced, and MMLR can also be lowered. These results are in accordance with both TGA and MCC data. Moreover, the absorbance intensity of these smoke and toxic gases (CO2 and CO) in PS-FGO3.0 are much lower than these in PS, indicative of the prominent adsorption and barrier effects of FGO nanosheets as well as their strong interfacial bonds with matrix. Therefore, these much decreased heat, smoke and toxic gases in PS-FGO3.0 give evidence that incorporation of FGO can effectively reduce the fire hazard of PS-FGO nanocomposites.
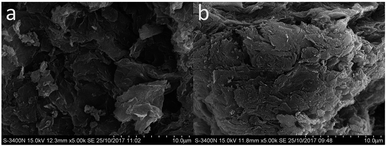
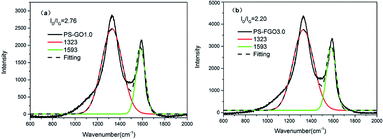
Both char yield and char morphology are crucial to the flame retardant action of polymers in condensed phase. As the former TGA results show, increased char residues are seen for PS-FGO nanocomposites. To gain further insight into the char morphology of PS nanocomposites, corresponding char residues were prepared as reported previously and investigated by SEM.37 Fig. 12 shows SEM images of the micromorphologies of PS-GO1.0 and PS-FGO3.0 char residues. As illustrated in Fig. 12a, the char residue of PS-GO1.0 appears to contain numerous pits and pores with a loose structure. PS-FGO3.0 char residue, in contrast, is much improved and demonstrates a compact and smooth surface (Fig. 12b), suggesting that FGO can catalyze the matrix to form cohesive char. Further, the microstructures of these char residues was investigated by Raman spectroscopy. As illustrated in Fig. 13, the spectra of both samples exhibit two highly overlapping diffusion bands, which are typical of graphitic phases.38 The former, at ca.1593 cm−1 (G band), represents the first order scattering E2g phonon of a sp2 hybrid carbon atom; in contrast, the latter, at ca.1323 cm−1 (D band), accounts for the oscillation of disordered carbon or glassy carbon layer rocking carbon atom.39 Specifically, the intensity ratio of D and G bands (ID/IG) is indicative of the degree of graphitization in carbon materials (i.e., the lower the value of ID/IG, the better the microstructure of the char residue is, with fewer defects).40 According to Fig. 13, the ID/IG ratios of PS-GO1.0and PS-FGO3.0 are 2.76 and 2.20, respectively. Although GO with lower thermal stability is prone to oxidation, the functionalized flame retardant molecules on FGO surface can catalyze the formation of cohesive char to protect FGO nanosheets from degradation, contributing to the decrease in ID/IG ratio. The above SEM and Raman results indicate that both the graphitization degree and thermal stability of the char microstructure are considerably enhanced by the incorporation of FGO. Consequently, the resulting char residue with much improved microstructure can act as effective thermal insulator to retard the release of combustible gases and inhibit the mass and heat transfer.
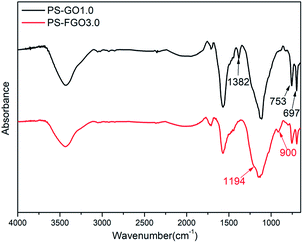
For a better understanding of the flame retardant action of PS-FGO nanocomposites in condensed phase, FTIR spectroscopy is employed to investigate the char residues of PS-GO1.0 and PS-FGO3.0 (Fig. 14). For PS, peaks at 1382, 753 and 697 cm−1 are assigned to the C–H out of plane bending vibration.5,39 Concurrently with the intensities of these peaks decrease in PS-FGO3.0, the appearance of new characteristic peaks is observed. Peak at 1194 cm−1, characteristic of P–O–Ar, demonstrates the formation of a phosphocarbonaceous structure.40 Moreover, another broad peak, ascribed to the asymmetric stretching vibration of P–O–P in polyphosphate species,41 can be found at 900 cm−1, indicating that the phosphate species can further undergo cross-linking reaction to form a more complex structure with better thermal stability. Thus, the presence of polyphosphate species is capable of catalyzing the formation of highly structured char, as corroborated by both SEM and Raman spectroscopy. This optimized char residue combined with FGO nanosheets can serve as effective barriers to hinder thermal conductivity, constrain mass transfer and weaken exothermic reaction, improving the flame retardancy of PS nanocomposites in condensed phase.
4. Conclusions
In this work, a phosphorus-containing flame retardant (PACP) covalently functionalized graphene oxide was prepared and incorporated into styrene by radical bulk polymerization. Due to good dispersion as well as the characteristic structure of FGO, the resulting PS-FGO nanocomposites demonstrated significant enhancements in thermal properties and flame retardancy. Both the physical hindrance of well dispersed FGO nanosheets and their strong covalent linkages with PS molecular chains contribute a notable Tg increase to PS-FGO nanocomposites as measured by DSC. The TGA results revealed that incorporation of FGO into PS can remarkably promote the char yield at high temperatures and reduce the MMLR, contributing much improved thermal and thermo-oxidative stability. Moreover, much lower values of HRC and THR were seen for samples with FGO from the MCC test, in agreement with an enhancement of the LOI value. Furthermore, TG-FTIR, SEM, Raman spectroscopy and FTIR were employed to gain insight into the flame-retardance mechanism of PS-FGO nanocomposites, which explicitly described the different decomposition reactions in PS after incorporation of FGO and corroborated that the presence of FGO in PS can not only decease gaseous volatiles and inhibit the combustion chain reactions in gas phase, but also serve as physical barrier and further react with the polymer molecule chains to catalyze the formation of char residue with improved microstructure, exerting flame retardant action in the condensed phase. In short, all the reported results demonstrated the potential of this prepared FGO as an effective flame retardant to enhance the thermal behavior and flame retardancy of PS, providing a foundation for further study.Conflicts of interest
There are no conflicts to declare.Acknowledgements
This work was financially supported from the Natural Science Foundation of Guangdong Province (Grant No. 2015A030310124).Notes and references
- A. L. Higginbotham, J. R. Lomeda, A. B. Morgan and J. M. Tour, ACS Appl. Mater. Interfaces, 2009, 1, 2256–2261 CrossRef PubMed.
- Y. Yang, C.-E. He, W. Tang, C. P. Tsui, D. Shi, Z. Sun, T. Jiang and X. Xie, J. Mater. Chem. A, 2014, 2, 20038–20047 RSC.
- K. Zhou, W. Yang, G. Tang, B. Wang, S. Jiang, Y. Hu and Z. Gui, RSC Adv., 2013, 3, 25030 RSC.
- S. Stankovich, D. A. Dikin, G. H. Dommett, K. M. Kohlhaas, E. J. Zimney, E. A. Stach, R. D. Piner, S. T. Nguyen and R. S. Ruoff, Nature, 2006, 442, 282–286 CrossRef PubMed.
- Y. Han, T. Wang, X. Gao, T. Li and Q. Zhang, Composites, Part A, 2016, 84, 336–343 CrossRef.
- D. Zhuo, R. Wang, L. Wu, Y. Guo, L. Ma, Z. Weng and J. Qi, J. Nanomater., 2013, 2013, 1–7 CrossRef.
- K. Zhou, Z. Gui and Y. Hu, Composites, Part A, 2016, 80, 217–227 CrossRef.
- M. Fang, K. Wang, H. Lu, Y. Yang and S. Nutt, J. Mater. Chem., 2010, 20, 1982 RSC.
- C. Bao, Y. Guo, L. Song and Y. Hu, J. Mater. Chem., 2011, 21, 13942 RSC.
- C. Bao, Y. Guo, B. Yuan, Y. Hu and L. Song, J. Mater. Chem., 2012, 22, 23057 RSC.
- B. Yuan, H. Sheng, X. Mu, L. Song, Q. Tai, Y. Shi, K. M. Liew and Y. Hu, J. Mater. Sci., 2015, 50, 5389–5401 CrossRef.
- W. Hu, J. Zhan, N. Hong, T. R. Hull, A. A. Stec, L. Song, J. Wang and Y. Hu, Polym. Adv. Technol., 2014, 25, 631–637 CrossRef.
- Q. Tai, C. Bao, L. Song, S. Nie, Y. Hu and R. K. K. Yuen, Polym. Degrad. Stab., 2010, 95, 830–836 CrossRef.
- Q. Tai, L. Song, Y. Hu, R. K. K. Yuen, H. Feng and Y. Tao, Mater. Chem. Phys., 2012, 134, 163–169 CrossRef.
- Q. Tai, L. Song, X. Lv, H. Lu, Y. Hu and R. K. K. Yuen, J. Appl. Polym. Sci., 2012, 123, 770–778 CrossRef.
- Y. Huafeng, L. Fenghua, S. Changsheng, H. Dongxue, Z. Qixian, N. Li and I. Ari, J. Mater. Chem., 2009, 19, 4632–4638 RSC.
- J. H. S. William and R. E. Offeman, J. Am. Chem. Soc., 1958, 80, 1339 CrossRef.
- Y. Lin, S. Jiang, Z. Gui, G. Li, X. Shi, G. Chen and X. Peng, RSC Adv., 2016, 6, 86632–86639 RSC.
- S. Jiang, Y. Zhu, Y. Hu, G. Chen, X. Shi and X. Qian, Polym. Adv. Technol., 2016, 27, 266–272 CrossRef.
- W. Hu, B. Yu, S. D. Jiang, L. Song, Y. Hu and B. Wang, J. Hazard. Mater., 2015, 300, 58–66 CrossRef PubMed.
- F. Yinchun, Z. Xiang, X. Zhiqi and W. Yarong, J. Appl. Polym. Sci., 2017, 134, 1–9 Search PubMed.
- M. Fang, K. Wang, H. Lu, Y. Yang and S. Nutt, J. Mater. Chem., 2010, 20, 1982 RSC.
- Y. Zhang, X. Zheng, H. Wang and Q. Du, J. Mater. Chem. A, 2014, 2, 5304 RSC.
- Y. Han, Y. Wu, M. Shen, X. Huang, J. Zhu and X. Zhang, J. Mater. Sci., 2013, 48, 4214–4222 CrossRef.
- T. G. Fox and P. J. Flory, J. Appl. Phys., 1950, 21, 581–591 CrossRef.
- B. N. Jang and C. A. Wilkie, The thermal degradation of polystyrene nanocomposite, Polymer, 2005, 46, 2933–2942 CrossRef.
- Y. Niu, X. Zhang, J. Zhao, Y. Tian, X. Yan and Y. Li, J. Mater. Chem. A, 2014, 2, 10502 RSC.
- K. Dai, L. Song and Y. Hu, High Perform. Polym., 2013, 25, 938–946 CrossRef.
- X. Wang, L. Song, W. Pornwannchai, Y. Hu and B. Kandola, Composites, Part A, 2013, 53, 88–96 CrossRef.
- Z. Yang, Z. Gu, X. Yang, Z. Zhang, X. Wang, X. Chen and L. Yang, J. Therm. Anal. Calorim., 2017, 129, 303–314 CrossRef.
- A. D. La Rosa AR, J. T. Carter and P. T. McGrailBai, Polymer, 1999, 40, 4093–4098 CrossRef.
- R. E. Lyon, R. N. Walters and S. I. Stoliarov, Polym. Eng. Sci., 2007, 47, 1501–1510 CrossRef.
- Z. Huiqing, R. J. Farris and P. R. Westmoreland, Macromolecules, 2003, 36, 3944–3954 CrossRef.
- Y. Guo, C. Bao, L. Song, B. Yuan and Y. Hu, Ind. Eng. Chem. Res., 2011, 50, 7772–7783 CrossRef.
- B. N. Jang and C. A. Wilkie, Polymer, 2005, 46, 2933–2942 CrossRef.
- A. Granzow, Acc. Chem. Res., 1977, 11, 177–183 CrossRef.
- D. Price, L. K. Cunliffe, K. J. Bullett, T. R. Hull, G. J. Milnes, J. R. Ebdon, B. J. Hunt and P. Joseph, Polym. Degrad. Stab., 2007, 92, 1101–1114 CrossRef.
- D. A. Pethsangave, R. V. Khose, P. H. Wadekar and S. Some, ACS Appl. Mater. Interfaces, 2017, 9, 35319–35324 CrossRef PubMed.
- A. A. Bhutto, D. Vesely and B. J. Gabrys, Polymer, 2003, 44, 6627–6631 CrossRef.
- B. Serge, L. B. Michel, D. Rene and T. Jean-Michel, J. Chem. Soc., Faraday Trans., 1996, 92, 3435–3444 RSC.
- U. Braun, A. I. Balabanovich, B. Schartel, U. Knoll, J. Artner, M. Ciesielski, M. Döring, R. Perez, J. K. W. Sandler, V. Altstädt, T. Hoffmann and D. Pospiech, Polymer, 2006, 47, 8495–8508 CrossRef.
| This journal is © The Royal Society of Chemistry 2018 |


